. 2020 Apr 16;78(2):359-370.e6.
doi: 10.1016/j.molcel.2020.03.012. Epub 2020 Apr 3.

Differential Scaling of Gene Expression with Cell Size May Explain Size Control in Budding Yeast

Affiliations

Differential Scaling of Gene Expression with Cell Size May Explain Size Control in Budding Yeast

Yuping Chen et al. Mol Cell. .

Abstract

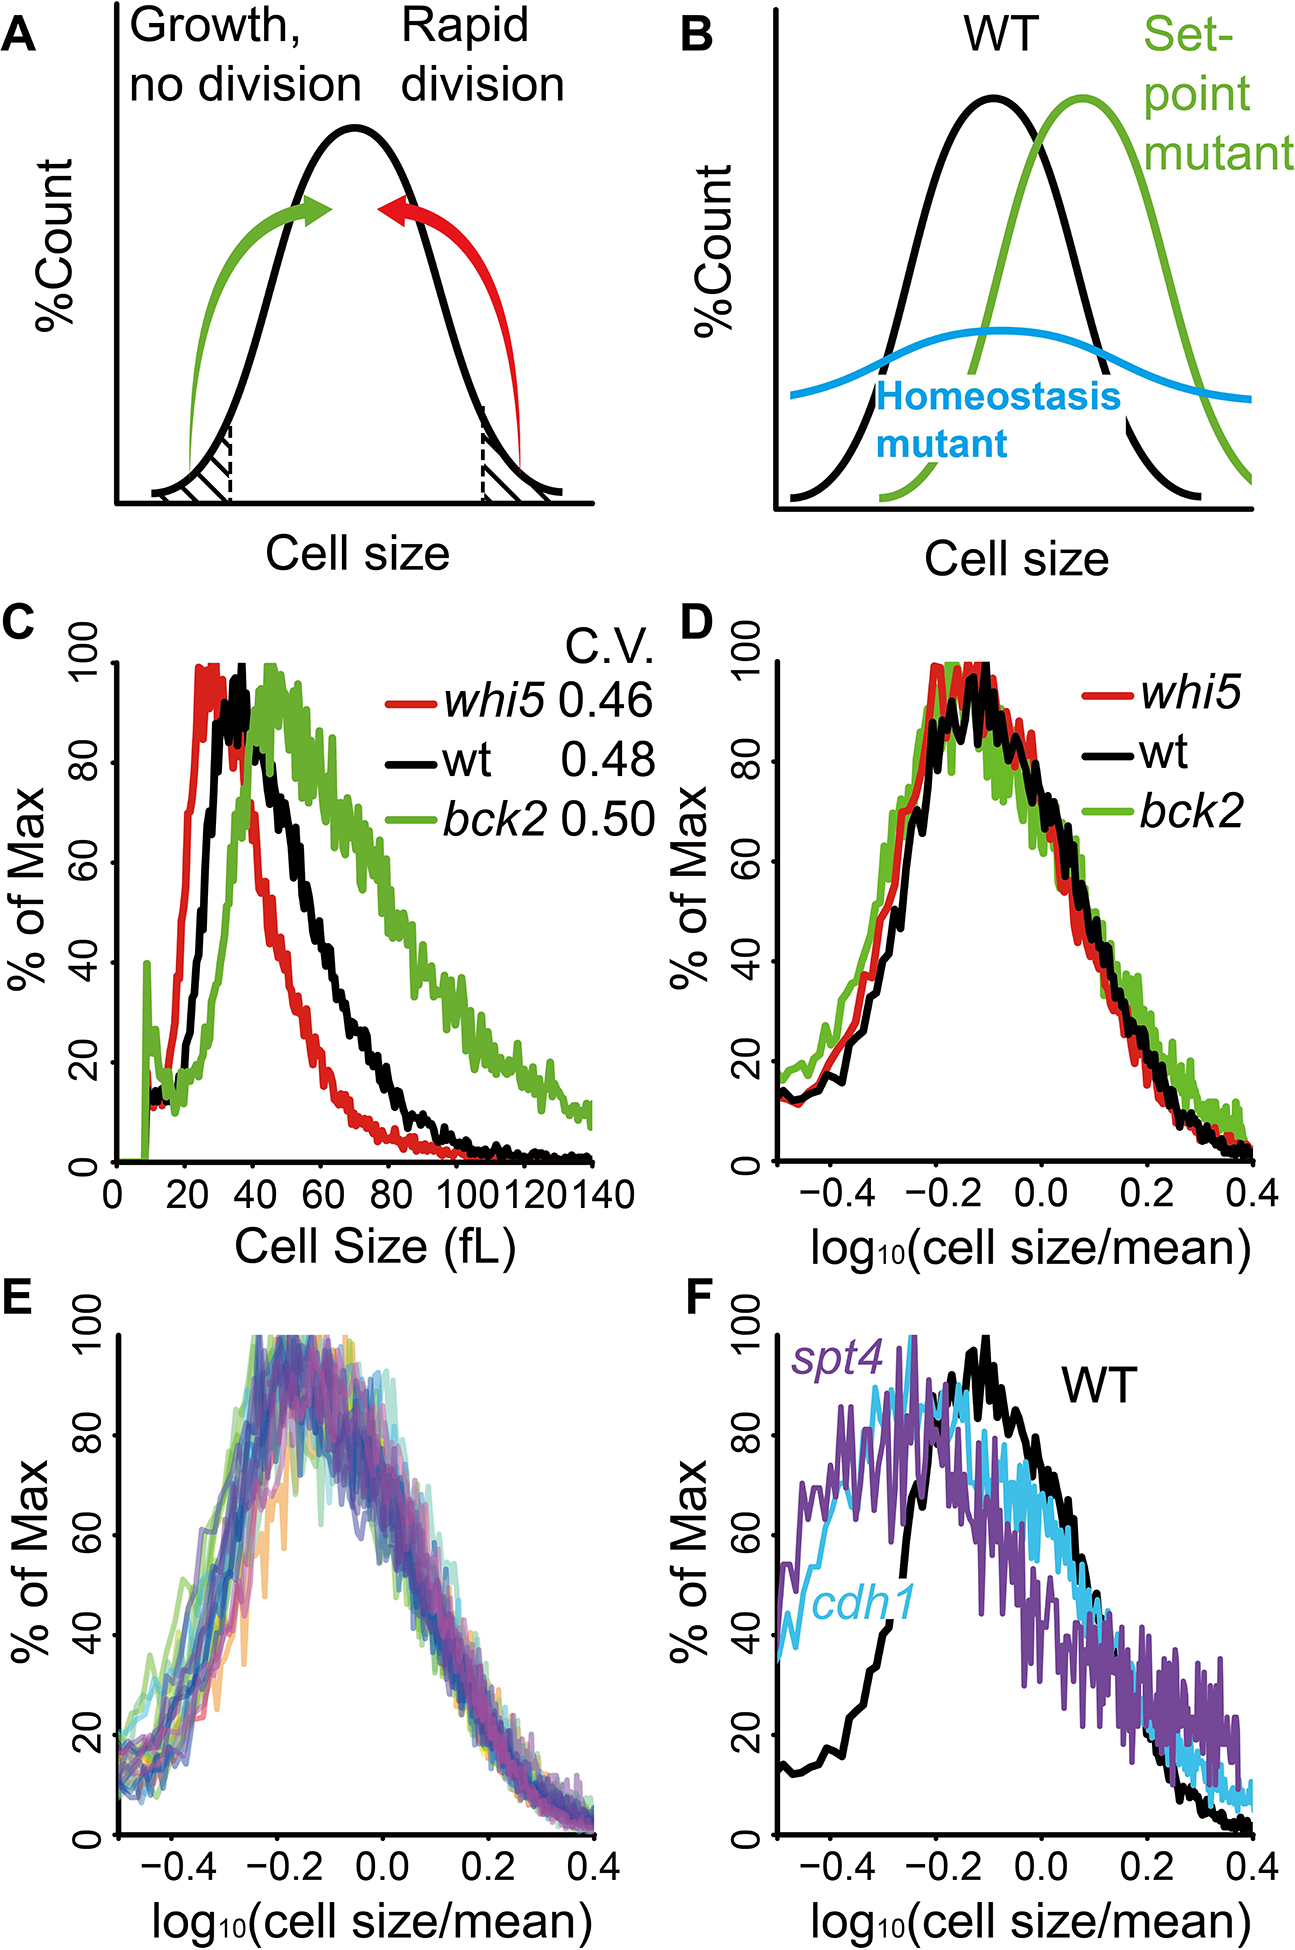
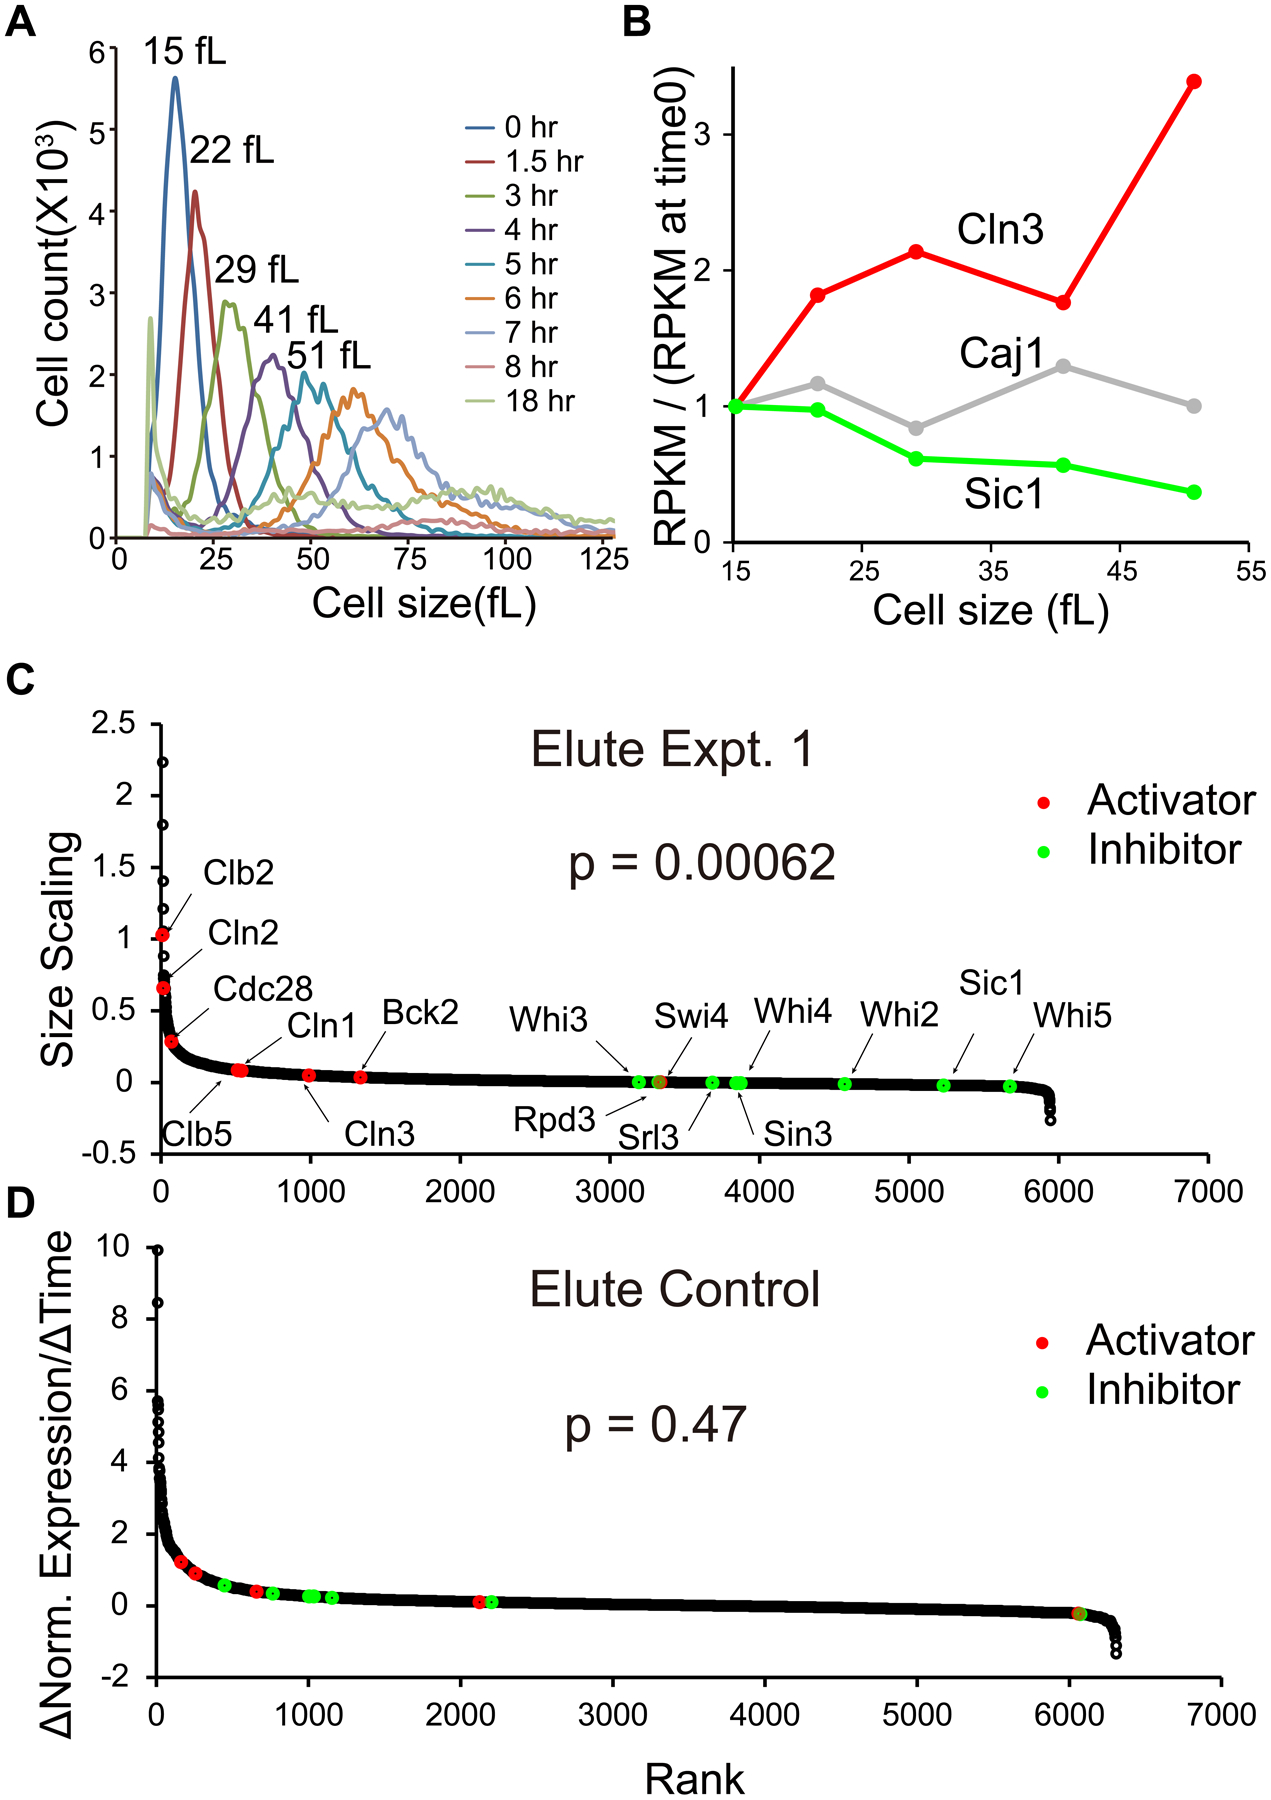
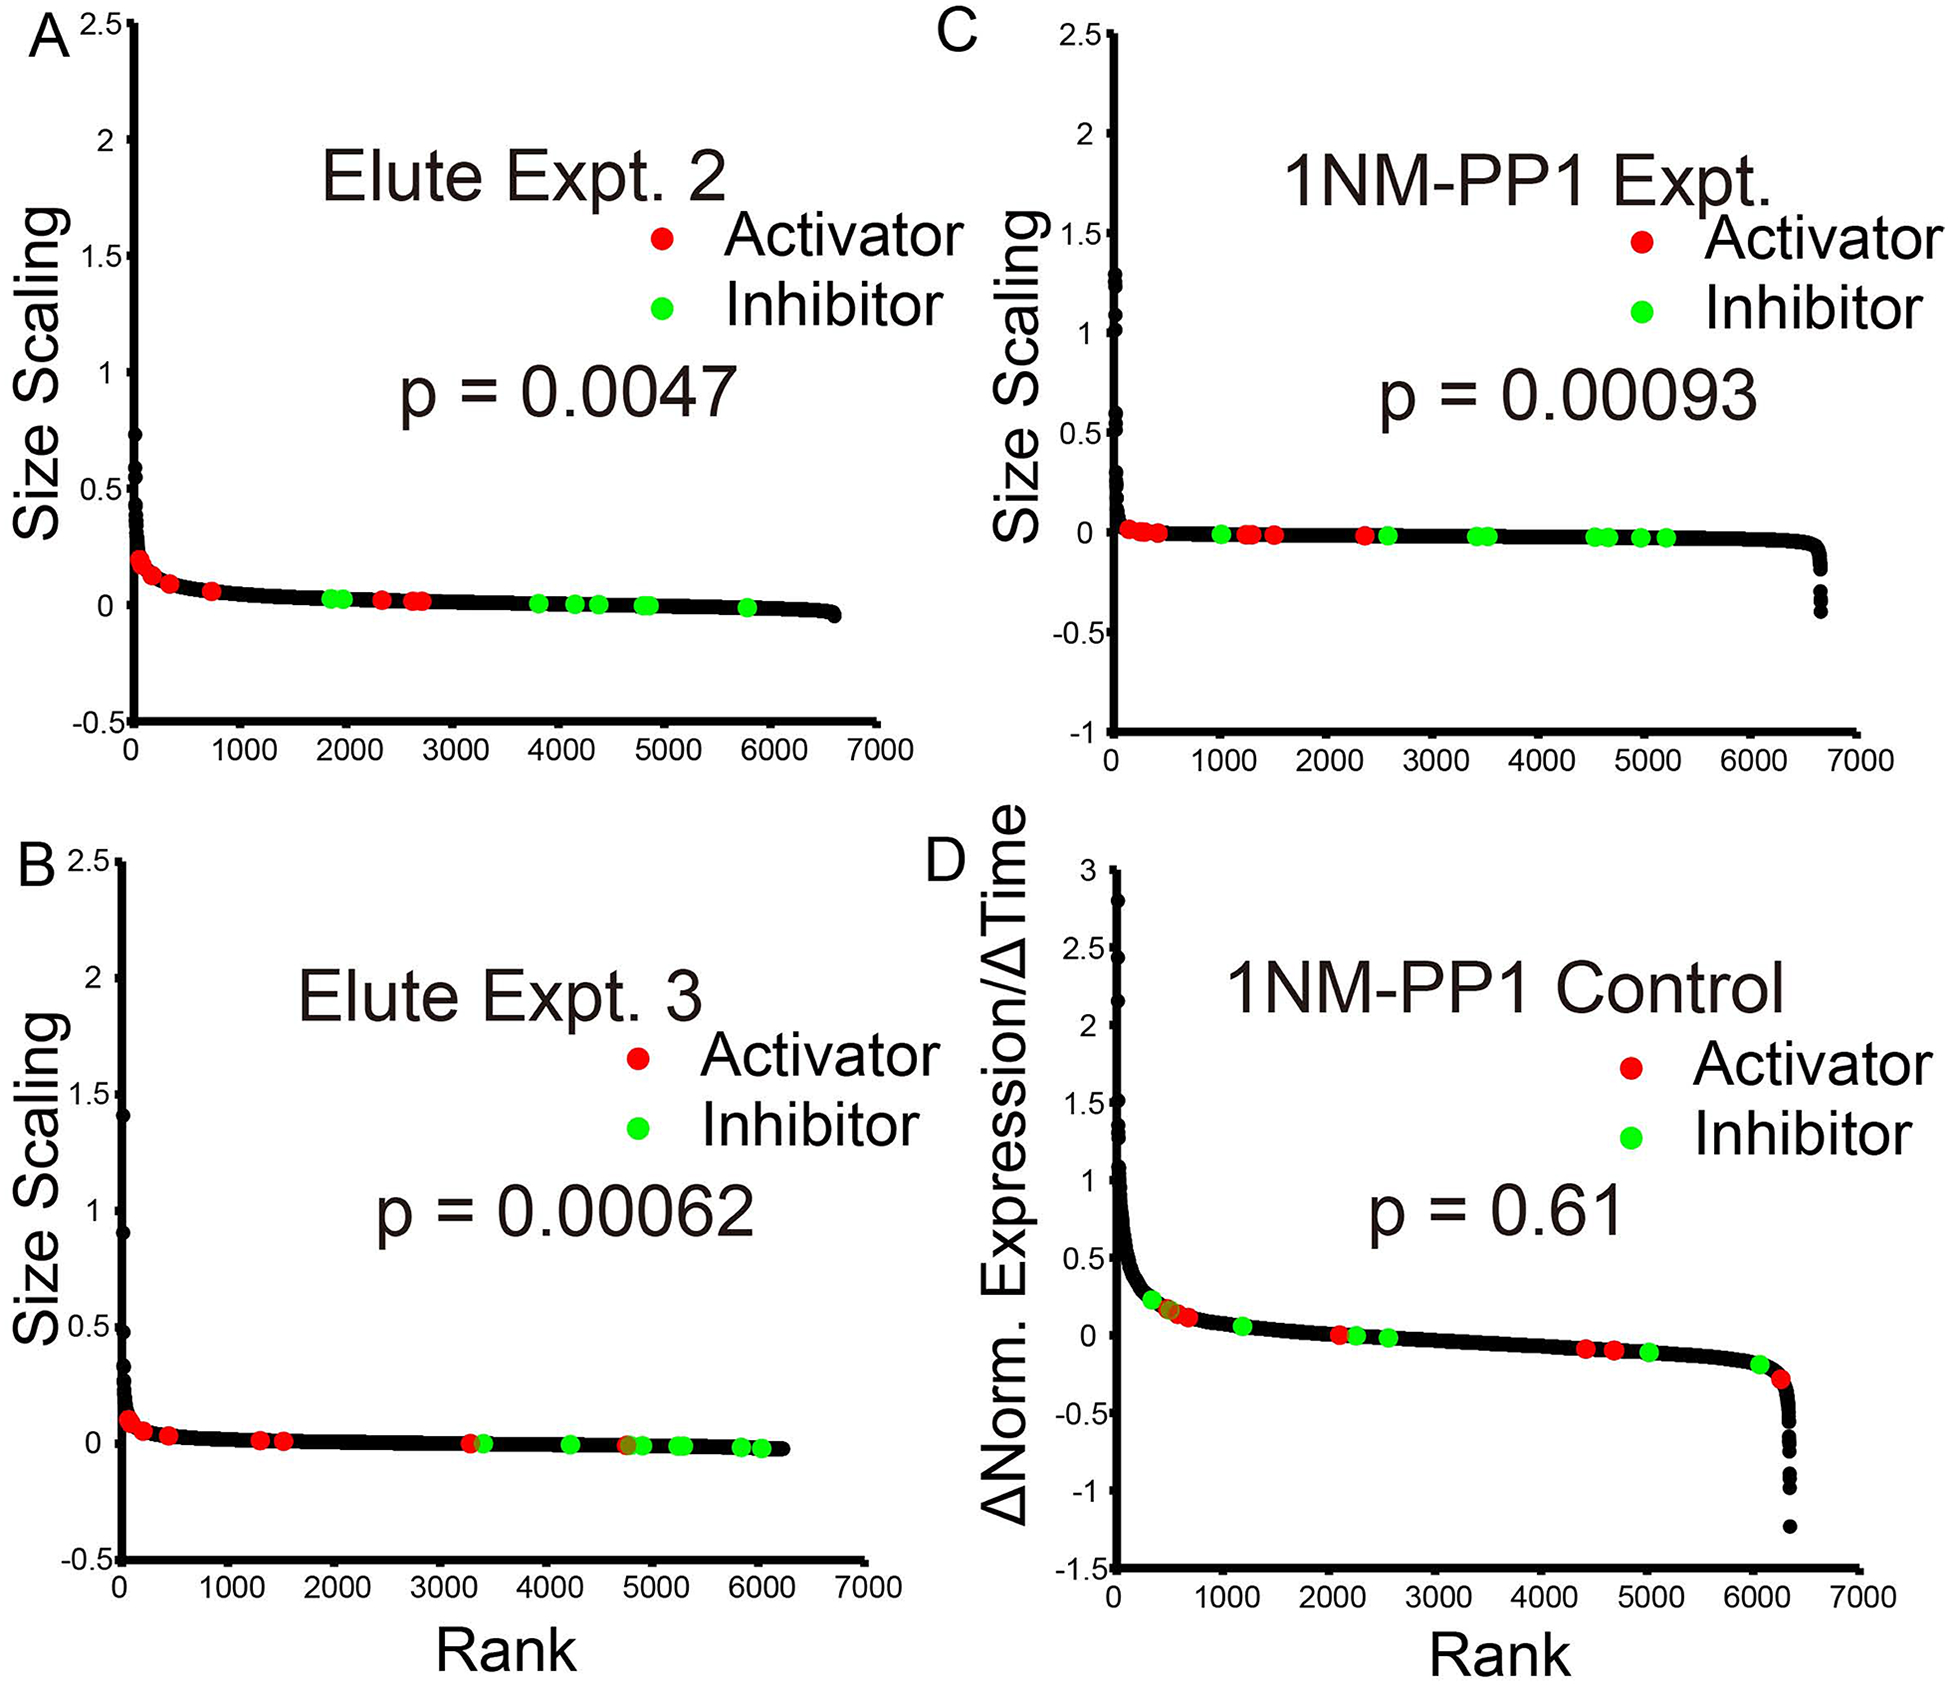
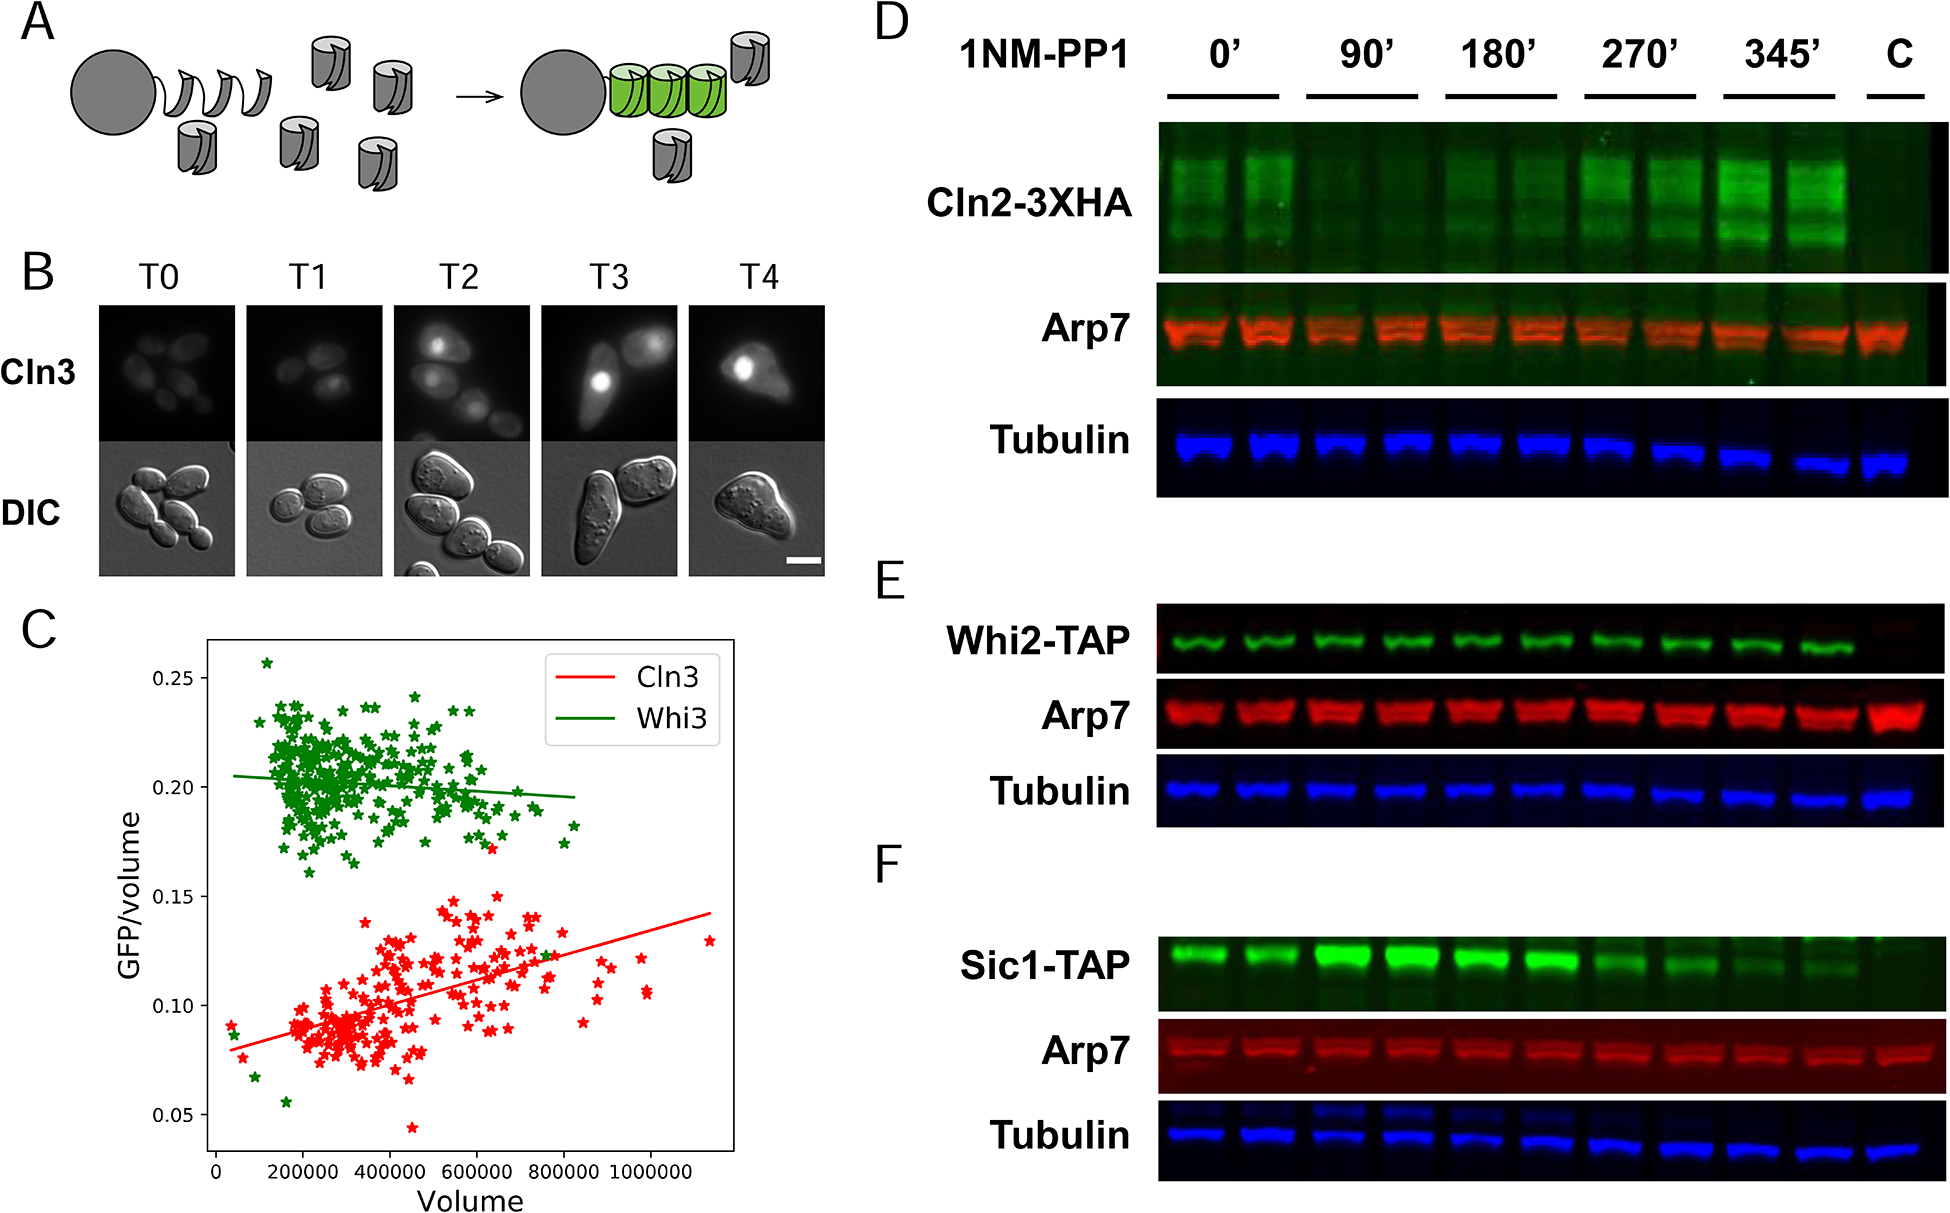
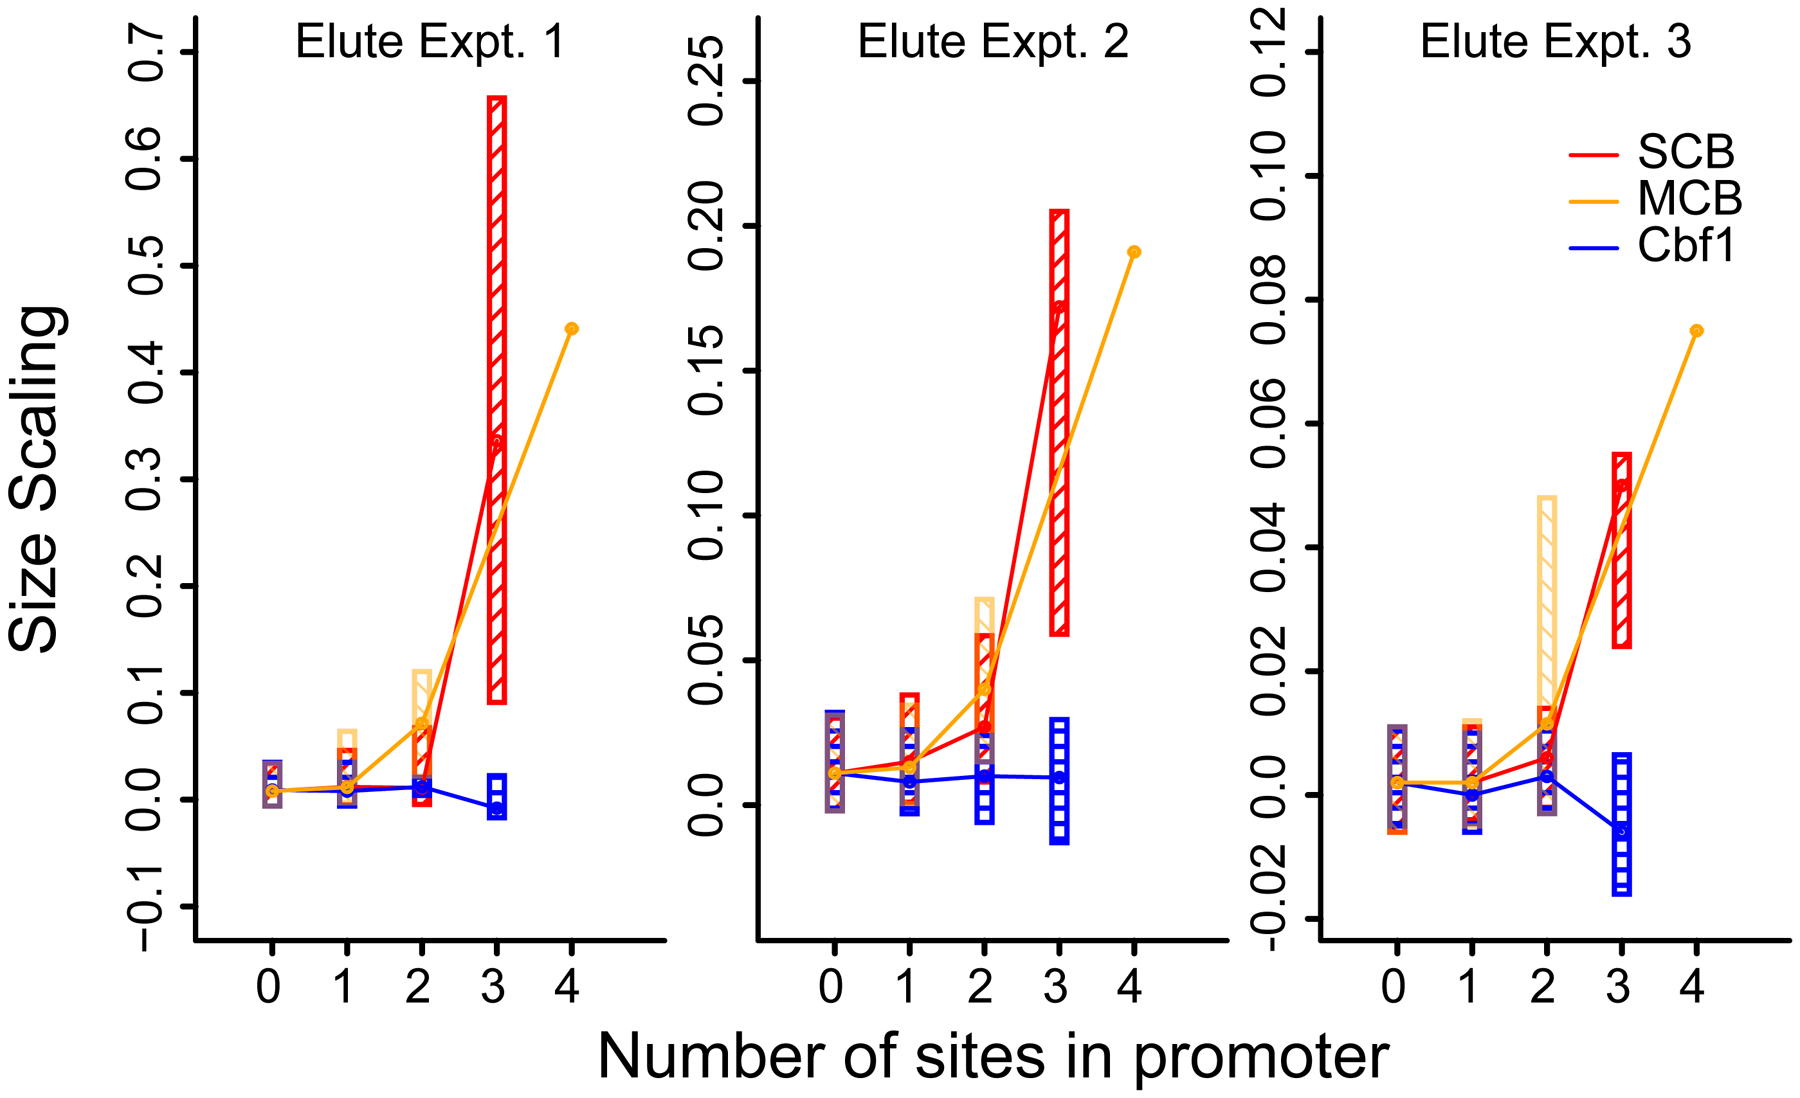
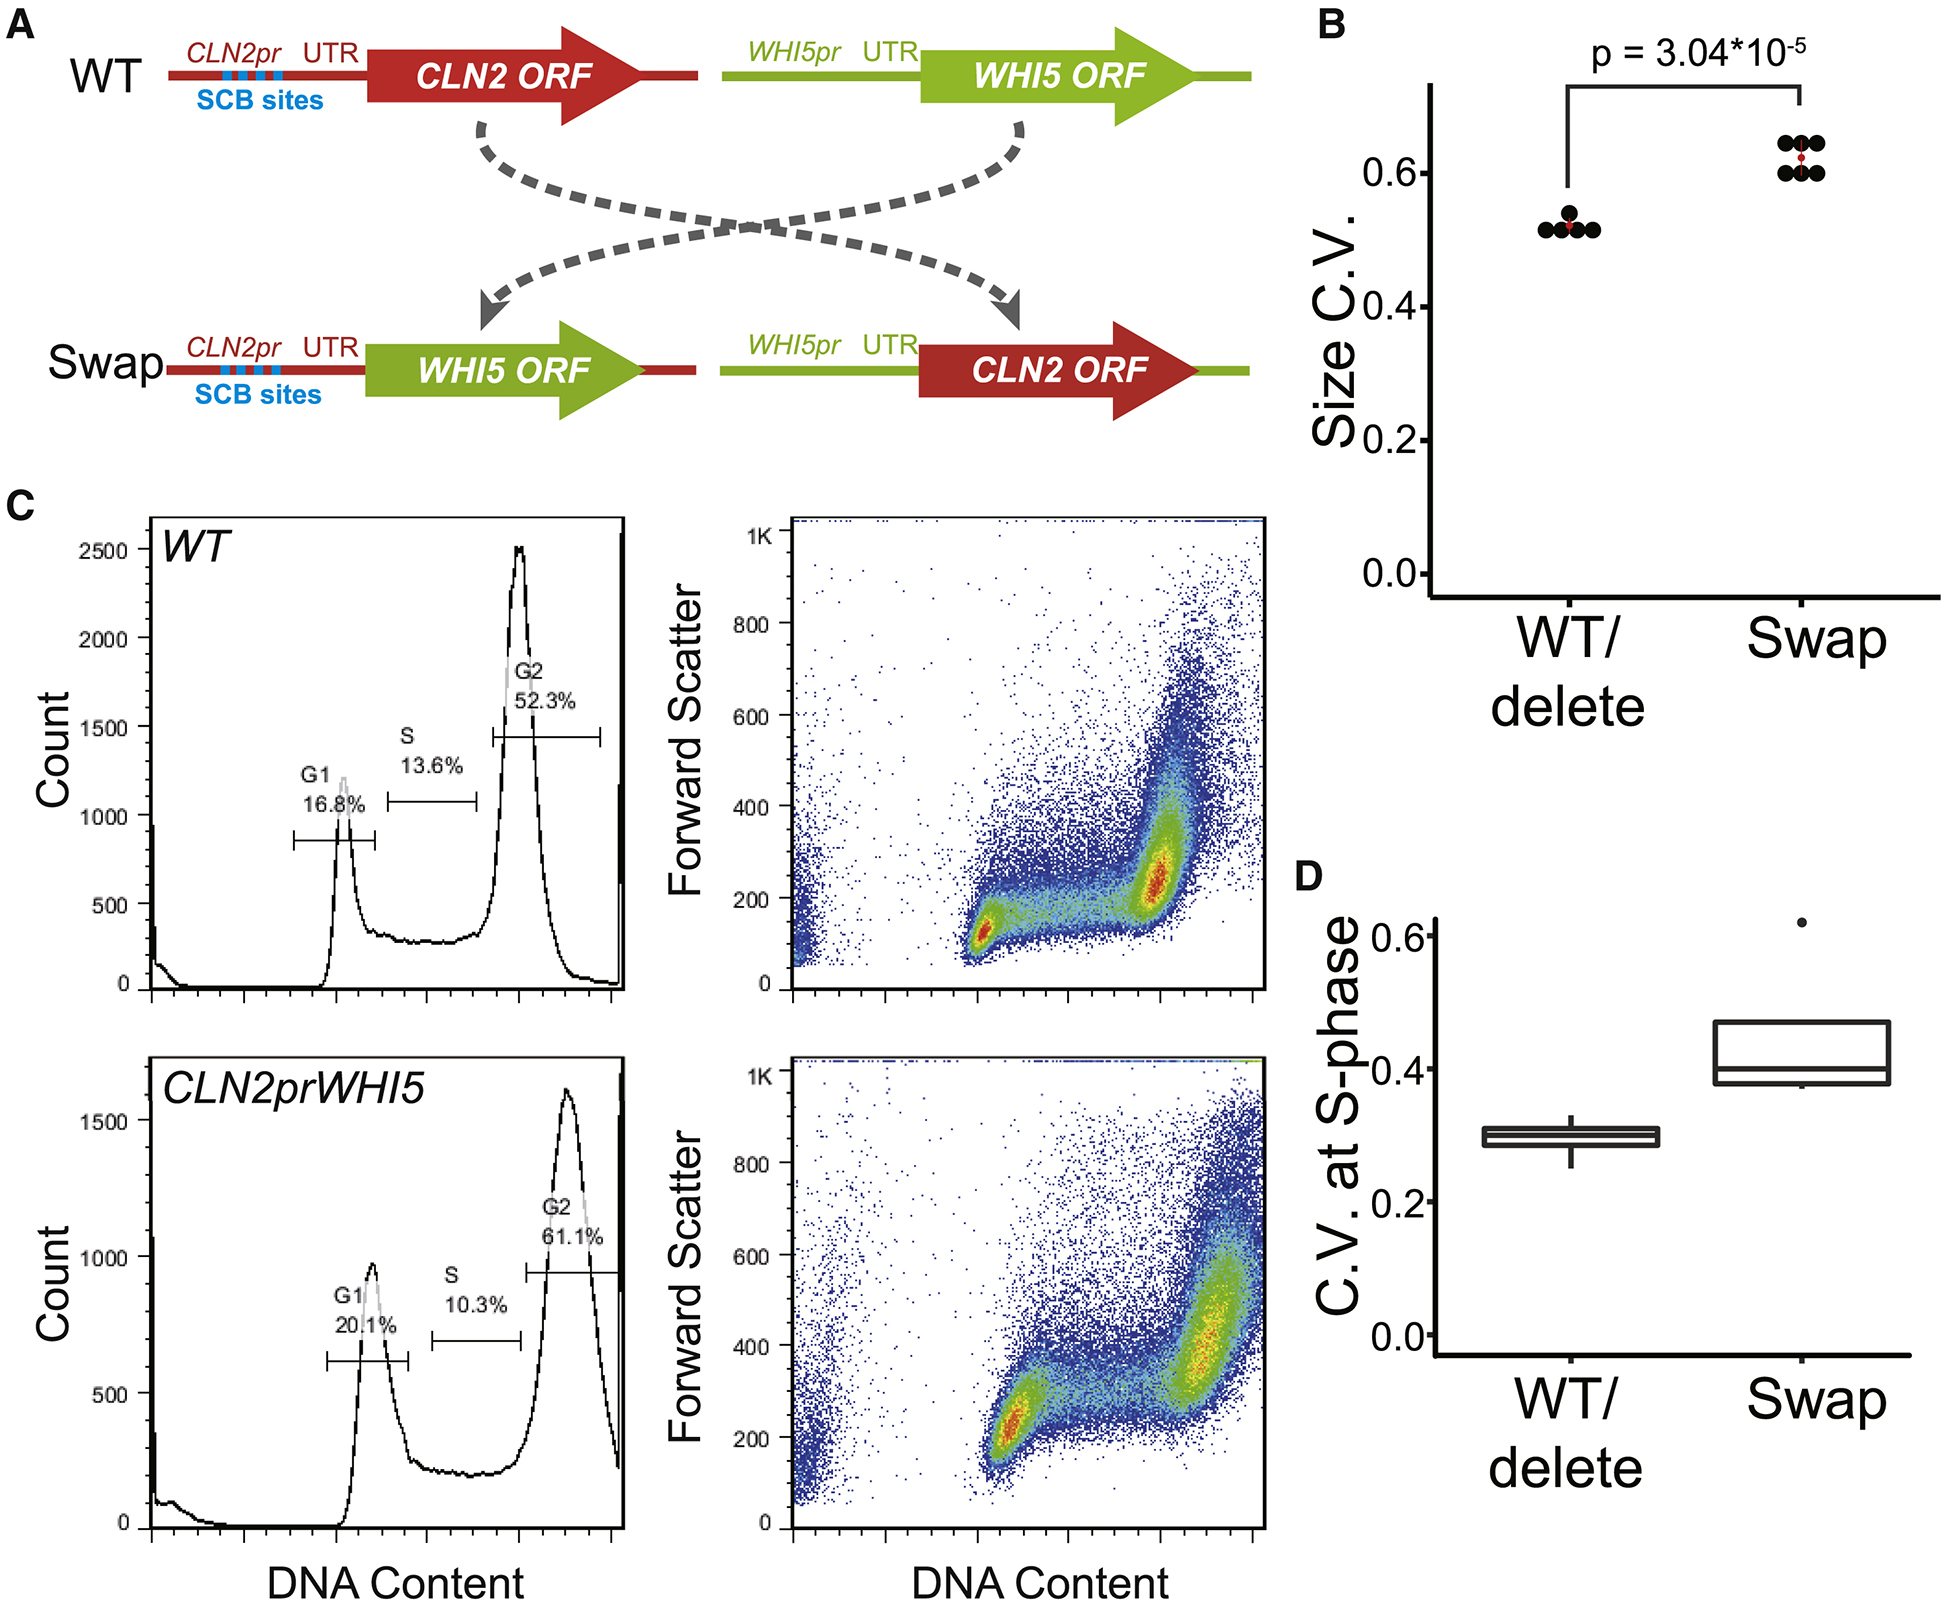
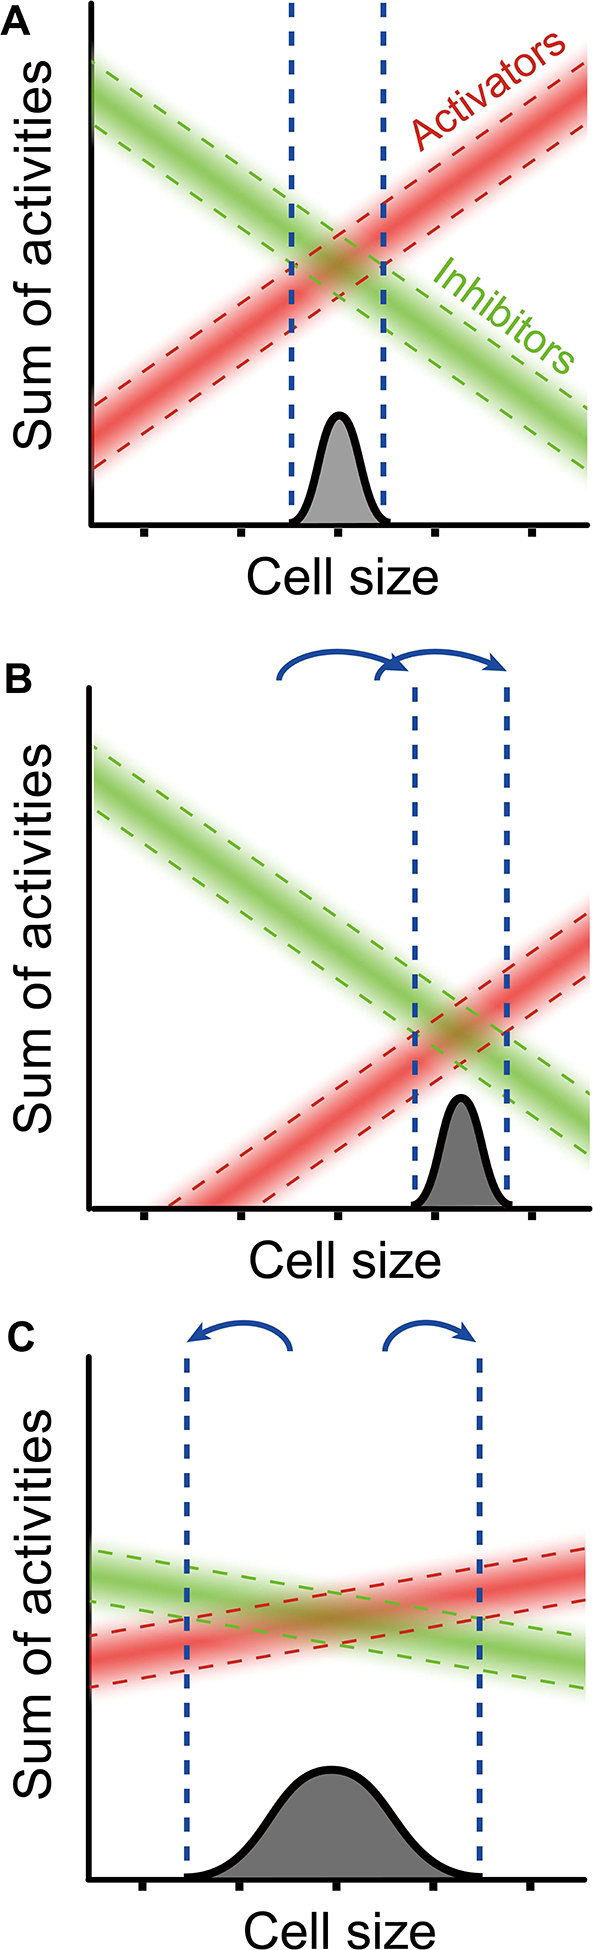
Yeast cells must grow to a critical size before committing to division. It is unknown how size is measured. We find that as cells grow, mRNAs for some cell-cycle activators scale faster than size, increasing in concentration, while mRNAs for some inhibitors scale slower than size, decreasing in concentration. Size-scaled gene expression could cause an increasing ratio of activators to inhibitors with size, triggering cell-cycle entry. Consistent with this, expression of the CLN2 activator from the promoter of the WHI5 inhibitor, or vice versa, interfered with cell size homeostasis, yielding a broader distribution of cell sizes. We suggest that size homeostasis comes from differential scaling of gene expression with size. Differential regulation of gene expression as a function of cell size could affect many cellular processes.

Keywords: Cln3; cell cycle; cell cycle control; cell cycle regulation; cell size control; growth Whi5; growth control of division; size homeostasis; start; yeast cell cycle.


Conflict of interest statement

Declaration of Interests The authors declare no competing interests.

Figures

Fig. 1
Fig. 1. Cell size mutants of S. cerevisiae have no homeostasis defect.
A. Size control. Small cells grow in size to become bigger; large cells divide to become smaller. B. “Set-point” mutant with shifted mean but WT breadth (green); “homeostasis” mutant with WT mean but wide breadth (blue). C. Cell size distributions and CVs of whi5 (red), bck2 (green) and wild type (black). Similar results were obtained with two biological replicates. D. Cell size distributions from C, displayed as mean-subtracted Box-Cox transformations. E. Cell size distribution overlay of mean-subtracted Box-Cox transformations of WT and 30 mutants (Materials and Methods). In most cases, there were not biological replicates. F. Mean-subtracted Box-Cox transformations of WT, spt4Δ, cdh1Δ. See also Fig. S1.
Fig. 2
Fig. 2. Scaling of expression of cell cycle activators and inhibitors with cell size.
A. Cell size distributions in elutriation expt. 1. B. For example genes, concentrations of mRNA at sizes of 15, 22, 29, 41, and 51 fL are compared to initial (15 fL) concentration of mRNA. mRNAs were measured as RPKM (Reads Per Kilobase per Million mapped reads), and the ratio of RPKM(sample 0 to 4)/RPKM(sample 0) (“concentration”) for each gene is plotted against cell size. Best-fit linear regression lines and slopes were calculated. C. For each mRNA, a best-fit line and slope was calculated for [RPKM(sample 0 to 4)/RPKM(sample 0)], as in B. We call these slopes “size scaling values”. Each gene is plotted as a dot, ranked left to right by size scaling value. A large size scaling value (i.e., large positive slope) means the mRNA scales faster-than-size, i.e., increases in concentration as the cell grows. Pre-selected cell cycle activators are colored red, and inhibitors green. The Wilcoxon p-value was calculated for a rank difference between activators and inhibitors. The experiment was done three times with similar results (see Fig. 3). D. Elutriation control. CDC28 cells were held in the elutriation chamber during centrifugation, then flushed out without size separation. 1NMPP1 inhibitor was added, but these cells were not sensitive to the inhibitor. Samples were taken processed and analyzed as in panel C. See also Fig. S2, S3, S4, Table S1, S2, S3, S4.
Fig. 3
Fig. 3. Size scaling is repeatable.
A. Elutriation expt. 2. Repeat of Elutriation experiment 1. B. Elutriation expt. 3. Repeat of Elutriation experiment 1. C. Alternative size-scaling experiment. cdc28-as cells were treated with 1NMPP1 to block cell cycle progress without additional manipulations. Samples were taken with time, characterized for cell size and cell cycle distribution, processed for RNA-Seq, and analyzed as in Fig. 2C (Materials and Methods). D. Control. As panel 3C, but using WT CDC28 cells (not sensitive to 1NMPP1). The Wilcoxon p-values for separation of activators and inhibitors are shown.
Fig 4.
Fig 4.. Size Scaling at the Protein Level.
A. The split-GFP system. B. Timecourse of GFP-Cln3 fluorescence after addition of 1NMPP1 (scalebar = 5 microns). C. Quantitation of GFP-Cln3 and Whi3-GFP concentration as function of volume in unbudded cells in timecourse after arrest by 1NMPP1. Volume (arbitrary units) estimated from cross-sectional area of cells. D, E, F. Western analysis of Cln2, Whi2, and Sic1 abundance after arrest by 1NMPP1. Samples (equal total protein) loaded in duplicate (technical replicate). Lane “C” is an untagged control. Arp7 and tubulin are controls. See also Fig. S5.
Fig. 5.
Fig. 5.. Size-scaling increases non-linearly with number of binding sites for SBF or MBF transcription factors.
Transcripts were grouped by the number of transcription factor consensus sites in the promoter (x-axis). Promoters are defined as 300bp upstream of transcription start sites, defined as in Xu et al. (2009). SCB (grey) = “CACGAAA” or “CGCGAAA”. MCB (black) = “ACGCGT”. SCB sites were counted on both strands. MCB sites (palindromic) counted on one strand. The plotted boxes include the second and third quartiles of size scaling values. Lines connect medians. Only one gene contains 4 MCB sites. Results for a control factor, Cbf1 (CACGTG), are also shown.
Fig. 6.
Fig. 6.. Swapping ORFs between an activator and inhibitor confuses the sizer.
A. Loci in the “swap” experiments. B. Size distributions of growing cells were measured using a Coulter Channelizer. CVs of two wild-type strains, and one strain each of cln2, whi5, and cln2 whi5 were aggregated as “WT/delete”. Two whi5 cln2::CLN2pr-WHI5 strains, and one strain each of cln2 whi5::WHI5pr-CLN2, cln2::CLN2pr-WHI5 whi5::WHI5pr-CLN2, cln2::CLN2pr-WHI5, and whi5::WHI5pr-CLN2 were aggregated as “Swap”. C. Representative flow cytometer plots of WT and CLN2pr-WHI5. Left shows gating. Right shows size vs Sytox Green. D. CVs of gated S-phase cells. WT, cln2, whi5, cln3, cln2 whi5 were aggregated as “WT/delete”; cln2::CLN2prWHI5 whi5::WHI5prCLN2, cln2::CLN2prWHI5, and cln2::CLN2prWHI5 whi5 were aggregated as “Swap”. See also Table S5.
Fig. 7
Fig. 7. Model of Cell Size control.
A. Wild-type. Activators (red) increase in concentration with cell size, while inhibitors (green) decrease. Start occurs when activators predominate over inhibitors. Variation in expression of activators/inhibitors causes a range of sizes for Start. B. cln3 null mutant. Total activator activity decreases in cln3 cells, but it is assumed that the average slope of remaining activators does not change significantly. Critical size becomes larger, but no more variable. C. Size control where the slopes for size-scaling are shallow. With shallow slopes, variation leads to Start at a wider range of sizes. Critical size remains wild-type, but variability increases. Slopes would change if the mechanism linking gene expression to size changed.

References

    1. Adames NR, Schuck PL, Chen KC, Murali TM, Tyson JJ, and Peccoud J (2015). Experimental testing of a new integrated model of the budding yeast Start transition. Mol Biol Cell 26, 3966–3984. - PMC - PubMed
    1. Bean JM, Siggia ED, and Cross FR (2006). Coherence and timing of cell cycle start examined at single-cell resolution. Mol Cell 21, 3–14. - PubMed
    1. Bhattacherjee A, and Levy Y (2014). Search by proteins for their DNA target site: 1. The effect of DNA conformation on protein sliding. Nucleic Acids Res 42, 12404–12414. - PMC - PubMed
    1. Bishop AC, Ubersax JA, Petsch DT, Matheos DP, Gray NS, Blethrow J, Shimizu E, Tsien JZ, Schultz PG, Rose MD, et al. (2000). A chemical switch for inhibitor-sensitive alleles of any protein kinase. Nature 407, 395–401. - PubMed
    1. Blainey PC, Luo G, Kou SC, Mangel WF, Verdine GL, Bagchi B, and Xie XS (2009). Nonspecifically bound proteins spin while diffusing along DNA. Nat Struct Mol Biol 16, 1224–1229. - PMC - PubMed

Publication types

MeSH terms