

Associations of air pollution with obesity and body fat percentage, and modification by polygenic risk score for BMI in the UK Biobank
- PMID: 32247148
- PMCID: PMC7199644
- DOI: 10.1016/j.envres.2020.109364
Associations of air pollution with obesity and body fat percentage, and modification by polygenic risk score for BMI in the UK Biobank
Abstract
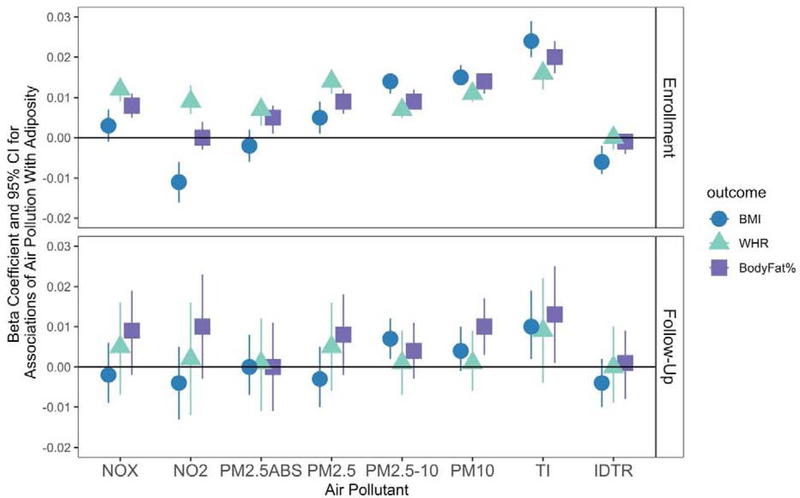
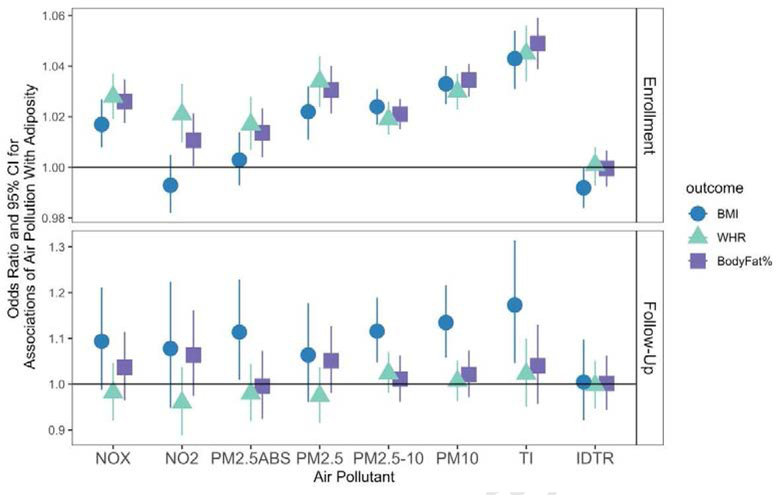
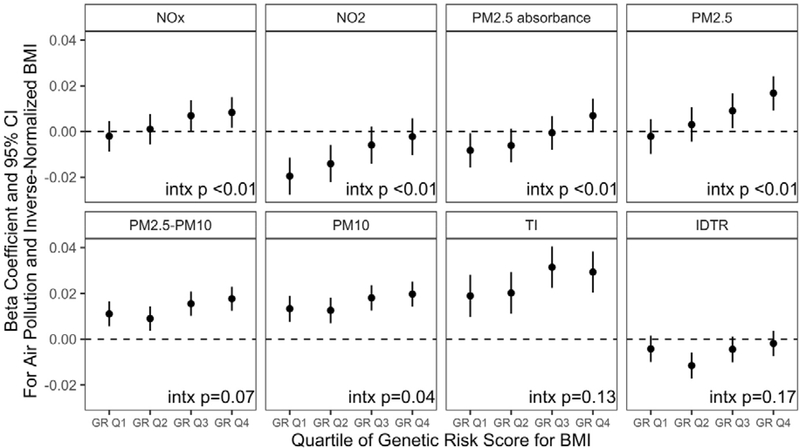
Air pollution has consistently been associated with cardiometabolic outcomes, although associations with obesity have only been recently reported. Studies of air pollution and adiposity have mostly relied on body mass index (BMI) rather than body fat percentage (BF%), and most have not accounted for noise as a possible confounder. Additionally, it is unknown whether genetic predisposition for obesity increases susceptibility to the obesogenic effects of air pollution. To help fill these gaps, we used the UK Biobank, a large, prospective cohort study in the United Kingdom, to explore the relationship between air pollution and adiposity, and modification by a polygenic risk score for BMI. We used 2010 annual averages of air pollution estimates from land use regression (NO2, NOX, PM2.5, PM2.5absorbance, PM2.5-10, PM10), traffic intensity (TI), inverse distance to road (IDTR), along with examiner-measured BMI, waist-hip-ratio (WHR), and impedance measures of BF%, which were collected at enrollment (2006-2010, n = 473,026) and at follow-up (2012-2013, n = 19,518). We estimated associations of air pollution with BMI, WHR, and BF% at enrollment and follow-up, and with obesity, abdominal obesity, and BF%-obesity at enrollment and follow-up. We used linear and logistic regression and controlled for noise and other covariates. We also assessed interactions of air pollution with a polygenic risk score for BMI. On average, participants at enrollment were 56 years of age, 54% were female, and 32% had completed college or a higher degree. Almost all participants (~95%) were white. All air pollution measures except IDTR were positively associated with at least one continuous measure of adiposity at enrollment. However, NO2 was negatively associated with BMI but positively associated with WHR at enrollment, and IDTR was also negatively associated with BMI. At follow-up (controlling for enrollment adiposity), we observed positive associations for PM2.5-10 with BMI, PM10 with BF%, and TI with BF% and BMI. Associations were similar for binary measures of adiposity, with minor differences for some pollutants. Associations of NOX, NO2, PM2.5absorbance, PM2.5 and PM10, with BMI at enrollment, but not at follow-up, were stronger among individuals with higher BMI polygenic risk scores (interaction p <0.05). In this large, prospective cohort, air pollution was associated with several measures of adiposity at enrollment and follow-up, and associations with adiposity at enrollment were modified by a polygenic risk score for obesity.
Keywords: Air pollution; BMI; Epidemiology; Gene by environment interactions; Obesity.
Copyright © 2020 Elsevier Inc. All rights reserved.
Conflict of interest statement
Declaration of competing interest The authors have no conflicts of interest to declare.
Figures
Similar articles
-
Risk analysis of air pollutants and types of anemia: a UK Biobank prospective cohort study.Int J Biometeorol. 2024 Jul;68(7):1343-1356. doi: 10.1007/s00484-024-02670-0. Epub 2024 Apr 12. Int J Biometeorol. 2024. PMID: 38607561
-
Air Pollution, Genetic Factors, and the Risk of Lung Cancer: A Prospective Study in the UK Biobank.Am J Respir Crit Care Med. 2021 Oct 1;204(7):817-825. doi: 10.1164/rccm.202011-4063OC. Am J Respir Crit Care Med. 2021. PMID: 34252012
-
Effects of long-term exposure to traffic-related air pollution on respiratory and cardiovascular mortality in the Netherlands: the NLCS-AIR study.Res Rep Health Eff Inst. 2009 Mar;(139):5-71; discussion 73-89. Res Rep Health Eff Inst. 2009. PMID: 19554969
-
Ambient air pollution, healthy diet and vegetable intakes, and mortality: a prospective UK Biobank study.Int J Epidemiol. 2022 Aug 10;51(4):1243-1253. doi: 10.1093/ije/dyac022. Int J Epidemiol. 2022. PMID: 35179602 Free PMC article.
-
Air pollutants, genetic susceptibility, and incident schizophrenia in later life: A prospective study in the UK Biobank.Sci Total Environ. 2024 Jul 15;934:173009. doi: 10.1016/j.scitotenv.2024.173009. Epub 2024 May 10. Sci Total Environ. 2024. PMID: 38734111
Cited by
-
Bidirectional associations between adiposity and mental health: a prospective cohort study of the UK Biobank.Obesity (Silver Spring). 2025 Jun;33(6):1195-1206. doi: 10.1002/oby.24296. Epub 2025 May 1. Obesity (Silver Spring). 2025. PMID: 40313011 Free PMC article.
-
The association between outdoor air pollution and body mass index, central obesity, and visceral adiposity index among middle-aged and elderly adults: a nationwide study in China.Front Endocrinol (Lausanne). 2023 Oct 9;14:1221325. doi: 10.3389/fendo.2023.1221325. eCollection 2023. Front Endocrinol (Lausanne). 2023. PMID: 37876545 Free PMC article.
-
Higher Particulate Matter Deposition in Alveolar Region Could Accelerate Body Fat Accumulation in Obstructive Sleep Apnea.ACS Environ Au. 2022 Sep 23;3(1):12-17. doi: 10.1021/acsenvironau.2c00034. eCollection 2023 Jan 18. ACS Environ Au. 2022. PMID: 37101840 Free PMC article.
-
Risk/benefit tradeoff of habitual physical activity and air pollution on chronic pulmonary obstructive disease: findings from a large prospective cohort study.BMC Med. 2022 Feb 28;20(1):70. doi: 10.1186/s12916-022-02274-8. BMC Med. 2022. PMID: 35220974 Free PMC article.
-
The association between long-term outdoor air pollution exposure and Chinese visceral adiposity index: A nationwide study of middle-aged and older adults.PLoS One. 2025 Jul 17;20(7):e0325524. doi: 10.1371/journal.pone.0325524. eCollection 2025. PLoS One. 2025. PMID: 40674294 Free PMC article.
References
-
- Barrett-Connor E and Khaw K-T (1989). “Cigarette smoking and increased central adiposity.” Annals of internal medicine 111(10): 783–787. - PubMed
-
- Beelen R, Hoek G, Vienneau D, Eeftens M, Dimakopoulou K, Pedeli X, Tsai M-Y, Künzli N, Schikowski T and Marcon A (2013). “Development of NO 2 and NO x land use regression models for estimating air pollution exposure in 36 study areas in Europe–the ESCAPE project.” Atmospheric Environment 72: 10–23.
-
- Bloemsma LD, Wijga AH, Klompmaker JO, Janssen NA, Smit HA, Koppelman GH, Brunekreef B, Lebret E, Hoek G and Gehring U (2019). “The associations of air pollution, traffic noise and green space with overweight throughout childhood: The PIAMA birth cohort study.” Environmental research 169: 348–356. - PubMed
Publication types
MeSH terms
Substances
Grants and funding
LinkOut - more resources
Full Text Sources
Medical
Miscellaneous
