. 2020 Jul;134(4):1361-1373.
doi: 10.1007/s00414-020-02278-0. Epub 2020 Apr 5.

A field study to evaluate PMI estimation methods for advanced decomposition stages

Affiliations

A field study to evaluate PMI estimation methods for advanced decomposition stages

Stefan Pittner et al. Int J Legal Med. 2020 Jul.

Abstract

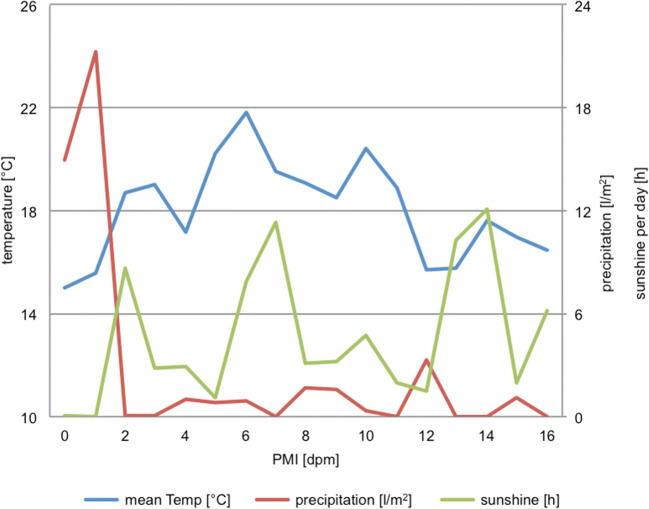
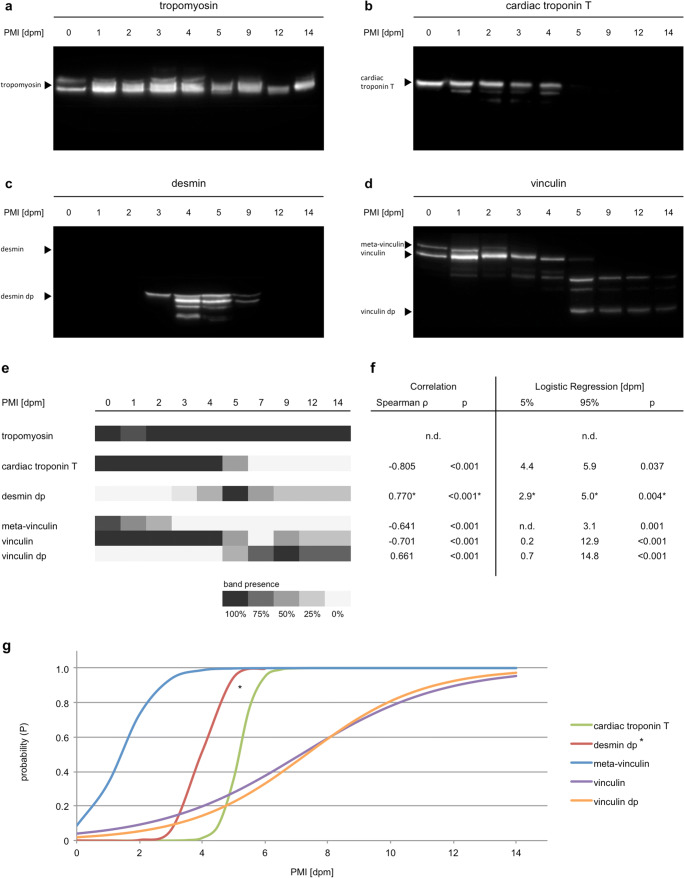
Estimating the postmortem interval (PMI) is one of the major tasks and a continuous challenge in forensic pathology. It is often an exclusion process of available methods, which ultimately can lead to an unsatisfactory outcome due to poor reliability. This problem is most acute in the late PMI, when decomposition proceeds and some methods (such as rigor, livor, and algor mortis) are no longer applicable. Several methods, such as forensic entomology, skeletal muscle protein degradation, and the study of body decomposition by application of a morphological scoring, are expected to provide further information; however, all have certain limitations and weaknesses. Availability of a tool-box of methods allows a case-specific selection of the most appropriate one(s), or eventually provides improvements in the overall accuracy and precision of the PMI estimation by merging and combining methods. To investigate practical (field) application, eventual interferences, and/or synergetic effects, as well as the robustness of these methods towards specific influencing factors, a field study was conducted, using eight pig cadavers of different body weights and physical coverage, left to decompose under natural conditions for 16 days. Morphological changes during decomposition were assessed using the total body score (TBS), muscle samples were collected to analyze protein degradation, and insect colonization was evaluated. The results reveal strengths and current limitations of all tested methods, as well as promising synergistic effects, and thus, provide a baseline for targeted future research.

Keywords: Entomology; Field study; Morphology; PMI estimation; Protein degradation; Total body score.


Conflict of interest statement

The authors declare that they have no conflict of interest.

Figures

Fig. 1
Fig. 1
Experimental setup. a Eight pigs were randomly allocated to four treatment groups. Top left: open glade naked; top right: open glade clothed; bottom left: in the shadow of large trees; bottom right: covered with branches and twigs. b Over the course of 16 days postmortem (dpm), environmental conditions were monitored, morphology was assessed by a total body score (TBS), entomology samples were collected and analyzed, and skeletal muscle samples were taken and investigated for protein decomposition. Icons indicate (from top to bottom) measurement of environmental conditions; morphology assessment; entomology assessment; and sampling of muscle tissue. “x” indicates a sampling/observation day, circled “x” indicates the sampling of insect larvae on the “days of discovery,” “x*” indicates sampling with reduced sample size (n = 4) due to loss of tissue
Fig. 2
Fig. 2
Weather conditions during the experimental time period. Daily mean temperatures, total precipitation, and hours of sunshine per day are plotted
Fig. 3
Fig. 3
a Progression of morphological changes during the decomposition of a pig. Top left: “fresh” day 0, TBS 3; top right: “bloating” day 4, TBS 9; bottom left: “advanced decomposition” day 10, TBS 27; bottom right: “skeletonization” day 16, TBS 32. b Development of TBS scores during the course of 16 days postmortem (dpm). Central solid line indicates the mean TBS; orange area represents the mean ± SD, red area the minimum and maximum TBS at each investigated time point
Fig. 4
Fig. 4
a Number of individuals per family caught on the “days of discovery.” bd Species diversity within the three major families. Bars indicate the percentage of the total catch per family on a logarithmic scale. In total, 4557 animals of 29 different species were counted. eh Adult stages of the four most abundant species found on the pig cadavers: Sarcophaga variegata (e), Lucilia caesar (f), Hydrotaea aenescens (g), Necrodes littoralis (h)
Fig. 5
Fig. 5
Scheme for obtained tissue samples. “x” marks a sample; “o” marks when no muscle sample was obtainable anymore. No sampling was possible from one clothed (18 kg) and one naked pig (57 kg) from day 9 onwards. On day 14, only one animal from each of the four setups (n = 4 in total) provided a sufficient tissue sample. Icons indicate (from top to bottom) open glade naked; open glade clothed; in the shadow of large trees; and covered with branches and twigs
Fig. 6
Fig. 6
Results of the analysis of muscle protein degradation. ad Representative Western blots of skeletal muscle samples throughout the investigated time period of 14 days. e Heatmap, depicting the abundance of protein bands (native bands and degradation products (dp)) within all samples. Cardiac troponin T, meta-vinculin, and vinculin depicted a decrease, and vinculin dp an increase of band presence over time. Desmin dp depicted a transient increase until day 5 (100% presence) and a subsequent decrease of abundance. fg Statistic analysis of the correlation of protein decomposition with PMI. While some of the changes (loss of native meta-vinculin and cardiac troponin T, as well as the appearance of desmin dp) occur in narrow time frames and short PMIs, others (loss of native vinculin and occurrence of vinculin dp) stretch over an extended time period barely, or not even reach significance levels (95%) within the investigated time period. *Desmin dp statistics were calculated until day 5. The transient character of this degradation product has to be specifically considered

References

    1. Henssge C, Madea B. Estimation of the time since death in the early post-mortem period. Forensic Sci Int. 2004;144:167–175. doi: 10.1016/j.forsciint.2004.04.051. - DOI - PubMed
    1. Nelson E (2000) Estimation of short-term postmortem interval utilizing core body temperature: a new algorithm. https://www.ncbi.nlm.nih.gov/pubmed/10759069. Accessed 15 Nov 2019 - PubMed
    1. Madea B. Methods for determining time of death. Forensic Sci Med Pathol. 2016;12:451–485. doi: 10.1007/s12024-016-9776-y. - DOI - PubMed
    1. Cordeiro C, Ordóñez-Mayán L, Lendoiro E, Febrero-Bande M, Vieira DN, Muñoz-Barús JI. A reliable method for estimating the postmortem interval from the biochemistry of the vitreous humor, temperature and body weight. Forensic Sci Int. 2019;295:157–168. doi: 10.1016/j.forsciint.2018.12.007. - DOI - PubMed
    1. Henssge C, Althaus L, Bolt J, Freislederer A, Haffner HT, Henssge CA, Hoppe B, Schneider V. Experiences with a compound method for estimating the time since death. I. Rectal temperature nomogram for time since death. Int J Legal Med. 2000;113:303–319. doi: 10.1007/s004149900089. - DOI - PubMed

LinkOut - more resources