

Targeting the spatial context of obesity determinants via multiscale geographically weighted regression
- PMID: 32248807
- PMCID: PMC7132879
- DOI: 10.1186/s12942-020-00204-6
Targeting the spatial context of obesity determinants via multiscale geographically weighted regression
Abstract
Background: Obesity rates are recognized to be at epidemic levels throughout much of the world, posing significant threats to both the health and financial security of many nations. The causes of obesity can vary but are often complex and multifactorial, and while many contributing factors can be targeted for intervention, an understanding of where these interventions are needed is necessary in order to implement effective policy. This has prompted an interest in incorporating spatial context into the analysis and modeling of obesity determinants, especially through the use of geographically weighted regression (GWR).
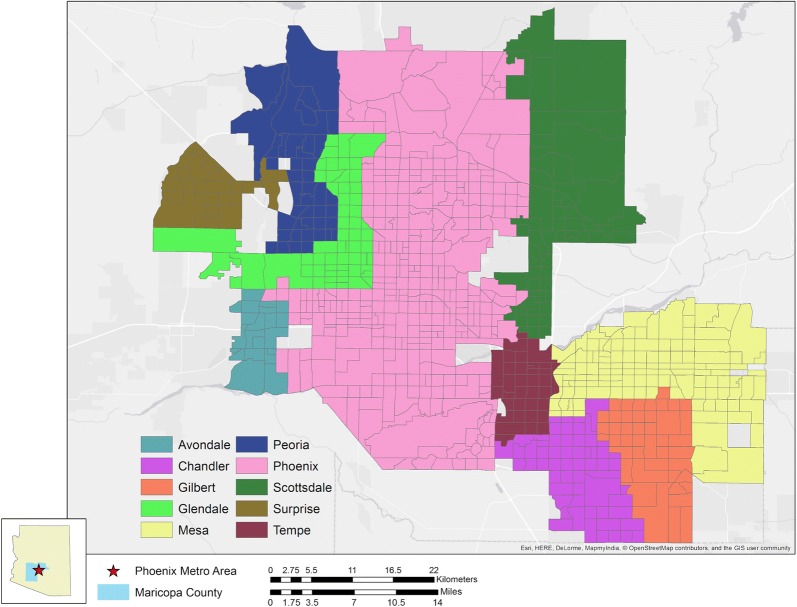
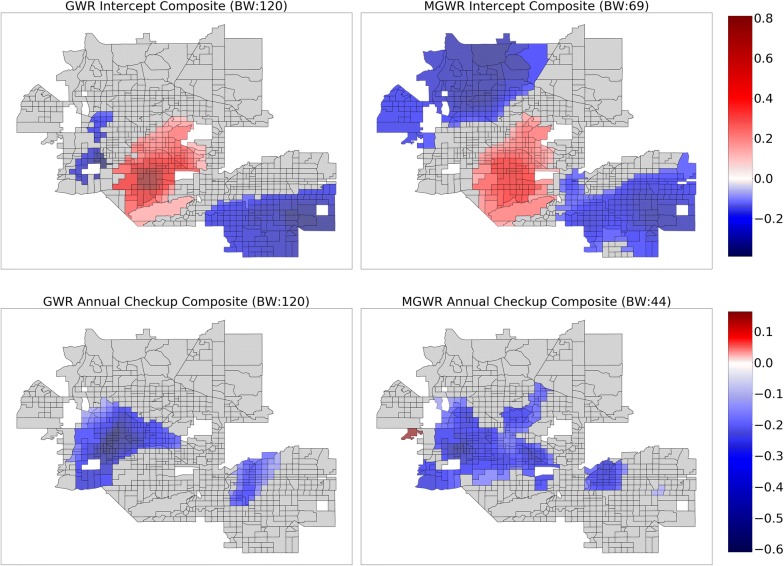
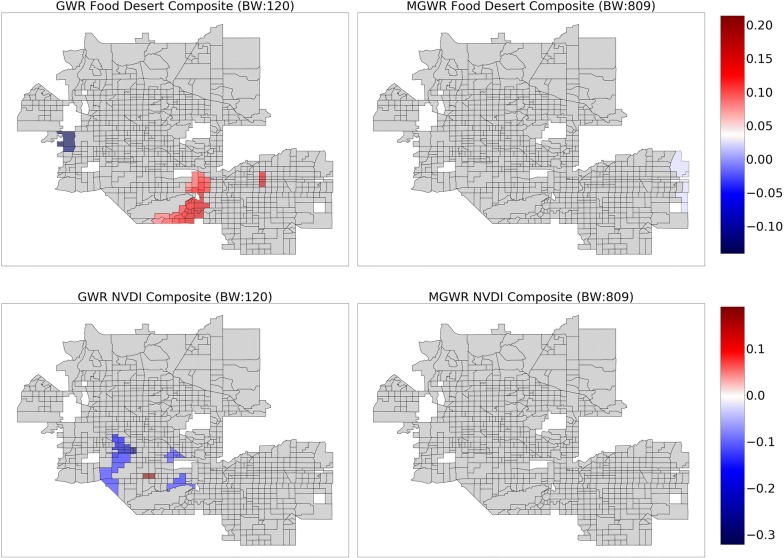
Method: This paper provides a critical review of previous GWR models of obesogenic processes and then presents a novel application of multiscale (M)GWR using the Phoenix metropolitan area as a case study.
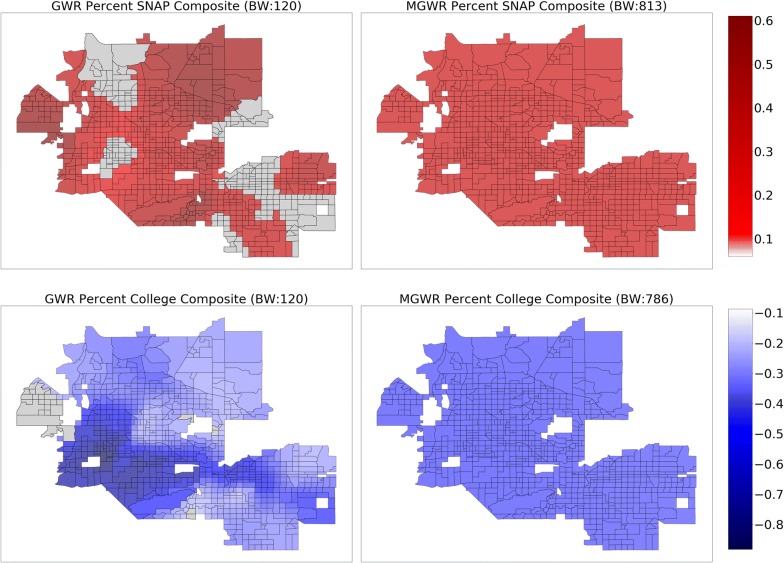
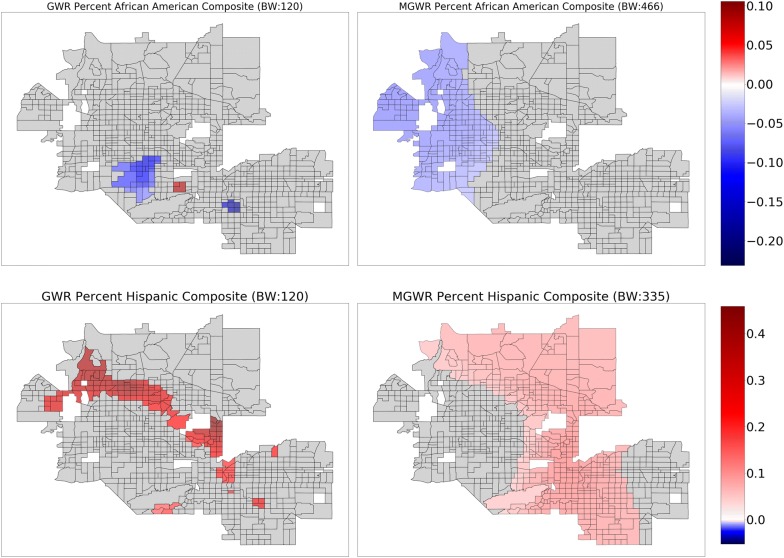
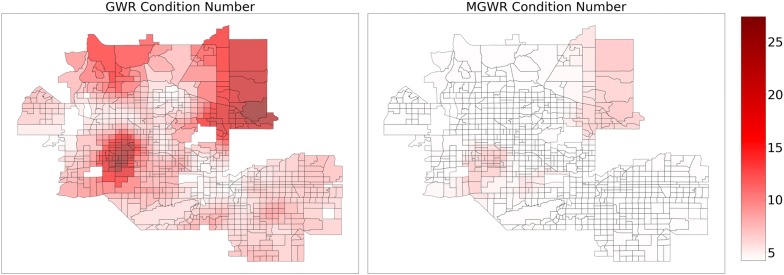
Results: Though the MGWR model consumes more degrees of freedom than OLS, it consumes far fewer degrees of freedom than GWR, ultimately resulting in a more nuanced analysis that can incorporate spatial context but does not force every relationship to become local a priori. In addition, MGWR yields a lower AIC and AICc value than GWR and is also less prone to issues of multicollinearity. Consequently, MGWR is able to improve our understanding of the factors that influence obesity rates by providing determinant-specific spatial contexts.
Conclusion: The results show that a mix of global and local processes are able to best model obesity rates and that MGWR provides a richer yet more parsimonious quantitative representation of obesity rate determinants compared to both GWR and ordinary least squares.
Keywords: GWR; Multiscale; Obesity; Spatial epidemiology; Urban health.
Conflict of interest statement
The authors declare that they have no competing interests.
Figures
Similar articles
-
Ingestion of GNSS-Derived ZTD and PWV for Spatial Interpolation of PM2.5 Concentration in Central and Southern China.Int J Environ Res Public Health. 2021 Jul 27;18(15):7931. doi: 10.3390/ijerph18157931. Int J Environ Res Public Health. 2021. PMID: 34360223 Free PMC article.
-
Local spatial variations analysis of smear-positive tuberculosis in Xinjiang using Geographically Weighted Regression model.BMC Public Health. 2016 Oct 6;16(1):1058. doi: 10.1186/s12889-016-3723-4. BMC Public Health. 2016. PMID: 27716319 Free PMC article.
-
Identifying determinants for the seropositive rate of schistosomiasis in Hunan province, China: A multi-scale geographically weighted regression model.PLoS Negl Trop Dis. 2023 Jul 13;17(7):e0011466. doi: 10.1371/journal.pntd.0011466. eCollection 2023 Jul. PLoS Negl Trop Dis. 2023. PMID: 37440524 Free PMC article.
-
[Spatial Prediction Modeling for Soil pH Based on Multiscale Geographical Weighted Regression(MGWR) and Its Influencing Factors].Huan Jing Ke Xue. 2023 Dec 8;44(12):6909-6920. doi: 10.13227/j.hjkx.202212031. Huan Jing Ke Xue. 2023. PMID: 38098414 Chinese.
-
GIS-based spatial modeling of COVID-19 incidence rate in the continental United States.Sci Total Environ. 2020 Aug 1;728:138884. doi: 10.1016/j.scitotenv.2020.138884. Epub 2020 Apr 22. Sci Total Environ. 2020. PMID: 32335404 Free PMC article.
Cited by
-
Analysing the global and local spatial associations of medical resources across Wuhan city using POI data.BMC Health Serv Res. 2023 Jan 28;23(1):96. doi: 10.1186/s12913-023-09051-0. BMC Health Serv Res. 2023. PMID: 36709274 Free PMC article.
-
Spatial nonstationarity and the role of environmental metal exposures on COVID-19 mortality in New Mexico.Appl Geogr. 2024 Oct;171:103400. doi: 10.1016/j.apgeog.2024.103400. Epub 2024 Aug 30. Appl Geogr. 2024. PMID: 39463888
-
Where environment and malaria intersect: Exploring the spatio-temporal footprints of Plasmodium falciparum in Tanzania.PLoS One. 2025 May 27;20(5):e0321200. doi: 10.1371/journal.pone.0321200. eCollection 2025. PLoS One. 2025. PMID: 40424291 Free PMC article.
-
Spatial analysis of COVID-19 incidence and the sociodemographic context in Brazil.PLoS One. 2021 Mar 1;16(3):e0247794. doi: 10.1371/journal.pone.0247794. eCollection 2021. PLoS One. 2021. PMID: 33647044 Free PMC article.
-
Spatial Machine Learning for Exploring the Variability in Low Height-For-Age From Socioeconomic, Agroecological, and Climate Features in the Northern Province of Rwanda.Geohealth. 2024 Sep 4;8(9):e2024GH001027. doi: 10.1029/2024GH001027. eCollection 2024 Sep. Geohealth. 2024. PMID: 39234601 Free PMC article.
References
-
- World Health Organization . Diet, nutrition, and the prevention of chronic diseases: Report of a WHO-FAO Expert Consultation. Geneva: World Health Organization; 2003.
-
- NCHS (National Center for Health Statistics). National Health and Nutrition Examination Survey. 2017. https://www.cdc.gov/nchs/data/factsheets/factsheet_nhanes.pdf.
Publication types
MeSH terms
LinkOut - more resources
Full Text Sources
Medical
