. 2020 Apr 6;17(1):100.
doi: 10.1186/s12974-020-01779-4.

The impact of hyperpolarization-activated cyclic nucleotide-gated (HCN) and voltage-gated potassium KCNQ/Kv7 channels on primary microglia function

Affiliations

The impact of hyperpolarization-activated cyclic nucleotide-gated (HCN) and voltage-gated potassium KCNQ/Kv7 channels on primary microglia function

Sabine Ulrike Vay et al. J Neuroinflammation. .

Abstract

Background: Microglia are essential to maintain cell homeostasis in the healthy brain and are activated after brain injury. Upon activation, microglia polarize towards different phenotypes. The course of microglia activation is complex and depends on signals in the surrounding milieu. Recently, it has been suggested that microglia respond to ion currents, as a way of regulating their activity and function.

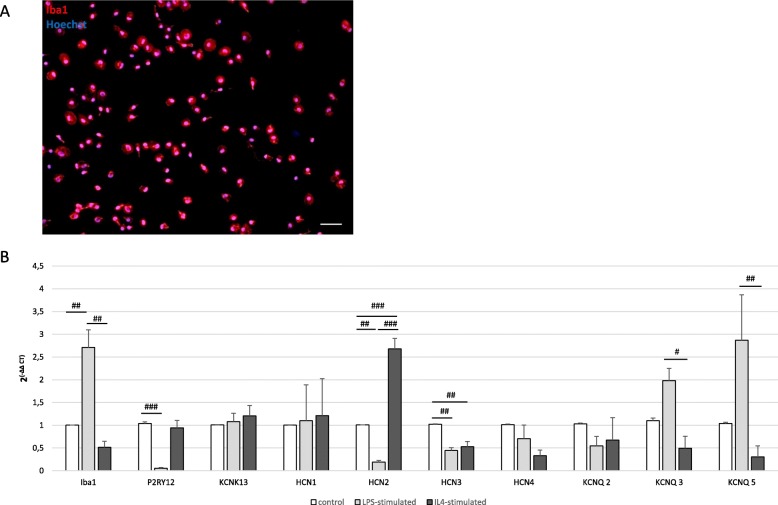
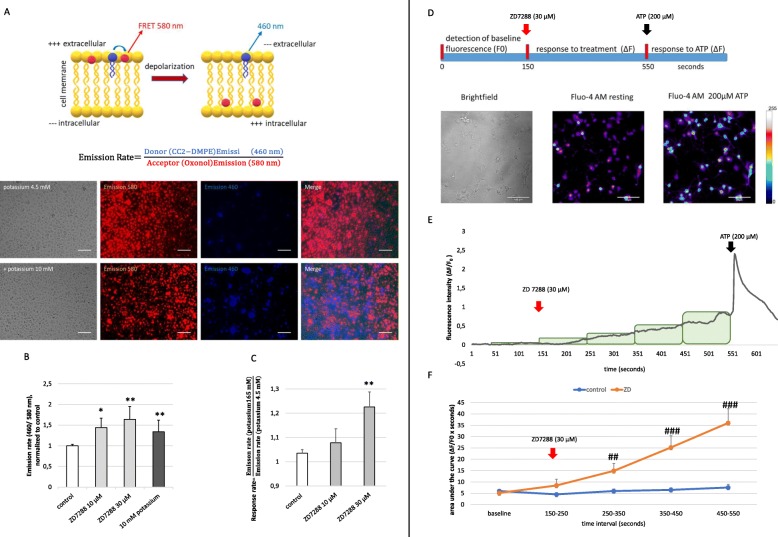
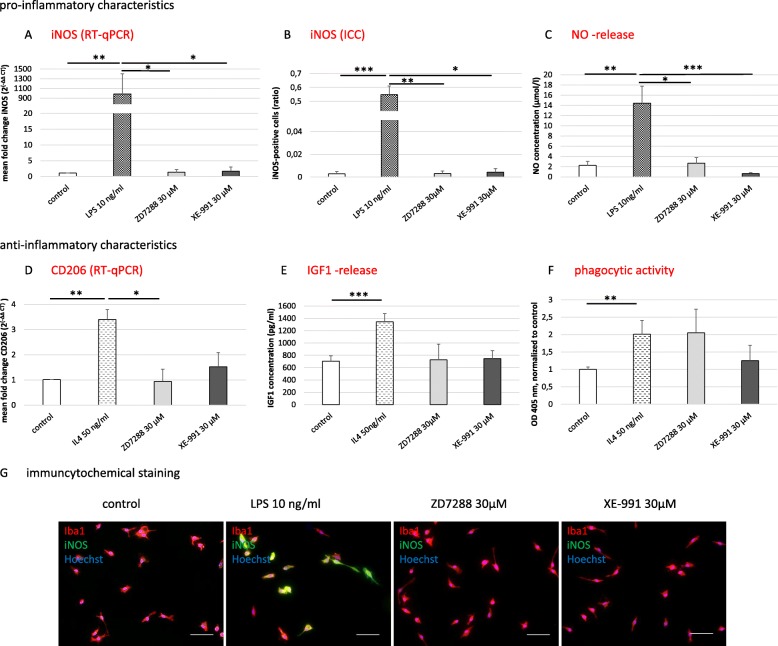
Methods and results: Under the hypothesis that HCN and KCNQ/Kv7 channels impact on microglia, we studied primary rat microglia in the presence or absence of specific pharmacological blockade or RNA silencing. Primary microglia expressed the subunits HCN1-4, Kv7.2, Kv7.3, and Kv7.5. The expression of HCN2, as well as Kv7.2 and Kv7.3, varied among different microglia phenotypes. The pharmacological blockade of HCN channels by ZD7288 resulted in cell depolarization with slowly rising intracellular calcium levels, leading to enhanced survival and reduced proliferation rates of resting microglia. Furthermore, ZD7288 treatment, as well as knockdown of HCN2 RNA by small interfering RNA, resulted in an attenuation of later microglia activation-both towards the anti- and pro-inflammatory phenotype. However, HCN channel inhibition enhanced the phagocytic capacity of IL4-stimulated microglia. Blockade of Kv7/KCNQ channel by XE-991 exclusively inhibited the migratory capacity of resting microglia.

Conclusion: These observations suggest that the HCN current contributes to various microglia functions and impacts on the course of microglia activation, while the Kv7/KCNQ channels affect microglia migration. Characterizing the role of HCN channels in microglial functioning may offer new therapeutic approaches for targeted modulation of neuroinflammation as a hallmark of various neurological disorders.

Keywords: Cerebral ischemia; Ih-current; Ion channel; Microglia activation; Microglia phenotype; Migration; Neuroinflammation; Phagocytosis; Voltage sensor probes; XE-991; ZD7288; siHCN2.


Conflict of interest statement

The authors declare that they have no competing interests.

Figures

Fig. 1
Fig. 1
HCN channel and KCNQ/Kv7 channel expression on primary microglia. #p < 0.05, ##p < 0.01, ###p < 0.001 compared different experimental groups as marked by horizontal bar. a A representative image of primary microglia culture shows purity by staining of Iba1 (red). Hoechst stains all cell nuclei blue. Images were obtained with a fluorescence microscope, scale bars = 100 μm. b Expression of microglia marker Iba1 and P2RY12. Expression of microglial ion channels KCNK13, the HCN-subunits HCN1, HCN2, HCN3, and HCN4, as well as the KCNQ/Kv7 channel subunits KCNQ2, 3, and 5, on primary rat microglia in vitro measured by RT-qPCR. Microglia were untreated, activated with LPS (10 ng/ml) or IL4 (50 ng/ml; for Iba1: F(2, 6) = 23.571, p = 0.001, ω = 0.913; for P2YR12. F(2, 6) = 31.897, p = 0.001, ω = 0.934; for HCN2: F(2, 18) = 113.981, p < 0.0001, ω = 0.956; for HCN3: F(2, 8) = 22.573, p = 0.001, ω = 0.892; for KCNQ3: F(2, 11) = 11.674, p = 0.002, ω = 0.777; for KCNQ5: H(2) = 9.168, p = 0.01)
Fig. 2
Fig. 2
The impact of the HCN channel on the membrane potential and intracellular calcium concentration [Ca2+]i.*p < 0.05, **p < 0.01, ***p < 0.001 compared to control; #p < 0.05, ##p < 0.01, ###p < 0.001 compared to the untreated experimental group measured at the same time interval. a HCN channel characterized by a fluorescence resonance energy transfer (FRET)-derived measurement of the membrane potential. The schematic illustration was modified from the description by Thermo Fisher Scientific. The FRET pair was composed of a highly fluorescent, mobile, voltage-sensitive acceptor oxonol (DiSBAC2) and a fluorescent, membrane-bound coumarin-phospholipid FRET donor (CC2-DMPE). In resting cells, both members of the FRET pair bind to the outer surface of the cell membrane, resulting in efficient FRET. When the cells are depolarized, the oxonol dye translocates to the inner surface of the cell membrane, resulting in diminished FRET. The emission rate (the ratio of the donor emission to acceptor emission) reports changes in the membrane potential and is low in polarized cells and increases in depolarized cells. Representative images of primary microglia supplied with VSPs. Fluorescence microscopy revealed the emission of 460 nm (blue) and 580 nm (red; scale bars = 100 μm). b Microglia exposed to the FRET pair CC2-DMPE and DISBAC2 were untreated or pre-treated with ZD7288 (10 and 30 μM) 10 min before the emission at 580 nm, and 460 nm was measured with a BMG FLUOstar Omega reader. Data reveal the calculation of the emission rate (460/580). Potassium served as a positive control. Data were normalized to the untreated control (H(3) = 17.188, p = 0.001). c Response rate was calculated as the fraction of the acute emission rate after treating cells with high potassium (165 mM KCl), and the emission rate before potassium was added. Data reveal the response rate of untreated microglia compared to microglia that were pretreated with 10 μM and 30 μM ZD7288 10 min before measurement started (H(2) = 9.379; p = 0.009). d To asses changes in the intracellular Ca2+ concentration, primary microglia were loaded with fluorescent Fluo-4 (Fluo-4 AM), and images were captured every second during the experiment. The schematic illustration gives an overview of the experimental setup. Thirty micromolar of ZD7288 and 200 μM ATP were added 150 s and 550 s after the start of the experiment, respectively. The time-resolved fluorescence intensity at baseline (F0), as well as the change of fluorescence (ΔF), was analyzed for each time point during measurement. Representative images depict primary microglia in the brightfield technique, as well as with fluorescence microscopy in untreated status and after treatment with 200 μM ATP. e Ca2+ response of one representative primary microglia cell was examined in the presence of 30 μM ZD7288 (after 150 s of baseline measurement) and subsequent ATP-application (200 μM, 400 s after ZD7288 application). Data are presented as ΔF/F0 for each time point. Rectangle depict 100-s intervals that were used to assess the f area under curve (AUC; ΔF/F0 × s). Data are shown as mean values of 38 controls and 38 ZD7288-treated cells. Only cells that responded to 200 μM ATP were used for data acquisition (MWU was performed for each time interval: 250–350 s, p = 0.004; 350–450 s as well as 450–550 s p < 0.0001)
Fig. 3
Fig. 3
The impact of functional HCN and KCNQ/Kv7 channels on cell count, survival, and proliferation of primary microglia.*p < 0.05; **p < 0.01; ***p < 0.001 compared to controls. a The total number of viable cells was counted after blockade of the HCN channel with ZD7288 (10 μM and 30 μM, n.s.), and after blockade of KCNQ/Kv7 channel with XE-991 (10 μM and 30 μM). Data are shown as mean values per field of view (FOV). b Ratio of viable versus dead primary microglia subjected to ZD7288 and XE-991 as assessed by live/dead-assay (10 μM and 30 μM of each; F(4, 25) = 4.129, p = 0.011, ω = 0.375). Data are shown as a ratio of living cells normalized to control = 1 (absolute percentage of living cells of control = 93.5%). c Release of LDH was measured photometrically (LDH-assay) as a surrogate for cell death after treatment of microglia with ZD7288 or XE-991 (10 μM and 30 μM each). Lysed cells served as control (H(5) = 28.27, p < 0.0001; positive control is significant to all other conditions). d Proliferation rate was measured by Ki67 expression on RNA level by RT-qPCR after blockade of the HCN channel with ZD7288 and XE-991 (10 μM and 30 μM each; F(4,17) = 6.059, p = 0.003, ω = 0.48). e Proliferation rate after treatment with ZD7288 and XE-991 (10 μM and 30 μM each) was revealed by BrdU incorporation (F(4,19) = 3.319, p = 0.032, ω = 0.273). f Migration of microglia in the Boyden chamber assay under the influence of ZD7288 and XE-991(10 μM and 30 μM each; F(4, 47) = 4.846, p = 0.002, ω = 0.228). Data were blank-corrected and normalized to control. g Upper row: representative immunocytochemical images of the live/dead-assay. All cells regardless of viability stained by Hoechst (blue) and dead cells were identified by propidium iodide incorporation (red); scale bars = 100 μm. Lower row: representative images of the BrdU-proliferation assay are shown. Hoechst stains all cell nuclei blue, BrdU (green) identify proliferating cells. Scale bars = 50 μm
Fig. 4
Fig. 4
Activation characteristics of primary microglia. *p < 0.05; **p < 0.01; ***p < 0.001 compared to different experimental groups as marked by a horizontal bar. Characterization of the activated pro-inflammatory microglia phenotype by the expression of the inducible nitric oxide (NO) synthetase (iNOS) and release of NO after blockade of HCN and KCNQ/Kv7 channels with ZD7288 and XE-991 (30 μM each), respectively. Treatment with LPS (10 ng/ml) served as a positive control. a. iNOS expression was measured on RNA level by RT-qPCR (H(3) = 11.608, p < 0.009) and on b protein level by immunocytochemistry (H(3) = 17.665, p = 0.001). c Release of NO was measured by Griess assay (μmol/l; H(3) = 15.784, p = 0.001). Characterization of the anti-inflammatory phenotype of activated microglia by expression of CD206, release of insulin-like growth factor 1 (IGF1), and change of phagocytic capacity, after pharmacological block of HCN and KCNQ/Kv7 channels by 30 μM ZD7288 and XE-991, respectively. Treatment with IL4 (25 ng/ml) served as a positive control. d Regulation of CD206 expression on RNA level was measured by RT-qPCR (F (3, 20) = 13.981, p < 0.0001, ω = 0.62). e IGF1 release was measured by ELISA (pg/ml, H(3) = 15.805, p = 0.001). f Zymosan engulfment showed phagocytic activity of microglia (H(3) = 11.653, p < 0.009). Data were blank-corrected and normalized to control. g Representative immunocytochemical stainings for the microglia marker Iba1 (red), co-stained for iNOS (green), and Hoechst as a nuclear counterstain (blue); scale bars = 50 μm
Fig. 5
Fig. 5
Impact of functional HCN and KCNQ/Kv7 channels on the activation capacity of primary microglia. *p < 0.05; **p < 0.01; ***p < 0.001. Stimulation of microglia with LPS (10 ng/ml) with simultaneous blockade of the HCN or the KCNQ/Kv7 channel and resulting expression of pro-inflammatory markers. The HCN channel was either blocked pharmacologically with ZD7288 (30 μM) or by transfection of silencer® small interfering (si)RNA targeting HCN2-mRNA (siHCN2-RNA). XE-991 (30 μM) was used to block KCNQ/Kv7. a Inducible nitric oxide (NO) synthase (iNOS) expression was measured on RNA level by RT-qPCR (H(3) = 17.142, p = 0.001) and on b protein level by immunocytochemistry (H(3) = 19.626, p < 0.0001). c NO release was measured by Griess assay (μmol/l; H(3) = 23.102, p < 0.0001). Data were normalized to LPS-only stimulation. Characterization of the anti-inflammatory microglia phenotype by the expression of CD206, release of insulin-like growth factor 1 (IGF1), and measurement of the phagocytic activity, after treatment with IL4 (50 ng/ml) and simultaneous blockade of the HCN and KCNQ/Kv7 channel as described above. d Regulation of CD206 expression was measured on RNA level by RT-qPCR (H(3) = 12.755, p = 0.005). e Release of IGF1 was measured by ELISA (pg/ml; H(3) = 16.611, p = 0.001). f Zymosan engulfment indicated phagocytotic activity of microglia (H(2) = 7.501, p = 0.024). Data were normalized to IL4-only stimulation. g Representative images of the immunocytochemical staining for the microglia marker Iba1 (red), co-stained for iNOS (green), and Hoechst as a nuclear counterstain (blue); scale bars = 50 μm

Similar articles

Cited by

References

    1. Walberer M, Jantzen SU, Backes H, Rueger MA, Keuters MH, Neumaier B, Hoehn M, Fink GR, Graf R, Schroeter M. In-vivo detection of inflammation and neurodegeneration in the chronic phase after permanent embolic stroke in rats. Brain Res. 2014;1581:80–88. doi: 10.1016/j.brainres.2014.05.030. - DOI - PubMed
    1. Walberer M, Rueger MA, Simard ML, Emig B, Jander S, Fink GR, Schroeter M. Dynamics of neuroinflammation in the macrosphere model of arterio-arterial embolic focal ischemia: an approximation to human stroke patterns. Exp Transl Stroke Med. 2010;2(1):22. doi: 10.1186/2040-7378-2-22. - DOI - PMC - PubMed
    1. Walter HL, Walberer M, Rueger MA, Backes H, Wiedermann D, Hoehn M, Neumaier B, Graf R, Fink GR, Schroeter M. In vivo analysis of neuroinflammation in the late chronic phase after experimental stroke. Neuroscience. 2015;292:71–80. doi: 10.1016/j.neuroscience.2015.02.024. - DOI - PubMed
    1. Ekdahl CT. Microglial activation - tuning and pruning adult neurogenesis. Front Pharmacol. 2012;3:41. doi: 10.3389/fphar.2012.00041. - DOI - PMC - PubMed
    1. Walton NM, Sutter BM, Laywell ED, Levkoff LH, Kearns SM, Marshall GP, 2nd, Scheffler B, Steindler DA. Microglia instruct subventricular zone neurogenesis. Glia. 2006;54(8):815–825. doi: 10.1002/glia.20419. - DOI - PubMed

MeSH terms

LinkOut - more resources