

Radiomics analysis of contrast-enhanced CT predicts lymphovascular invasion and disease outcome in gastric cancer: a preliminary study
- PMID: 32248822
- PMCID: PMC7132895
- DOI: 10.1186/s40644-020-00302-5
Radiomics analysis of contrast-enhanced CT predicts lymphovascular invasion and disease outcome in gastric cancer: a preliminary study
Abstract
Background: To determine whether radiomics features based on contrast-enhanced CT (CECT) can preoperatively predict lymphovascular invasion (LVI) and clinical outcome in gastric cancer (GC) patients.
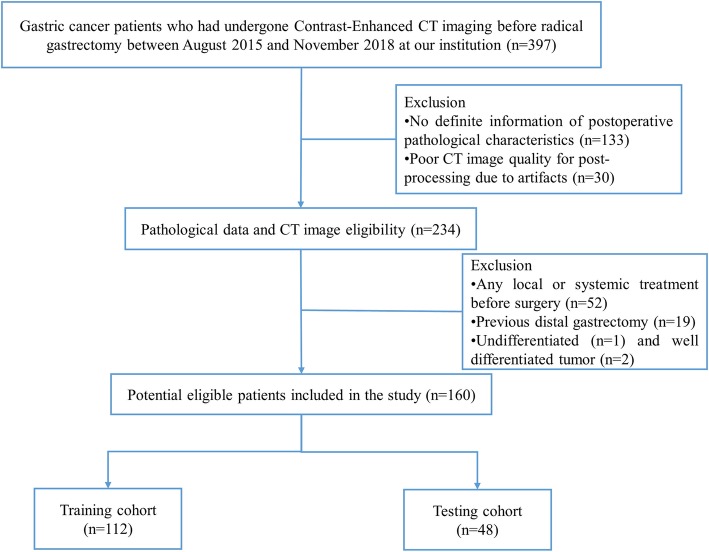
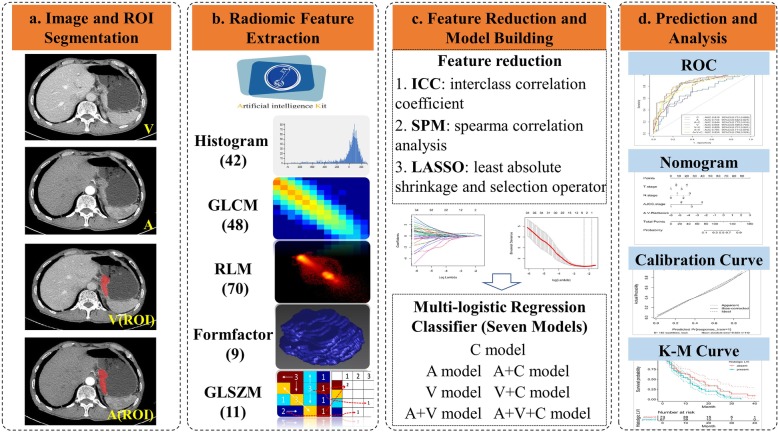
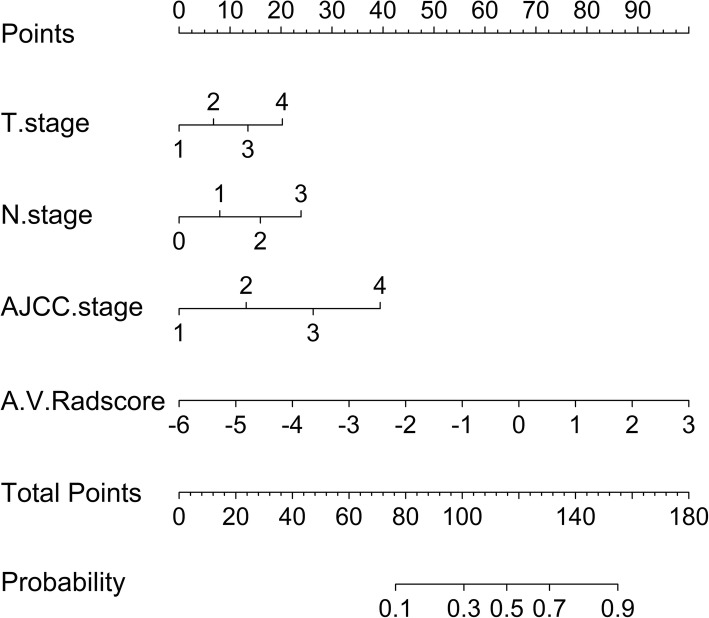
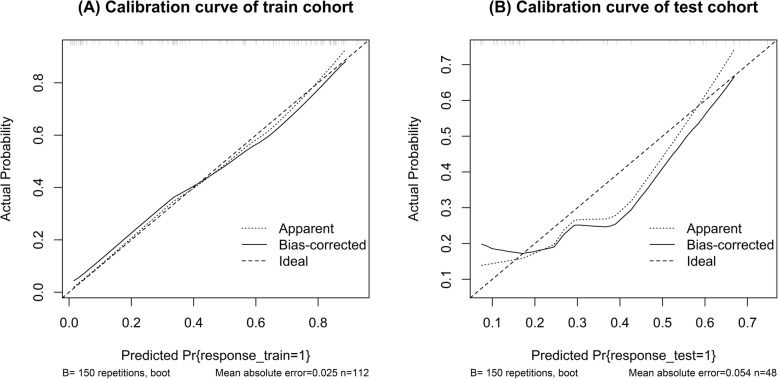
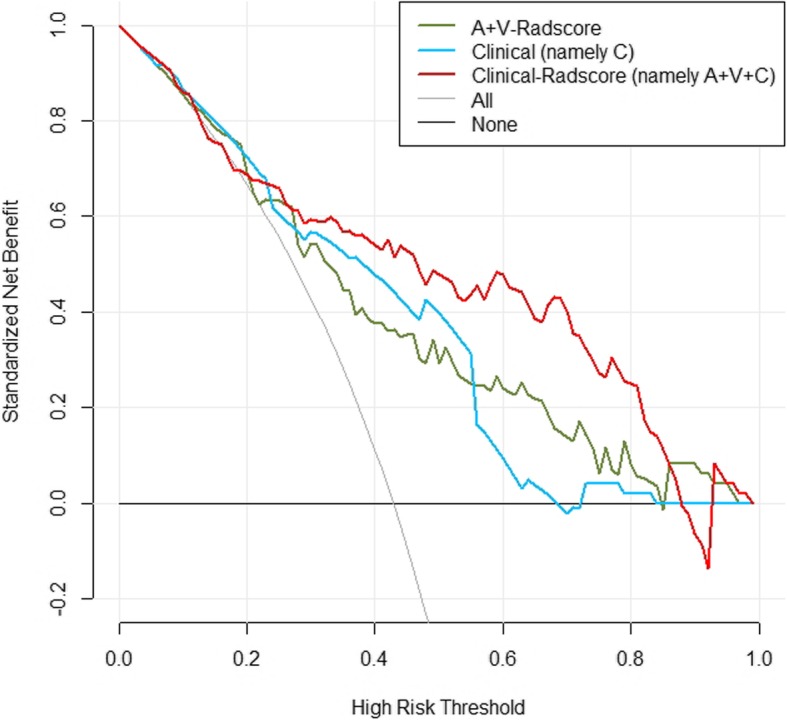
Methods: In total, 160 surgically resected patients were retrospectively analyzed, and seven predictive models were constructed. Three radiomics predictive models were built from radiomics features based on arterial (A), venous (V) and combination of two phase (A + V) images. Then, three Radscores (A-Radscore, V-Radscore and A + V-Radscore) were obtained. Another four predictive models were constructed by the three Radscores and clinical risk factors through multivariate logistic regression. A nomogram was developed to predict LVI by incorporating A + V-Radscore and clinical risk factors. Kaplan-Meier curve and log-rank test were utilized to analyze the outcome of LVI.
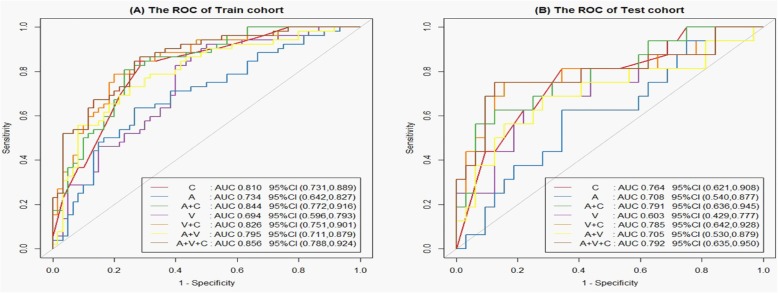
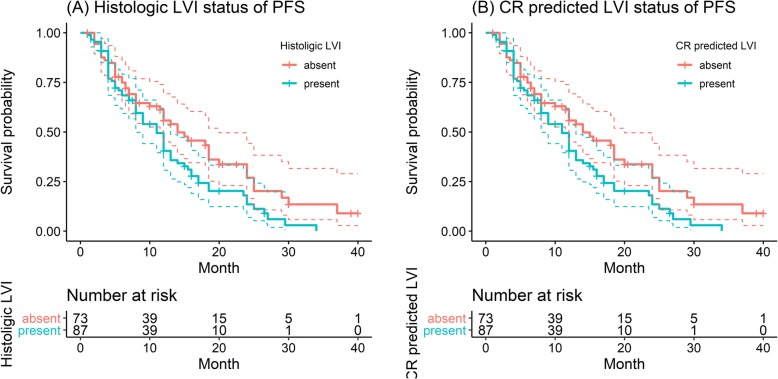
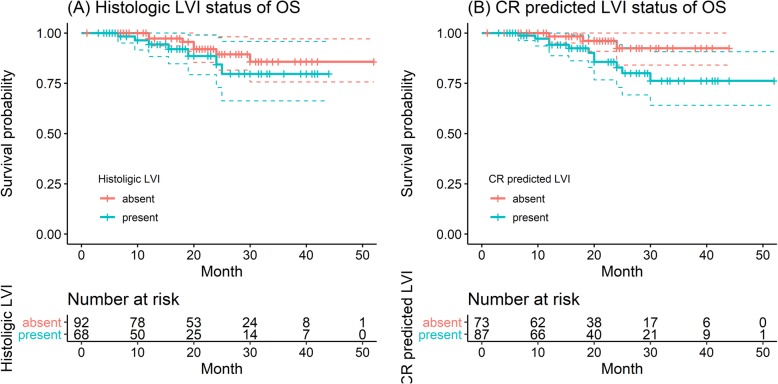
Results: Radiomics related to tumor size and intratumoral inhomogeneity were the top-ranked LVI predicting features. The related Radscores showed significant differences according to LVI status (P < 0.01). Univariate logistic analysis identified three clinical features (T stage, N stage and AJCC stage) and three Radscores as LVI predictive factors. The Clinical-Radscore (namely, A + V + C) model that used all these factors showed a higher performance (AUC = 0.856) than the clinical (namely, C, including T stage, N stage and AJCC stage) model (AUC = 0.810) and the A + V-Radscore model (AUC = 0.795) in the train cohort. For patients without LVI and with LVI, the median progression-free survival (PFS) was 11.5 and 8.0 months (P < 0.001),and the median OS was 20.2 and 17.0 months (P = 0.3), respectively. In the Clinical-Radscore-predicted LVI absent and LVI present groups, the median PFS was 11.0 and 8.0 months (P = 0.03), and the median OS was 20.0 and 18.0 months (P = 0.05), respectively. N stage, LVI status and Clinical-Radscore-predicted LVI status were associated with disease-specific recurrence or mortality.
Conclusions: Radiomics features based on CECT may serve as potential markers to successfully predict LVI and PFS, but no evidence was found that these features were related to OS. Considering that it is a single central study, multi-center validation studies will be required in the future to verify its clinical feasibility.
Keywords: Clinical outcome; Gastric cancer; Lymphovascular invasion; Radiomics.
Conflict of interest statement
The authors declare that they have no competing interests.
Figures
Similar articles
-
Dual-phase contrast-enhanced CT-based intratumoral and peritumoral radiomics for preoperative prediction of lymphovascular invasion in gastric cancer.BMC Med Imaging. 2025 Feb 10;25(1):43. doi: 10.1186/s12880-025-01569-5. BMC Med Imaging. 2025. PMID: 39930340 Free PMC article.
-
Radiomics Model Based on Contrast-enhanced CT Intratumoral and Peritumoral Features for Predicting Lymphovascular Invasion in Hypopharyngeal Squamous Cell Carcinoma.Acad Radiol. 2025 Apr;32(4):2099-2110. doi: 10.1016/j.acra.2024.11.017. Epub 2024 Dec 6. Acad Radiol. 2025. PMID: 39643470
-
Prognostic aspects of lymphovascular invasion in localized gastric cancer: new insights into the radiomics and deep transfer learning from contrast-enhanced CT imaging.Abdom Radiol (NY). 2022 Feb;47(2):496-507. doi: 10.1007/s00261-021-03309-z. Epub 2021 Nov 11. Abdom Radiol (NY). 2022. PMID: 34766197
-
Application of radiomics in precision prediction of diagnosis and treatment of gastric cancer.Jpn J Radiol. 2023 Mar;41(3):245-257. doi: 10.1007/s11604-022-01352-4. Epub 2022 Oct 19. Jpn J Radiol. 2023. PMID: 36260211 Review.
-
Radiomics in precision medicine for gastric cancer: opportunities and challenges.Eur Radiol. 2022 Sep;32(9):5852-5868. doi: 10.1007/s00330-022-08704-8. Epub 2022 Mar 22. Eur Radiol. 2022. PMID: 35316364 Review.
Cited by
-
Can Lymphovascular Invasion be Predicted by Preoperative Contrast-Enhanced CT in Esophageal Squamous Cell Carcinoma?Technol Cancer Res Treat. 2022 Jan-Dec;21:15330338221111229. doi: 10.1177/15330338221111229. Technol Cancer Res Treat. 2022. PMID: 35790460 Free PMC article.
-
Radiomics signature for predicting postoperative disease-free survival of patients with gastric cancer: development and validation of a predictive nomogram.Diagn Interv Radiol. 2022 Sep;28(5):441-449. doi: 10.5152/dir.2022.211034. Diagn Interv Radiol. 2022. PMID: 36097638 Free PMC article. Clinical Trial.
-
Integrative nomogram of intratumoral, peritumoral, and lymph node radiomic features for prediction of lymph node metastasis in cT1N0M0 lung adenocarcinomas.Sci Rep. 2021 May 24;11(1):10829. doi: 10.1038/s41598-021-90367-4. Sci Rep. 2021. PMID: 34031529 Free PMC article.
-
Preoperative prediction of perineural invasion and lymphovascular invasion with CT radiomics in gastric cancer.Eur J Radiol Open. 2024 Jan 25;12:100550. doi: 10.1016/j.ejro.2024.100550. eCollection 2024 Jun. Eur J Radiol Open. 2024. PMID: 38314183 Free PMC article.
-
Dual-phase contrast-enhanced CT-based intratumoral and peritumoral radiomics for preoperative prediction of lymphovascular invasion in gastric cancer.BMC Med Imaging. 2025 Feb 10;25(1):43. doi: 10.1186/s12880-025-01569-5. BMC Med Imaging. 2025. PMID: 39930340 Free PMC article.
References
MeSH terms
LinkOut - more resources
Full Text Sources
Medical
Miscellaneous
