. 2020 Jun;10(6):836-853.
doi: 10.1158/2159-8290.CD-19-0982. Epub 2020 Apr 5.

Combined Cohesin-RUNX1 Deficiency Synergistically Perturbs Chromatin Looping and Causes Myelodysplastic Syndromes

Affiliations

Combined Cohesin-RUNX1 Deficiency Synergistically Perturbs Chromatin Looping and Causes Myelodysplastic Syndromes

Yotaro Ochi et al. Cancer Discov. 2020 Jun.

Abstract

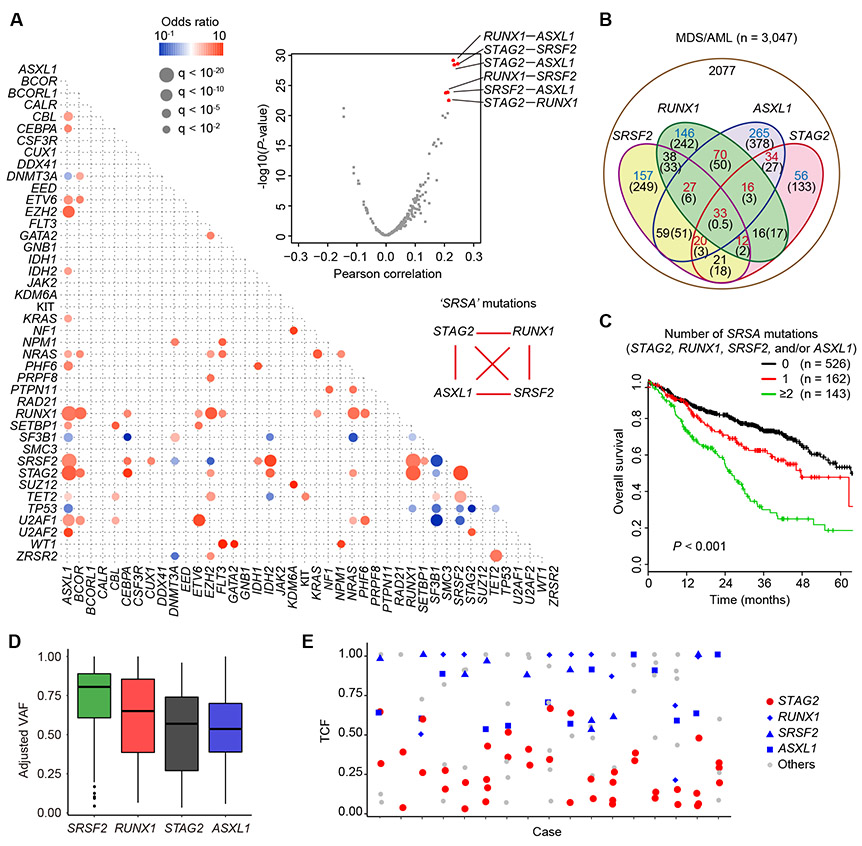
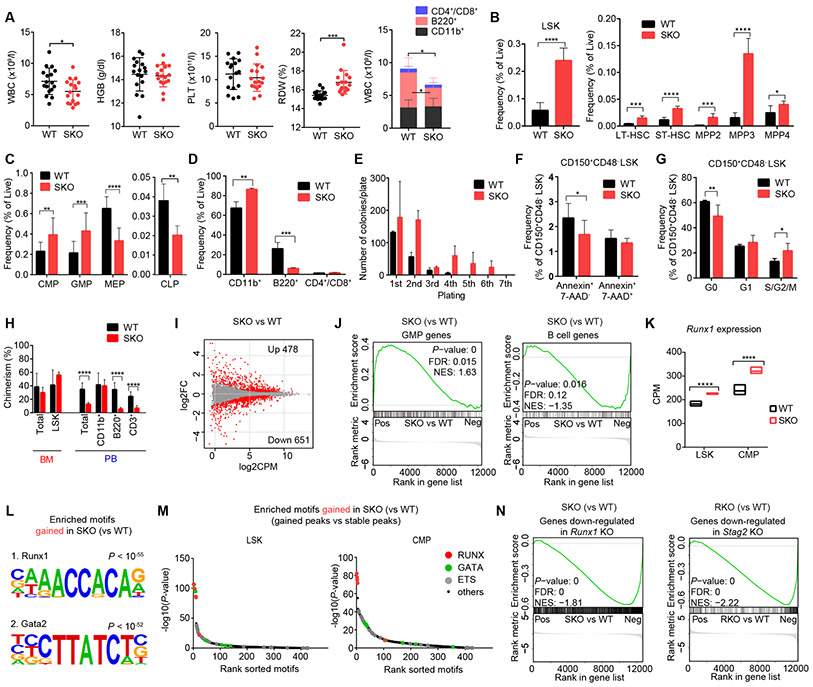
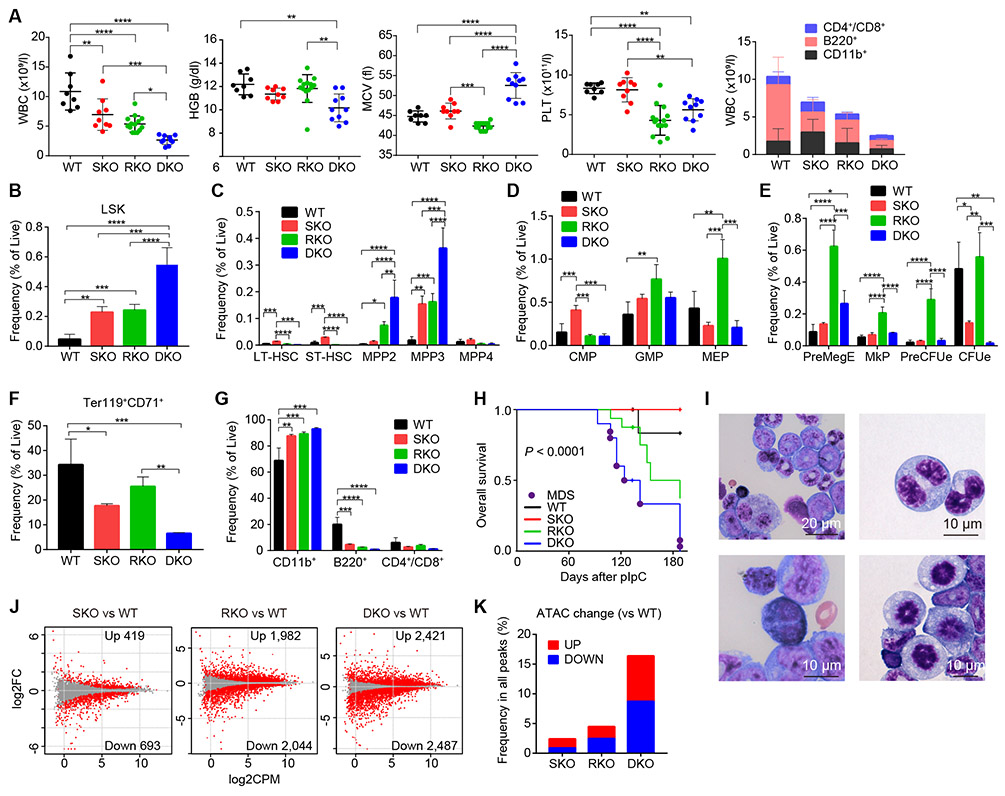
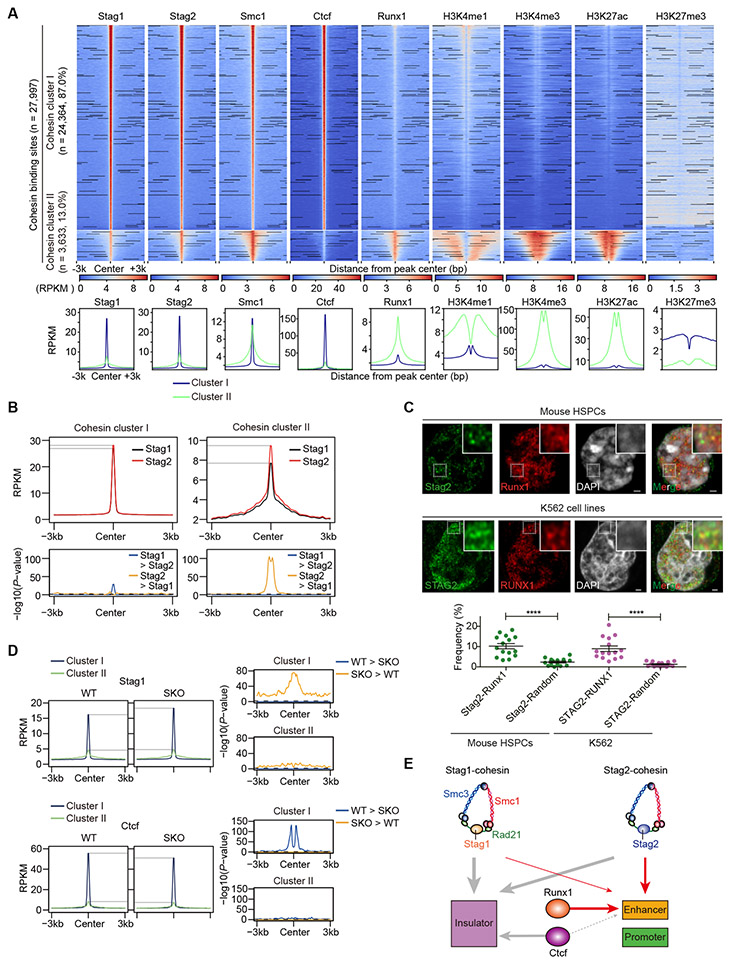
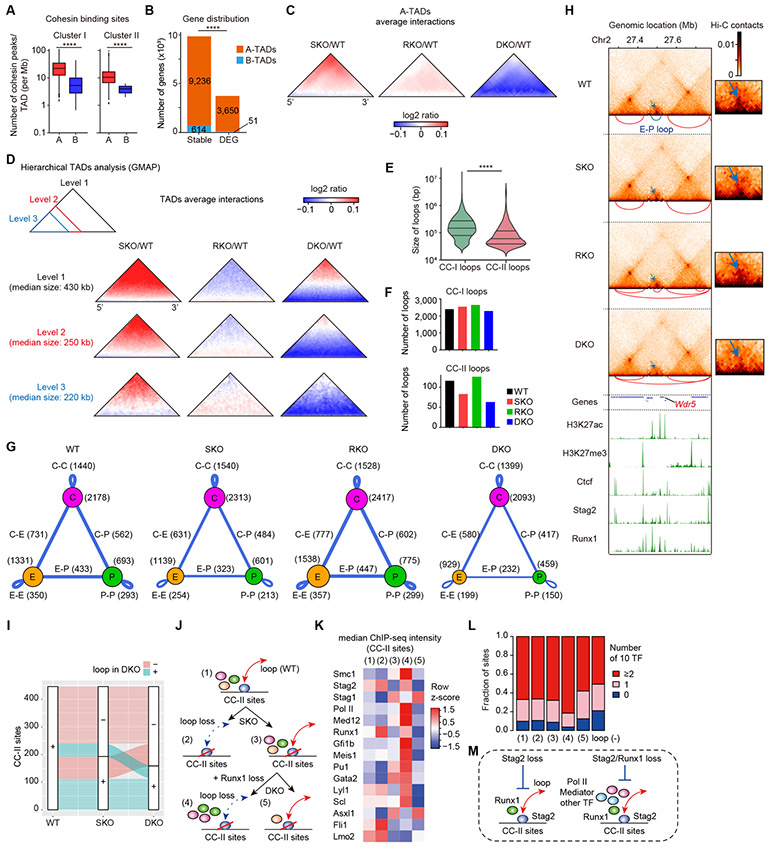
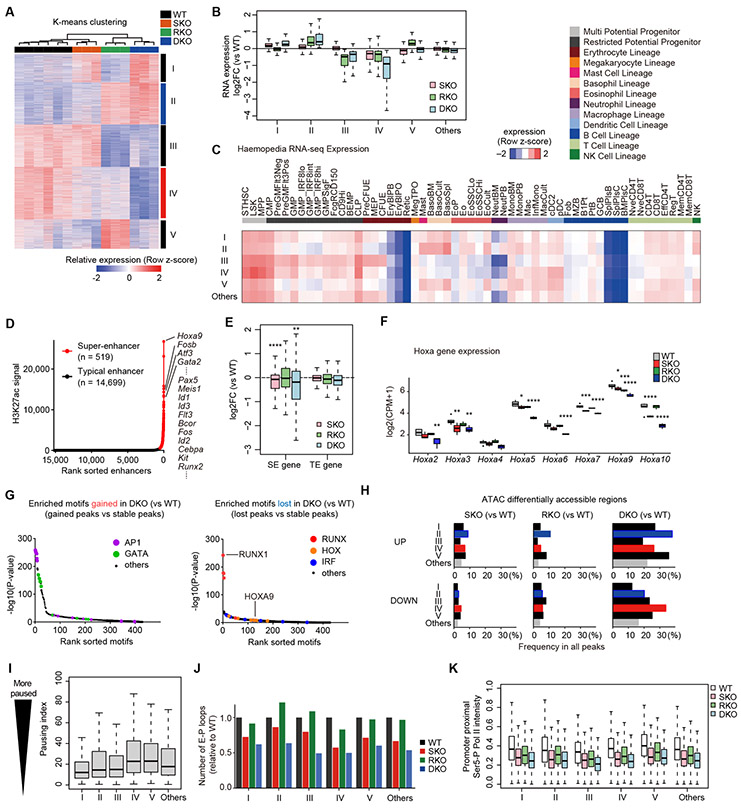
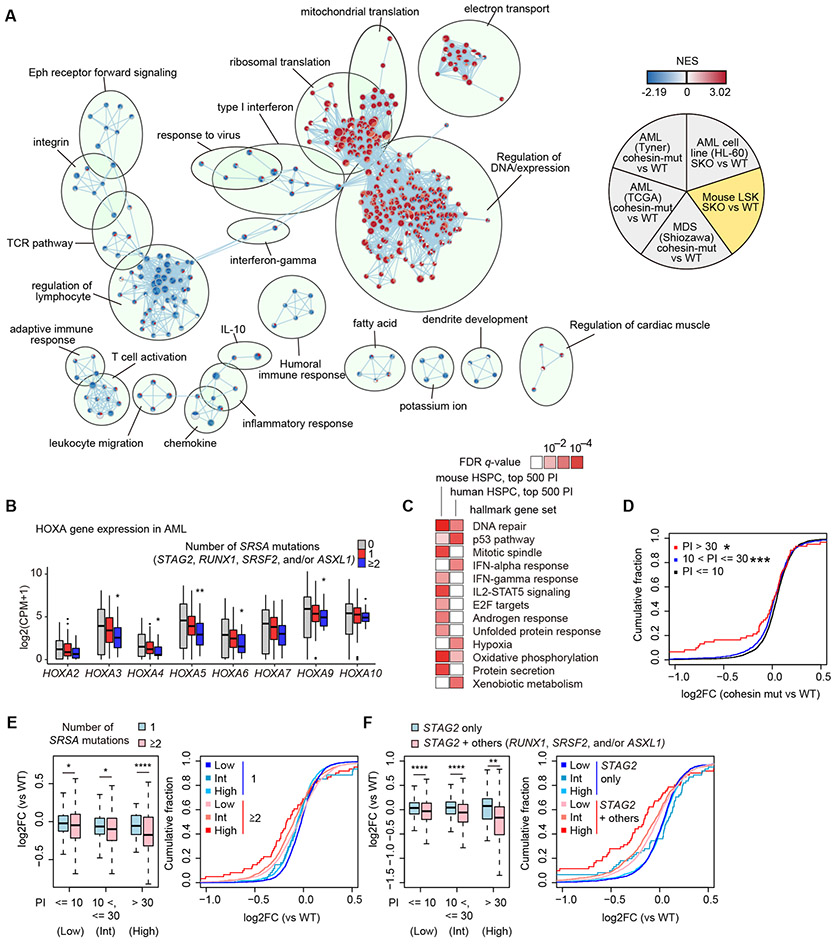
STAG2 encodes a cohesin component and is frequently mutated in myeloid neoplasms, showing highly significant comutation patterns with other drivers, including RUNX1. However, the molecular basis of cohesin-mutated leukemogenesis remains poorly understood. Here we show a critical role of an interplay between STAG2 and RUNX1 in the regulation of enhancer-promoter looping and transcription in hematopoiesis. Combined loss of STAG2 and RUNX1, which colocalize at enhancer-rich, CTCF-deficient sites, synergistically attenuates enhancer-promoter loops, particularly at sites enriched for RNA polymerase II and Mediator, and deregulates gene expression, leading to myeloid-skewed expansion of hematopoietic stem/progenitor cells (HSPC) and myelodysplastic syndromes (MDS) in mice. Attenuated enhancer-promoter loops in STAG2/RUNX1-deficient cells are associated with downregulation of genes with high basal transcriptional pausing, which are important for regulation of HSPCs. Downregulation of high-pausing genes is also confirmed in STAG2-cohesin-mutated primary leukemia samples. Our results highlight a unique STAG2-RUNX1 interplay in gene regulation and provide insights into cohesin-mutated leukemogenesis. SIGNIFICANCE: We demonstrate a critical role of an interplay between STAG2 and a master transcription factor of hematopoiesis, RUNX1, in MDS development, and further reveal their contribution to regulation of high-order chromatin structures, particularly enhancer-promoter looping, and the link between transcriptional pausing and selective gene dysregulation caused by cohesin deficiency.This article is highlighted in the In This Issue feature, p. 747.


Conflict of interest statement

Conflict of interest disclosure:

The authors declare no conflict of interest.

Figures

Figure 1.
Figure 1.. STAG2 and associated mutations in human MDS/AML.
A, Correlations between driver mutations in MDS/AML. Left panel: Significantly co-occurring and mutually exclusive mutations are shown in red and blue circles, respectively. Odds ratio and associated q-values are indicated by the color gradient and size of circles, respectively. Right upper panel: Volcano plot showing the relationship of Pearson correlation values and corresponding −log10(P-value) between any pairs of the co-occurring mutations found in more than five cases. P-values were calculated by Fisher’s exact test. B, Venn diagram showing the overlaps of ‘SRSA’ mutations (STAG2, RUNX1, SRSF2, and ASXL1) in MDS/AML cases. The numbers of cases are indicated in red or blue colors, in which >20% increase or decrease are observed compared with the expected numbers by chance as shown in parenthesis, respectively. C, Kaplan–Meier estimates of overall survival according to the number of SRSA mutations. P-value was calculated by log-rank test. D, Adjusted VAF values of SRSA mutations. E, Tumor cell fractions (TCFs) of indicated driver mutations are shown for the patients harboring two or more different STAG2 mutations.
Figure 2.
Figure 2.. Stag2 depletion alters HSC self-renewal and differentiation in mice.
A, White blood cell (WBC) count, hemoglobin (HGB) level, platelet (PLT) count and red cell distribution width (RDW) in the peripheral blood (PB) of wild-type (WT) and Stag2 conditional knockout (SKO) littermate male mice are plotted as dots (n = 17), in which the mean ± standard deviation (SD) are indicated as bars (left panels). Number of granulocytes/monocytes (CD11b+), B-lymphocytes (B220+) and T-lymphocytes (CD4+/CD8+) in the PB of WT and SKO mice (mean ± SD, n = 10) are shown in the right panel. B, Frequency of lineage (Lin)-negative/Sca1+/c-Kit+ (LSK) cells (left panel), and frequencies of long-term HSC (LT-HSC), short-time HSC (ST-HSC), multipotent progenitor (MPP)-2, MPP-3, and MPP-4 fractions in the BM of WT or SKO mice (mean ± SD, n = 6) (right panel) are shown. C, Frequencies of common myeloid progenitors (CMPs), granulocyte-macrophage progenitors (GMPs), megakaryocyte/erythrocyte lineage-restricted progenitors (MEPs) and common lymphoid progenitors (CLPs) in the BM of WT and SKO mice (mean ± SD, n = 6). D, Frequencies of each lineage-committed cells in the BM of WT and SKO mice (mean ± SD, n = 4). E, Colony counts in methylcellulose replating experiments using nucleated BM cells from WT or SKO mice (mean ± SD, n = 2) are shown. BM cells were plated in duplicate at a density of 20,000 cells/plate for the first plating and 10,000 cells/plate for replating. F, Frequency of apoptotic cells (Annexin+/7-AAD) in CD150+/CD48 LSK cells (n = 6, mean ± SD). G, Frequency of cycling cells (S/G2/M; Ki-67+/Hoechst+), quiescent cells (G0; Ki-67-/Hoechst-), and G1 cells (Ki-67+/Hoechst) in CD150+/CD48 LSK cells (n = 5, mean ± SD). H, Percentages of CD45.2+ donor cells within each fraction of the BM or PB after competitive BM transplantation (16 weeks after pIpC injection) are shown (mean ± SD, n = 10 for WT and 6 for SKO). I, MA plot showing the transcriptional changes between WT- and SKO-derived LSK cells. Differentially expressed genes (DEGs) (FDR < 0.05) are indicated by red color. FC, fold-change. J, Gene set enrichment analysis (GSEA) between WT- and SKO-derived LSK cells, showing a significant enrichment of genes characteristic of GMPs and B-lymphocytes. Nominal P-value, false discovery rate (FDR), and normalized enrichment score (NES) are indicated. K, Expression levels of Runx1 in LSK and CMP fractions are indicated by counts per million mapped reads (CPM) (min to max values with mean, n = 3). P-values were calculated using edgeR package in R software. L, Motifs and corresponding P-values identified by de novo motif search in ATAC-seq peaks that gained accessibility in SKO-derived LSK cells. M, Enrichment of known transcription factor (TF) motifs in ATAC-seq peaks that gained accessibility in SKO-derived LSK (left panel) and CMP cells (right panel). The sorted motif rank and −log10(P-value) of a motif enrichment test using stable peaks as backgrounds is indicated in horizontal and vertical axis, respectively. N, GSEA analysis between SKO- and WT-derived LSK cells, showing a negative enrichment of genes down-regulated in Runx1 conditional knockout (RKO)-derived LSK cells compared with WT (left panel), and GSEA analysis between RKO- and WT-derived LSK cells, showing a negative enrichment of genes down-regulated in SKO-derived LSK cells compared with WT (right panel). For panels (A-G), mice were analyzed at 12-24 weeks of age. * P < 0.05; ** P < 0.01; *** P < 0.001; **** P < 0.0001. Two-tailed unpaired Student’s t-test in (A-H).
Figure 3.
Figure 3.. Stag2/Runx1 double knockouts induce MDS in mice.
A, WBC, HGB, mean corpuscular volume (MCV), and PLT count in the PB of recipient mice transplanted with BM cells of WT, SKO, RKO, or Stag2/Runx1 double conditional knockout (DKO) mice are plotted as dots (n = 8 for WT, 9 for SKO, 14 for RKO and 10 for DKO), in which the mean ± SD are indicated as bars (left panels). Number of granulocytes/monocytes (CD11b+), B-lymphocytes (B220+), and T-lymphocytes (CD4+/CD8+) in the PB of WT-, SKO-, RKO-, and DKO- transplanted mice are shown in the right panel (mean ± SD, n = 9 for WT and SKO, 14 for RKO, and 4 for DKO). B-G, Frequencies of HSPCs (B-C), myeloid progenitors (D), megakaryocyte/erythroid progenitors (E), erythroblasts (F), and lineage-committed cells (G) in the BM are shown (mean ± SD, n = 5 for WT and RKO, and 3 for SKO and DKO). PreMegE, pre-megakaryocyte-erythroid progenitors; MkP, megakaryocytic progenitors; PreCFUe, pre-colony-forming unit erythroid cells; CFUe, colony-forming unit erythroid cells. H, Kaplan–Meier estimates of overall survival for each genotype (n = 9 for WT and SKO, 16 for RKO, and 10 for DKO). P-value was calculated by log-rank test. Death due to MDS is indicated by the purple circle. I, Representative May-Grünwald-Giemsa staining of BM cells showing dysplastic features, including pseudo-Pelger–Huët anomalies in neutrophils, binucleated megakaryocytes or erythroblasts, and abnormal mitosis. J, MA plot showing the transcriptional changes in LSK cells derived from SKO, RKO, and DKO mice compared with WT-derived LSK cells. DEGs (FDR < 0.05) are indicated by red color. K, Frequency of differentially accessible ATAC peaks for SKO-, RKO- and DKO-derived LSK cells compared with WT. In panels (A-G), mice were analyzed 16-20 weeks after pIpC injection. * P < 0.05; ** P < 0.01; *** P < 0.001; **** P < 0.0001. P-values were calculated by ordinary one-way ANOVA with Bonferroni analysis in (A-G).
Figure 4.
Figure 4.. Colocalization of Stag2-cohesin and Runx1 at enhancers.
A, Upper panels: ChIP-seq density heatmap of cohesin components (Stag1, Stag2, and Smc1), Ctcf, Runx1, and histone marks (H3K4me1, H3K4me3, H3K27ac, and H3K27me3) in c-Kit+ HSPCs of WT mice centered on Stag1- and/or Stag2-cohesin binding sites (n = 27,997) are depicted in descending order of Stag2 peak intensities, in which cohesin binding sites were divided into two clusters (cohesin cluster-I (CC-I) and cohesin cluster-II (CC-II)) according to the ChIP signals for Ctcf and H3K27ac (see also Supplementary Fig. S7A-B). Color scales below the heatmaps indicate ChIP-seq intensities (reads per kilobase per million mapped reads (RPKM)). Lower panels: Average ChIP-seq read intensity plot for CC-I (blue) and CC-II (green) distribution around the cohesin binding sites. B, Average ChIP-seq read intensities of Stag1 or Stag2 around CC-I or CC-II sites (upper panels) and P-values for comparison between Stag1 and Stag2 across each bin (lower panels). C, Super-resolution images of Stag2/Runx1 localization at the nucleus in a mouse c-Kit+ HSPC (upper panels) and STAG2/RUNX1 localization at the nucleus in a K562 cell line (middle panels). The dotted white box indicates the magnified region shown in the inset (Scale bars: 1μm). The images were obtained using a LSM880 Airy scan super-resolution microscope (Zeiss). Lower panel: Quantification of the colocalization of Stag2-Runx1 in mouse c-Kit+ HSPCs and colocalization of STAG2-RUNX1 in K562 cell lines. The dots indicate the percentages of the areas of Stag2 (STAG2)-Runx1 (RUNX1) double positive spots among total areas of Stag2 (STAG2) positive spots. ****p<0.0001, two-sided Wilcoxon rank-sum test (n = 15 from three biological replicates). D, Average ChIP-seq read intensities of Stag1 and Ctcf in WT- and SKO-derived HSPCs around CC-I (blue) and CC-II (green) sites (left panels) and P-values for comparison between WT and SKO across each bin (right panels). E, Schematic representation representing the preferential binding of Stag2-cohesin to active enhancers together with Runx1. P-values were calculated by one-sided Wilcoxon rank-sum test comparing the ChIP-intensities in each bin in (B) and (D). Horizontal dashed lines indicate P = 0.05 in (B) and (D).
Figure 5.
Figure 5.. Stag2/Runx1 codeficiency alters chromatin architectures and disrupts enhancer-promoter loops.
A, Number of cohesin peaks (CC-I or CC-II) within topologically-associating domains (TADs) located in genomic compartment A (A-TADs) or B (B-TADs). P-values were calculated by two-sided Wilcoxon rank-sum test. B, Number of DEGs between WT- and SKO/RKO/DKO-transplanted LSK cells (FDR < 0.05) or other genes (stable) located in A- or B-TADs. P-value was calculated by Fisher’s exact test. C, Average differential changes in Hi-C contacts within a subset of size-normalized A-TADs, visualized as log2 ratio indicated in the color scale. D, Average differential changes in Hi-C contacts within each hierarchical level of size-normalized TADs, showing the disruption of short-range interactions particularly within smaller sub-TADs in SKO, and more prominent in DKO. Hierarchical TADs were called using GMAP, and each level of TADs indicated in the upper-left panel was separately analyzed. E, Violin plots showing the size distribution of CC-I or CC-II loops with median and quartiles. P-value was calculated by two-sided Wilcoxon rank-sum test. Loops were classified by the presence of only one of either CC-I or CC-II sites at their anchors. F, Number of CC-I or CC-II loops independently identified using each Hi-C data. G, Summary of the major types of loops identified in each Hi-C data. Ctcf sites (CC-I sites) and active enhancers/promoters in which loops were anchored are displayed as purple, orange, and green circles, respectively. The loops between two sites are displayed as blue lines, and the width of the lines is proportional to the number of loops relative to WT. E, Enhancer; P, Promoter; C, CTCF; C-C, Ctcf-Ctcf; C-E, Ctcf-Enhancer: C-P, Ctcf-Promoter; E-E, Enhancer-Enhancer; E-P, Enhancer-Promoter; P-P, Promoter-Promoter. H, Genome browser snapshot demonstrating the Hi-C contacts, chromatin loops (upper panels), and ChIP-seq profiles (lower panels) in WT-/SKO-/RKO-/DKO-transplanted HSPCs at the Wdr5 gene (a group IV gene in Fig. 6A) locus. The arcs below each Hi-C contact map show the loops identified in the corresponding Hi-C data, and the E-P loop anchored at both promoter of Wdr5 and active enhancer was indicated as blue color. The dotted white box indicates the magnified region shown on the right. Color scale intensities of Hi-C heatmaps are shown in KR-normalized Hi-C contacts. Note that the E-P loop anchored at both promoter of Wdr5 and active enhancer was weakened in SKO, and more prominently in DKO (blue arrows). I, An alluvial plot demonstrating the proportion of CC-II sites having loops in WT which retained or lost loops in SKO and DKO. Red sites lost loops in DKO, and green sites retained loops in DKO. J, A classification scheme of CC-II sites with loops identified in WT for the analysis in (K) and (L). K, Median ChIP-seq intensities of various factors at each group of CC-II sites shown in (J). Color scales are normalized along each row. L, Proportions of numbers of co-bound 10 TFs (Asxl1, Fli1, Gata2, Gfi1b, Lmo2, Lyl1, Meis1, Pu1, Runx1, and Scl) at each group of CC-II sites shown in (J). M, Schematic representation depicting the characteristics of loops susceptible to Stag2/Runx1 loss. **** P < 0.0001.
Figure 6.
Figure 6.. Molecular features of transcriptional vulnerability to Stag2/Runx1 codeficiency.
A, -means clustering analysis of DEGs between WT- and SKO/RKO/DKO-derived LSK cells in RNA-seq datasets (FDR < 0.05). Color scales are normalized along each row. B, Box plots showing expression changes of each DEG group in SKO/RKO/DKO-derived LSK cells compared with WT. The vertical axis represents the log2(FC) in the indicated genotype and DEG group. C, Expression specificity of each DEG group across diverse hematopoietic lineages. Average expression levels of genes in the indicated DEG groups in each hematopoietic lineage are shown. Mouse expression datasets of diverse hematopoietic lineages are from Haemopedia RNA-seq datasets. Color scales are normalized along each row. D, Super-enhancers (SEs) and typical enhancers (TEs) identified by the standard ROSE algorithm using H3K27ac ChIP-seq intensities in HSPCs. E, Box plots showing expression changes of SE- and TE-associated genes in SKO/RKO/DKO-derived LSK cells compared with WT. P-values were calculated by one-sided Wilcoxon rank-sum test comparing SE genes vs TE genes. F, Box plots showing expression levels of Hoxa family genes in WT/SKO/RKO/DKO-derived LSK cells. P-values (vs WT) were calculated with edgeR package. G, Enrichment of known TF motifs in the ATAC-seq peaks that gained (left panel) or lost (right panel) accessibility in DKO-derived LSK cells compared with WT. The sorted motif rank and −log10(P-value) of a motif enrichment test using stable peaks as backgrounds are indicated in horizontal and vertical axis, respectively. H, Frequencies of differentially accessible ATAC-seq peaks in SKO/RKO/DKO-derived LSK cells compared with WT (FDR < 0.05) near genes in the indicated DEG group. I, Box plots showing Pol II pausing indices of genes in each DEG group. J, Number of E-P loops anchored at the promoters of genes in the indicated DEG groups. The vertical axis represents the relative number of loops in WT/SKO/RKO/DKO-derived HSPCs to WT. K, Box plots showing Ser5-P Pol II ChIP-seq intensities in the promoter proximal regions of genes in each DEG group in WT/SKO/RKO/DKO-derived HSPCs. * P < 0.05; ** P < 0.01; *** P < 0.001; **** P < 0.0001.
Figure 7.
Figure 7.. Shared transcriptome changes in human and mice.
A, Comparison of transcriptome changes in mouse model, three human MDS/AML, and HL-60 cell line datasets using enrichment map analysis based on GSEA results. NES values in cohesin-mutated MDS/AML cases compared with cohesin-WT cases in three independent cohort (6,33,34) are indicated in the upper left, lower left, and bottom of each circle, and those in SKO of HL-60 cell lines and LSK cells compared with WT are indicated in the upper right and lower right of each circle, respectively. Each node indicates a gene set of GSEA. The size of each node indicates the number of genes in each gene set, and the color scale indicates the NES value. The width of edge indicates the overlap size of gene sets. B, Box plots showing expression levels of HOXA family genes in human AML patients with 0/1/≥2 mutations in SRSA genes. P-values (vs no mutations in SRSA genes) were calculated with edgeR package. C, MSigDB overlap analysis between high-pausing genes and hallmark gene sets in MSigDB. FDR q-values were from MSigDB overlap analysis. Pathways which are significant (q < 0.01) in either dataset are shown. D, Cumulative probability distributions of expression changes (log2FC) of genes grouped by pausing index (PI) in cohesin-mutated cases (vs WT) in RNA-seq datasets of AML (33). P-values (vs genes with PI no more than 10) were calculated by one-sided Wilcoxon rank-sum test. E-F, Left panels: Box plots showing expression changes (log2FC) of genes grouped by PI according to the number of SRSA mutations (0/1/≥2) (E) or mutations in STAG2 with/without the other SRSA mutations (RUNX1, SRSF2, and/or ASXL1) (F) in RNA-seq datasets of AML (33). Right panels show cumulative probability distribution of expression changes (log2FC) shown in left panels. P-values were calculated by one-sided Wilcoxon rank-sum test. * P < 0.05; ** P < 0.01; *** P < 0.001; **** P < 0.0001.

Similar articles

Cited by

References

    1. Cazzola M, Della Porta MG, Malcovati L. The genetic basis of myelodysplasia and its clinical relevance. Blood 2013;122:4021–34. - PMC - PubMed
    1. Haferlach T, Nagata Y, Grossmann V, Okuno Y, Bacher U, Nagae G, et al. Landscape of genetic lesions in 944 patients with myelodysplastic syndromes. Leukemia 2014;28:241–7. - PMC - PubMed
    1. Papaemmanuil E, Gerstung M, Malcovati L, Tauro S, Gundem G, Van Loo P, et al. Clinical and biological implications of driver mutations in myelodysplastic syndromes. Blood 2013;122:3616–27; quiz 99. - PMC - PubMed
    1. Ogawa S Genetics of MDS. Blood 2019;133:1049–59. - PMC - PubMed
    1. Kon A, Shih LY, Minamino M, Sanada M, Shiraishi Y, Nagata Y, et al. Recurrent mutations in multiple components of the cohesin complex in myeloid neoplasms. Nat Genet 2013;45:1232–7. - PubMed

Publication types