

Characterization of the relationship between FLI1 and immune infiltrate level in tumour immune microenvironment for breast cancer
- PMID: 32249526
- PMCID: PMC7214163
- DOI: 10.1111/jcmm.15205
Characterization of the relationship between FLI1 and immune infiltrate level in tumour immune microenvironment for breast cancer
Abstract
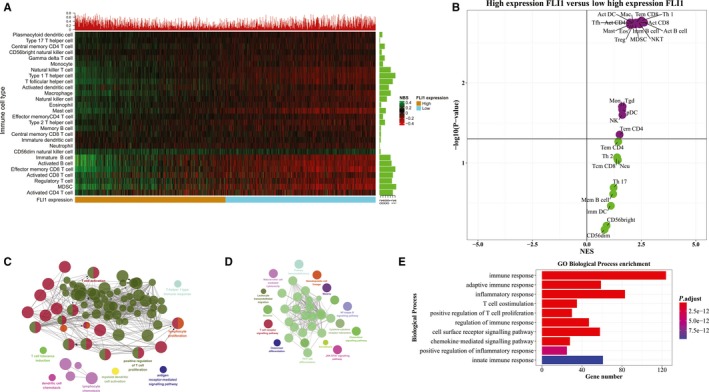
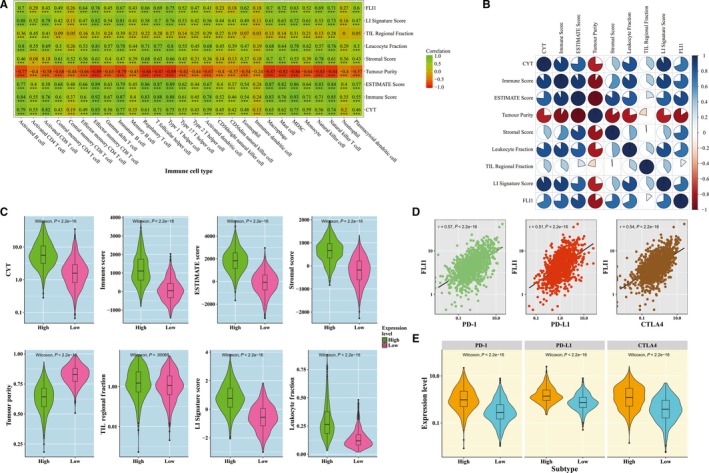
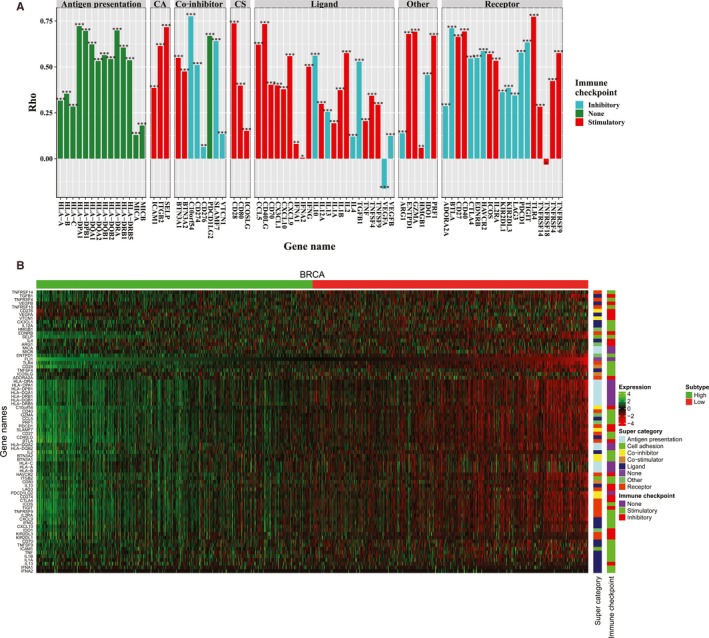
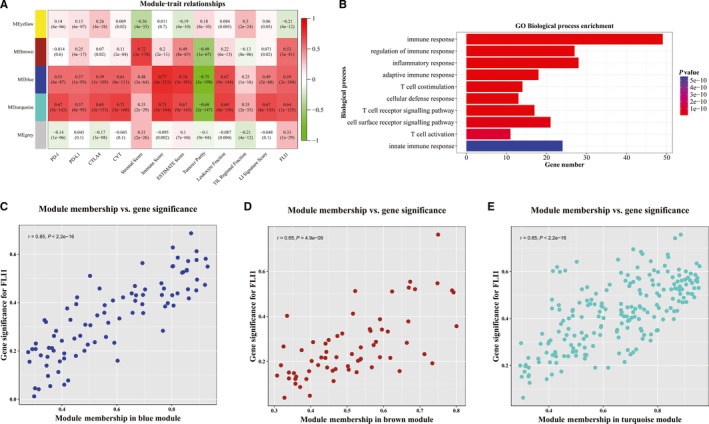
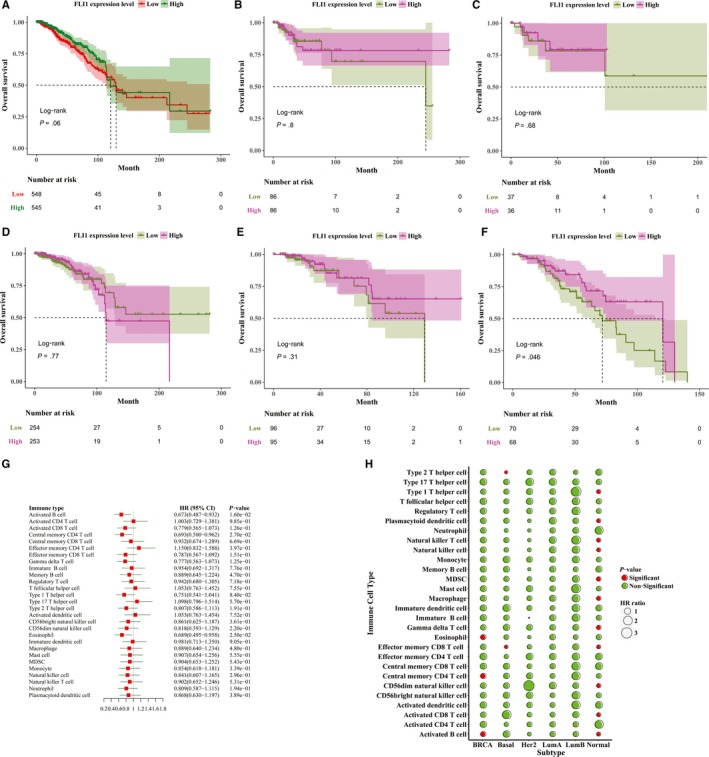
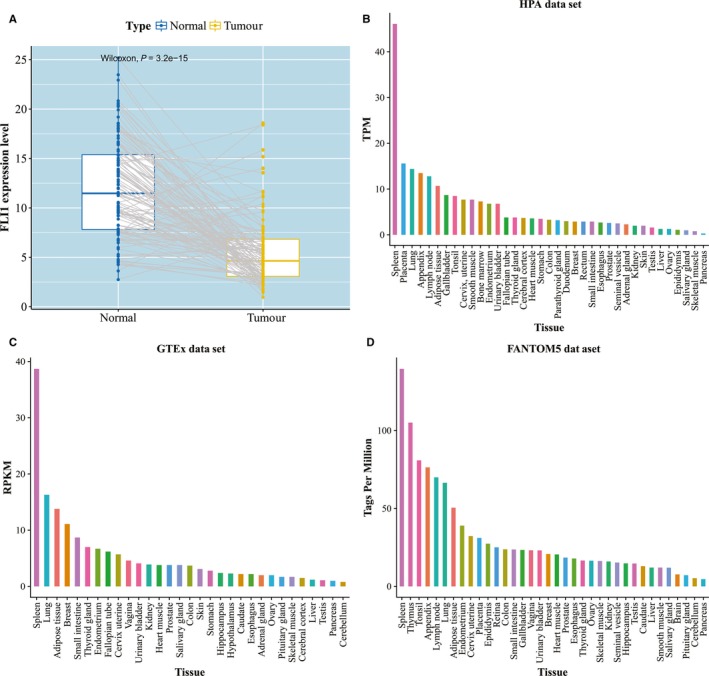
Breast cancer is the most common cancer and the leading cause of cancer death among women in the world. Tumour-infiltrating lymphocytes were defined as the white blood cells left in the vasculature and localized in tumours. Recently, tumour-infiltrating lymphocytes were found to be associated with good prognosis and response to immunotherapy in tumours. In this study, to examine the influence of FLI1 in immune system in breast cancer, we interrogated the relationship between the FLI1 expression levels with infiltration levels of 28 immune cell types. By splitting the breast cancer samples into high and low expression FLI1 subtypes, we found that the high expression FLI1 subtype was enriched in many immune cell types, and the up-regulated differentially expressed genes between them were enriched in immune system processes, immune-related KEGG pathways and biological processes. In addition, many important immune-related features were found to be positively correlated with the FLI1 expression level. Furthermore, we found that the FLI1 was correlated with the immune-related genes. Our findings may provide useful help for recognizing the relationship between tumour immune microenvironment and FLI1, and may unravel clinical outcomes and immunotherapy utility for FLI1 in breast cancer.
Keywords: FLI1; breast cancer; tumour immune microenvironment; tumour-infiltrating lymphocyte.
© 2020 The Authors. Journal of Cellular and Molecular Medicine published by Foundation for Cellular and Molecular Medicine and John Wiley & Sons Ltd.
Conflict of interest statement
The authors declare no conflict of interest.
Figures
Similar articles
-
Identifying FL11 subtype by characterizing tumor immune microenvironment in prostate adenocarcinoma via Chou's 5-steps rule.Genomics. 2020 Mar;112(2):1500-1515. doi: 10.1016/j.ygeno.2019.08.021. Epub 2019 Aug 28. Genomics. 2020. PMID: 31472243
-
ATP2C2 Has Potential to Define Tumor Microenvironment in Breast Cancer.Front Immunol. 2021 Apr 14;12:657950. doi: 10.3389/fimmu.2021.657950. eCollection 2021. Front Immunol. 2021. PMID: 33936088 Free PMC article.
-
Immune gene expression profiling reveals heterogeneity in luminal breast tumors.Breast Cancer Res. 2019 Dec 19;21(1):147. doi: 10.1186/s13058-019-1218-9. Breast Cancer Res. 2019. PMID: 31856876 Free PMC article.
-
The Immune Microenvironment in Breast Carcinoma: Predictive and Prognostic Role in the Neoadjuvant Setting.Pathobiology. 2020;87(2):61-74. doi: 10.1159/000504055. Epub 2019 Nov 12. Pathobiology. 2020. PMID: 31715606 Review.
-
Tumor-infiltrating immune cells state-implications for various breast cancer subtypes.Front Immunol. 2025 May 14;16:1550003. doi: 10.3389/fimmu.2025.1550003. eCollection 2025. Front Immunol. 2025. PMID: 40438111 Free PMC article. Review.
Cited by
-
Identification of Mir-182-3p/FLI-1 Axis as a Key Signaling in Immune Response in Cervical Cancer: A Comprehensive Bioinformatic Analysis.Int J Mol Sci. 2023 Mar 23;24(7):6032. doi: 10.3390/ijms24076032. Int J Mol Sci. 2023. PMID: 37047006 Free PMC article.
-
Integrated analysis reveals FLI1 regulates the tumor immune microenvironment via its cell-type-specific expression and transcriptional regulation of distinct target genes of immune cells in breast cancer.BMC Genomics. 2024 Mar 6;25(1):250. doi: 10.1186/s12864-024-10174-9. BMC Genomics. 2024. PMID: 38448802 Free PMC article.
-
Preeclampsia: Cardiotonic Steroids, Fibrosis, Fli1 and Hint to Carcinogenesis.Int J Mol Sci. 2021 Feb 16;22(4):1941. doi: 10.3390/ijms22041941. Int J Mol Sci. 2021. PMID: 33669287 Free PMC article. Review.
-
Tumor-Associated Macrophages: Critical Players in Drug Resistance of Breast Cancer.Front Immunol. 2021 Dec 17;12:799428. doi: 10.3389/fimmu.2021.799428. eCollection 2021. Front Immunol. 2021. PMID: 34992609 Free PMC article. Review.
-
MRPL13 Promotes Tumor Cell Proliferation, Migration and EMT Process in Breast Cancer Through the PI3K-AKT-mTOR Pathway.Cancer Manag Res. 2021 Feb 25;13:2009-2024. doi: 10.2147/CMAR.S296038. eCollection 2021. Cancer Manag Res. 2021. PMID: 33658859 Free PMC article.
References
Publication types
MeSH terms
Substances
LinkOut - more resources
Full Text Sources
Medical
