

Multiple recombinant events in human T-cell Leukemia virus Type 1: complete sequences of recombinant African strains
- PMID: 32249692
- PMCID: PMC7269087
- DOI: 10.1080/22221751.2020.1752117
Multiple recombinant events in human T-cell Leukemia virus Type 1: complete sequences of recombinant African strains
Abstract
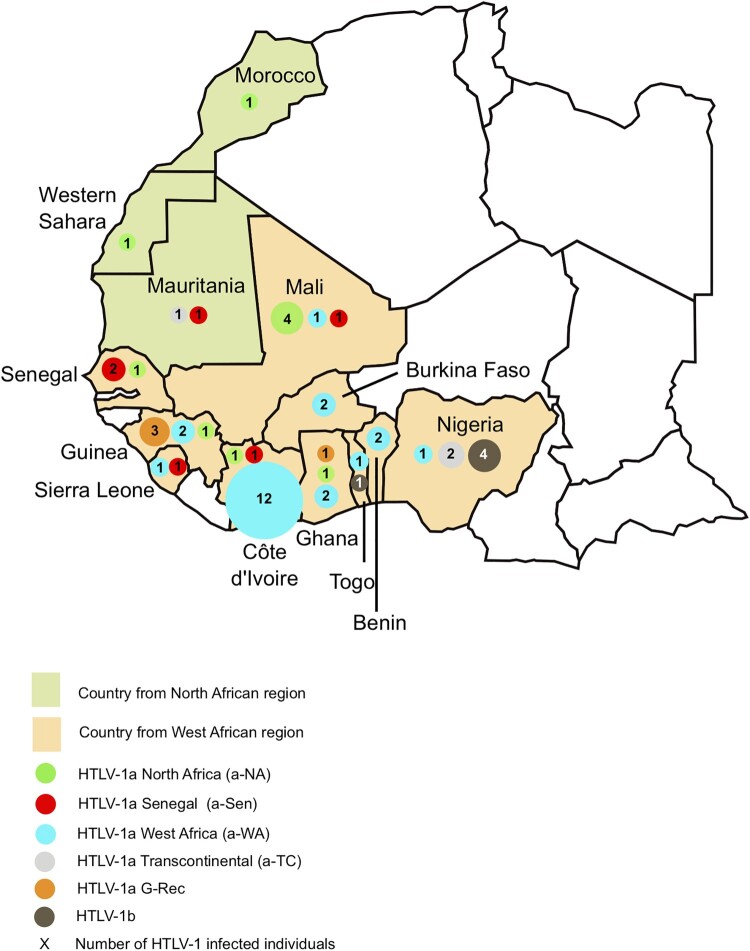
Africa is the largest endemic area for HTLV-1, with many molecular genotypes. We previously demonstrated that some strains from North Africa (a-NA clade) originated from a recombinant event between Senegalese and West African strains. A series of 52 new HTLV-1 strains from 13 North and West African countries were sequenced in the LTR region and/or a env gene fragment. Four samples from French Guyanese of African origin were also added. Furthermore, 7 complete sequences from different genotypes were characterized. Phylogenetic analyses showed that most of the new African strains belong to the Cosmopolitan a-genotype. Ten new strains from the a-NA clade were found in Morocco, Western Sahara, Mali, Guinea, Côte d'Ivoire and Ghana. A new a-G-Rec clade, which arose from a distinct recombination event between Senegalese and West African strains, was identified in Guinea and Ghana. The complete sequences suggest that recombination occur in the LTR as well as the env/pol region of the genome, thus a-NA and a-G-Rec strains have a mosaic profile with genetic segments from either a-WA or a-Sen strains. Our work demonstrates that recombination in HTLV-1 may not be as rare an event as previously proposed.
Keywords: Africa; HTLV-1; HTLV-1 complete genome; molecular epidemiology; recombination; reverse transcription.
Conflict of interest statement
No potential conflict of interest was reported by the author(s).
Figures


Similar articles
-
Molecular epidemiology of 58 new African human T-cell leukemia virus type 1 (HTLV-1) strains: identification of a new and distinct HTLV-1 molecular subtype in Central Africa and in Pygmies.J Virol. 1997 Feb;71(2):1317-33. doi: 10.1128/JVI.71.2.1317-1333.1997. J Virol. 1997. PMID: 8995656 Free PMC article.
-
Phylogenetic classification of human T cell leukaemia/lymphoma virus type I genotypes in five major molecular and geographical subtypes.J Gen Virol. 1994 Dec;75 ( Pt 12):3655-66. doi: 10.1099/0022-1317-75-12-3655. J Gen Virol. 1994. PMID: 7996161
-
Northern African strains of human T-lymphotropic virus type 1 arose from a recombination event.J Virol. 2014 Sep 1;88(17):9782-8. doi: 10.1128/JVI.01591-14. Epub 2014 Jun 18. J Virol. 2014. PMID: 24942582 Free PMC article.
-
Molecular epidemiology, genetic variability and evolution of HTLV-1 with special emphasis on African genotypes.Retrovirology. 2019 Dec 16;16(1):39. doi: 10.1186/s12977-019-0504-z. Retrovirology. 2019. PMID: 31842895 Free PMC article. Review.
-
Genetic variability and molecular epidemiology of human and simian T cell leukemia/lymphoma virus type I.J Acquir Immune Defic Syndr Hum Retrovirol. 1996;13 Suppl 1:S132-45. doi: 10.1097/00042560-199600001-00022. J Acquir Immune Defic Syndr Hum Retrovirol. 1996. PMID: 8797716 Review.
Cited by
-
Epidemiology and Genetic Variability of HHV-8/KSHV among Rural Populations and Kaposi's Sarcoma Patients in Gabon, Central Africa. Review of the Geographical Distribution of HHV-8 K1 Genotypes in Africa.Viruses. 2021 Jan 25;13(2):175. doi: 10.3390/v13020175. Viruses. 2021. PMID: 33503816 Free PMC article.
-
Role of the CTCF binding site in Human T-Cell Leukemia Virus-1 pathogenesis.PLoS Pathog. 2025 Jun 3;21(6):e1012293. doi: 10.1371/journal.ppat.1012293. eCollection 2025 Jun. PLoS Pathog. 2025. PMID: 40460345 Free PMC article.
-
The transcriptome of HTLV-1-infected primary cells following reactivation reveals changes to host gene expression central to the proviral life cycle.PLoS Pathog. 2023 Jul 31;19(7):e1011494. doi: 10.1371/journal.ppat.1011494. eCollection 2023 Jul. PLoS Pathog. 2023. PMID: 37523412 Free PMC article.
-
Updates on the Epidemiology of the Human T-Cell Leukemia Virus Type 1 Infection in the Countries of the Eastern Mediterranean Regional Office of the World Health Organization with Special Emphasis on the Situation in Iran.Viruses. 2022 Mar 23;14(4):664. doi: 10.3390/v14040664. Viruses. 2022. PMID: 35458394 Free PMC article. Review.
-
Provirus Mutations of Human T-Lymphotropic Virus 1 and 2 (HTLV-1 and HTLV-2) in HIV-1-Coinfected Individuals.mSphere. 2020 Sep 30;5(5):e00923-20. doi: 10.1128/mSphere.00923-20. mSphere. 2020. PMID: 32999083 Free PMC article.
References
-
- Yoshida M, Seiki M, Yamaguchi K, et al. . Monoclonal integration of human T-cell leukemia provirus in all primary tumors of adult T-cell leukemia suggests causative role of human T-cell leukemia virus in the disease. Proc Natl Acad Sci U S A. 1984;81:2534–2537. doi: 10.1073/pnas.81.8.2534 - DOI - PMC - PubMed
MeSH terms
Substances
LinkOut - more resources
Full Text Sources