. 2020 Apr 6;11(1):1711.
doi: 10.1038/s41467-020-15548-7.

Organoid cultures from normal and cancer-prone human breast tissues preserve complex epithelial lineages

Affiliations

Organoid cultures from normal and cancer-prone human breast tissues preserve complex epithelial lineages

Jennifer M Rosenbluth et al. Nat Commun. .

Abstract

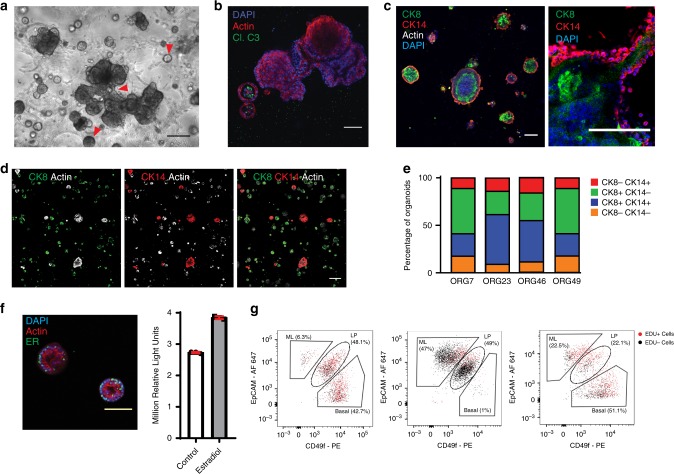
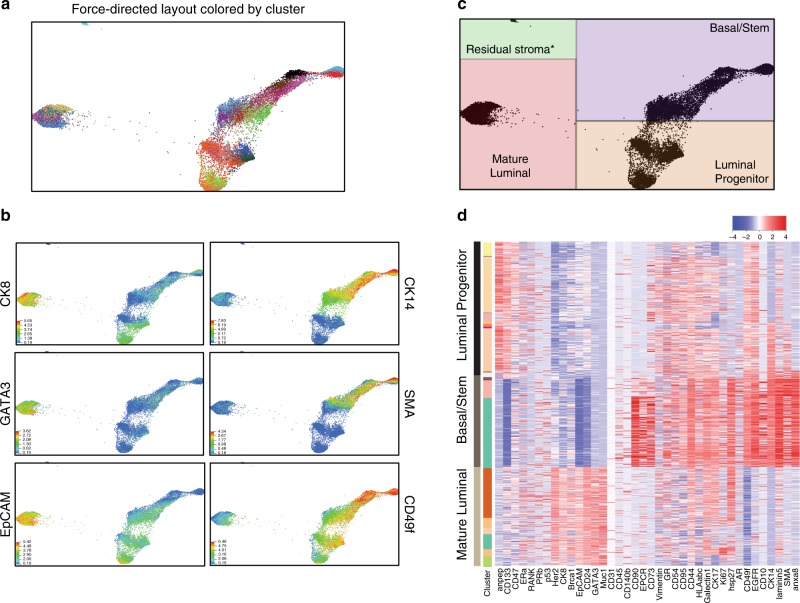
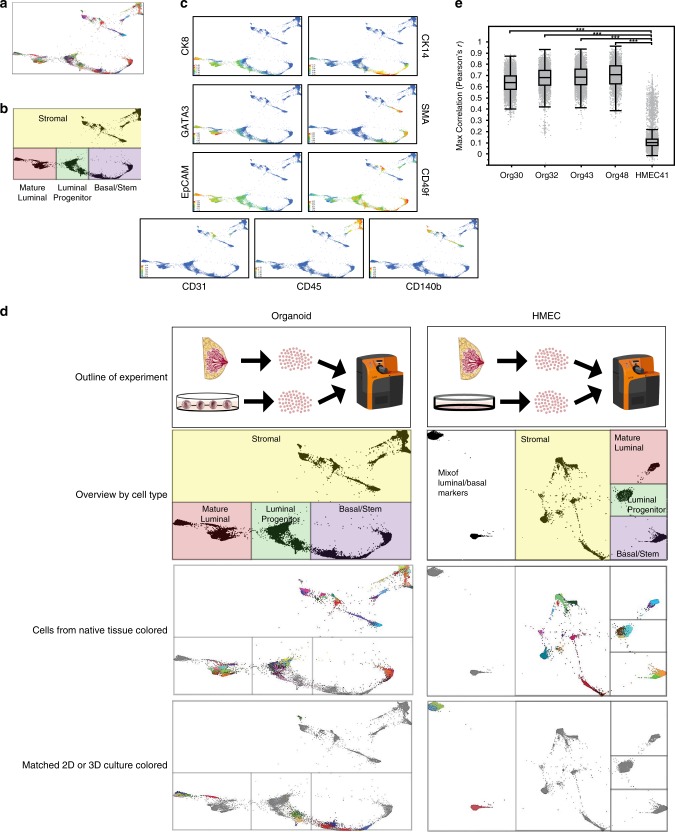
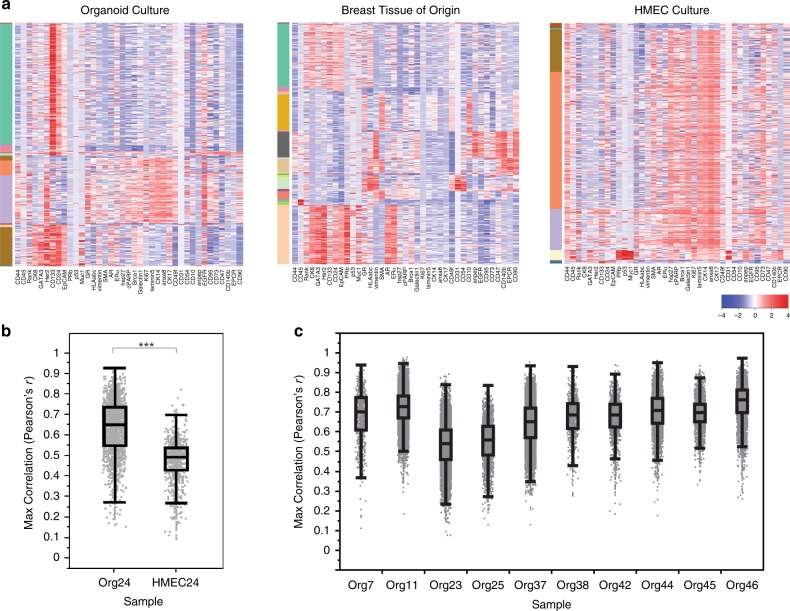
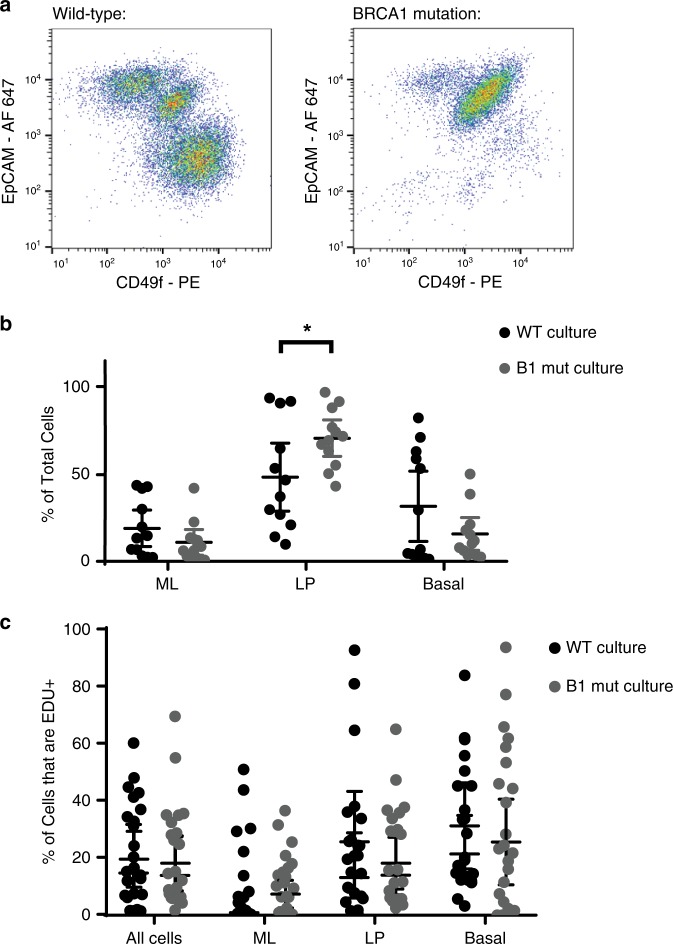
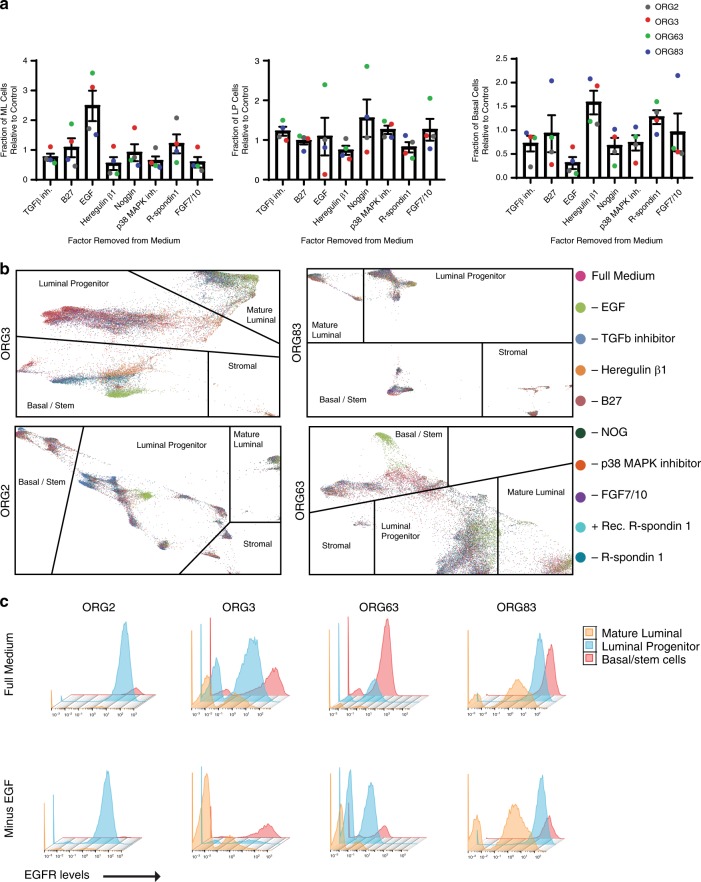
Recently, organoid technology has been used to generate a large repository of breast cancer organoids. Here we present an extensive evaluation of the ability of organoid culture technology to preserve complex stem/progenitor and differentiated cell types via long-term propagation of normal human mammary tissues. Basal/stem and luminal progenitor cells can differentiate in culture to generate mature basal and luminal cell types, including ER+ cells that have been challenging to maintain in culture. Cells associated with increased cancer risk can also be propagated. Single-cell analyses of matched organoid cultures and native tissues by mass cytometry for 38 markers provide a higher resolution representation of the multiple mammary epithelial cell types in the organoids, and demonstrate that protein expression patterns of the tissue of origin can be preserved in culture. These studies indicate that organoid cultures provide a valuable platform for studies of mammary differentiation, transformation, and breast cancer risk.


Conflict of interest statement

N.S. and H.C. declare that they are inventors on several patents related to organoid technology.

Figures

Fig. 1
Fig. 1. Human mammary epithelium can be propagated without immortalization as organoid cultures.
a Human mammary tissue was digested and cultured in BC organoid medium as previously described. A culture exhibiting multiple organoid structure types (indicated by red arrowheads, representative of n = 79) was imaged by phase contrast microscopy, scale bar = 100 µm. b, c Organoids were stained as indicated for actin (red) and cleaved caspase 3 (green) to demonstrate clearance of a lumen, or stained for CK8 (green), CK14 (red), and actin (white), and counter-stained with DAPI (blue), n = 4, scale bar = 100 µm. Organoids were imaged by confocal microscopy. d Low magnification confocal images for a representative culture are shown, n = 4, scale bar = 100 µm. e Quantification of organoids positive for CK8 and/or CK14 in each of four normal mammary cultures. f Organoids were stained for ERα (green), actin (red), and DAPI (blue) and imaged by confocal microscopy (left panel, scale bar = 100 µm). Organoids were treated with 0.5 ng/ml estradiol for 7 days, and organoid viability was assayed using Cell-Titer-Glo (right panel). Mean and standard deviation are shown (ORG9, n = 3). g Three representative organoid cultures (ORG45, ORG9, and ORG24) were stained with EpCAM and CD49f, and these markers as well as EDU incorporation were measured using flow cytometry.
Fig. 2
Fig. 2. Breast epithelial cell types form distinct structures in organoid culture.
a Bright field microscopy image of a representative organoid culture demonstrating multiple structure types, highlighted by red arrowheads. b Representative examples of organoid morphology for each of the indicated mammary cell lineages. c Cells from an organoid culture (representative of n = 9 cultures) were stained for EpCAM and CD49f, and sorted using FACS into mature luminal (ML, red), luminal progenitor (LP, orange), and basal/stem cell (BS, green) populations. Cells were recultured as organoids, and then assessed by bright field microscopy (n = 9), or confocal microscopy after staining for the indicated markers (column 1, columns 2–3, and columns 4–6 are from separate images, n = 3). Scale bars = 100 µm. d, e Cells of the indicated types were recultured after sorting for >6 weeks, then imaged by bright field microscopy in d, (representative of n = 9, scale bar = 100 µm), or analyzed for EpCAM and CD49f expression by flow cytometry in e. Cultures with luminal progenitor cells that differentiated to generate other mammary cell types were ORG7, ORG43, ORG46, ORG48, ORG49, and ORG51. ORG41, ORG42, and ORG50 had luminal progenitor cells that did not differentiate to generate other mammary cell types. f Luminal progenitor cells (EpCAM+ CD49f+) sorted from two different organoid cultures were recultured as organoids, stained for CK8 (green) or EpCAM (green), CK14 (red), and with DAPI (blue), and imaged by confocal microscopy (representative of n = 6, scale bar = 100 µm). g Cells were double-sorted for EpCAM and CD49f, then re-grown and assayed as in e.
Fig. 3
Fig. 3. Mass cytometry assessment of mammary cell subtypes in normal breast organoids.
a Force-directed layout depicting CyTOF analysis of 12 normal mammary organoid cultures. Each dot represents one cell and is colored by X-shift-defined cluster. b The expression levels of markers used to define major mammary populations are shown (warmer colors = higher expression levels). c Delineation of major mammary lineages on the force-directed layout, as determined by marker expression in b. d Heat map showing the expression levels of the indicated markers in the cells from a representative organoid culture (red = high expression, blue = low expression). The 38 markers in the CyTOF panel are shown on the x-axis, and individual cells on the y-axis are ordered based on X-shift clustering.
Fig. 4
Fig. 4. Complex mammary-specific protein expression patterns from the tissue of origin are maintained in culture.
Four normal mammary tissues were digested to single cells and fixed with paraformaldehyde. In parallel, organoid cultures were generated from each of the tissues, passaged four times, digested to single cells, and fixed. Protein expression levels of 38 markers associated with mammary tumorigenesis and development were analyzed at the single-cell level in the organoid cultures and the matched tissues of origin using cytometry by time of flight (CyTOF). a Force-directed layout of organoid cultures and matched tissues of origin, where each dot represents one cell, and the closeness in space is related to their similarity in terms of protein expression patterns. Cells are colored by X-shift-defined clusters. b Delineation of the major mammary populations on the force-directed layout based on expression of standard protein markers for these cell types. c Examples of lineage-specific markers used to determine the mammary populations shown in b, including luminal (CK8 and EpCAM), mature luminal (GATA3), and basal/stem (CK14, SMA, and CD49f), as well as stromal markers (CD31, CD45, and CD140b) (warmer colors = higher expression levels). d For comparison, a normal mammary tissue was digested to single cells and fixed, and in parallel a two-dimensional culture of human mammary epithelial cells (HMECs, cultured in Lonza MEGM) was generated and passaged two times. HMECs and the matching tissue of origin were also analyzed using CyTOF as in a. The experimental schematic, delineation of cell types on force-directed layout, and cells from the tissue or cells from the culture are highlighted in the different panels for both the organoids (left column) and the HMECs (right column). e Correlation between the protein expression profiles of each HMEC or organoid cell and expression signatures derived from the major epithelial clusters in matched primary tissue. Box plots (center line, median; box limits, upper and lower quartiles; whiskers, 1.5× interquartile range) show the maximum r value of each cell to the major epithelial clusters, stratified by sample. Statistical significance was assessed by two-sided Mann–Whitney test (***p < 2.2e−16).
Fig. 5
Fig. 5. Analysis of matched organoid culture, HMECs, and primary tissue by CyTOF.
Mammary tissue was dissociated and used to generate an organoid culture (ORG24) as well as a standard two-dimensional HMEC culture (HMEC24). Cells from the tissue was also directly fixed and frozen for future analysis. Cells from the cultures in conjunction with cells from the tissue were analyzed by CyTOF. a Heatmaps show single cells from the cultures or matched tissue as indicated, with color bar on left indicating different X-shift defined clusters. b Correlation between the protein expression profiles of HMEC or organoid cell and expression signatures derived from the major epithelial clusters in matched primary tissue. Box plots (center line, median; box limits, upper and lower quartiles; whiskers, 1.5× interquartile range) show the maximum r value of each cell to the major epithelial clusters, stratified by sample. Statistical significance was assessed by two-sided Mann–Whitney test (***p < 2.2e−16). c Correlation analysis as in b, performed for the indicated ten organoid cultures as compared with a set of four nonmatching primary breast tissues.
Fig. 6
Fig. 6. Heterogeneity is present in the distribution of mammary lineages in organoid cultures.
a The proportion of cells in the basal, luminal progenitor, and mature luminal lineages were determined using EpCAM and CD49f levels, as measured by CyTOF for each of the indicated 15 mammary organoid cultures. Samples without a known mutation in a breast cancer predisposition gene are indicated with an asterisk. All cases were normal by histology. b Force-directed layout in which each dot represents one cell that is colored by culture ID (see Supplementary Fig. 9). c Percentage of epithelial cells in each of the indicated major mammary lineages is shown for the indicated organoid cultures and matching primary tissues.
Fig. 7
Fig. 7. BRCA1-heterozygous mammary organoids have an increased proportion of luminal progenitors.
a Representative organoid cultures without (wild-type), and with a known inherited mutation in BRCA1 were digested to single cells, fixed, and stained for EpCAM and CD49f. Flow cytometry plots are shown. b Quantification of mature luminal (ML), luminal progenitor (LP), and basal/stem (Basal) populations as determined by flow cytometry assessment of EpCAM and CD49f levels are shown for 12 wild-type (WT) organoid cultures as compared with 12 cultures derived from the breast tissues of patients with an inherited mutation in BRCA1 (B1 mut). c Proliferation in the mammary cell types was measured in all 24 cultures by incubating with EDU for 16 h and measuring EDU incorporation. In b and c mean with 95% confidence interval is shown. *p = 0.037, by Student’s t test, two-tailed.
Fig. 8
Fig. 8. Distribution of mammary epithelial lineages upon removal of factors from organoid medium.
Four human mammary tissues were dissociated, and a set of ten matching organoid cultures was generated using media formulations each with removal of the indicated medium component. a Fraction of mature luminal (ML), luminal progenitor (LP), and basal cells in organoid cultures grown in medium lacking the indicated factor, as normalized to control (full medium). Mean with standard error of the mean is shown (n = four cultures). b Force-directed layouts for the four sets of organoid cultures is shown where each dot, representing a single cell, is colored based on the specific formulation of media used. c EGFR expression levels in mature luminal, luminal progenitor, and basal/stem cells is shown by histogram, as measured by CyTOF, in matched organoid cultures grown in the presence or absence of EGF as indicated.

Similar articles

Cited by

References

    1. Simian M, Bissell MJ. Organoids: a historical perspective of thinking in three dimensions. J. Cell Biol. 2017;216:31–40. doi: 10.1083/jcb.201610056. - DOI - PMC - PubMed
    1. Debnath J, Brugge JS. Modelling glandular epithelial cancers in three-dimensional cultures. Nat. Rev. Cancer. 2005;5:675–688. doi: 10.1038/nrc1695. - DOI - PubMed
    1. Stampfer MR, Yaswen P. Culture systems for study of human mammary epithelial cell proliferation, differentiation and transformation. Cancer Surv. 1993;18:7–34. - PubMed
    1. Sachs N, et al. A living biobank of breast cancer organoids captures disease heterogeneity. Cell. 2018;172:373–386 e310. doi: 10.1016/j.cell.2017.11.010. - DOI - PubMed
    1. Inman JL, Robertson C, Mott JD, Bissell MJ. Mammary gland development: cell fate specification, stem cells and the microenvironment. Development. 2015;142:1028–1042. doi: 10.1242/dev.087643. - DOI - PubMed

Publication types

MeSH terms