. 2020 Apr 6;10(1):5975.
doi: 10.1038/s41598-020-62118-4.

Models with environmental drivers offer a plausible mechanism for the rapid spread of infectious disease outbreaks in marine organisms

Affiliations

Models with environmental drivers offer a plausible mechanism for the rapid spread of infectious disease outbreaks in marine organisms

E A Aalto et al. Sci Rep. .

Abstract

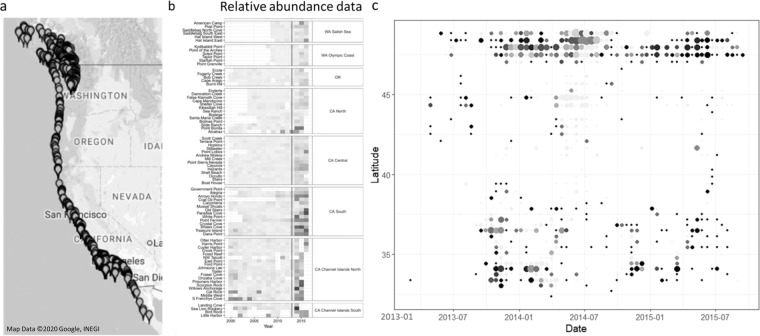
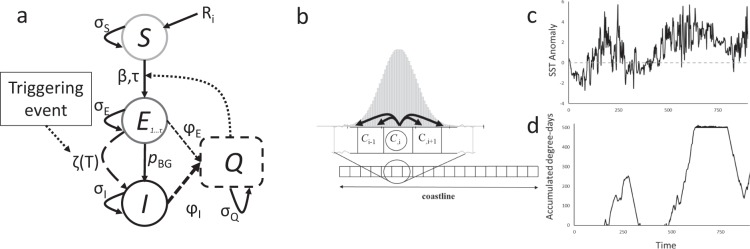
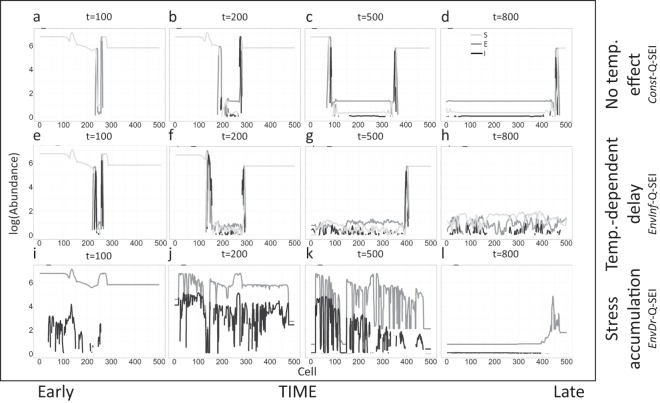
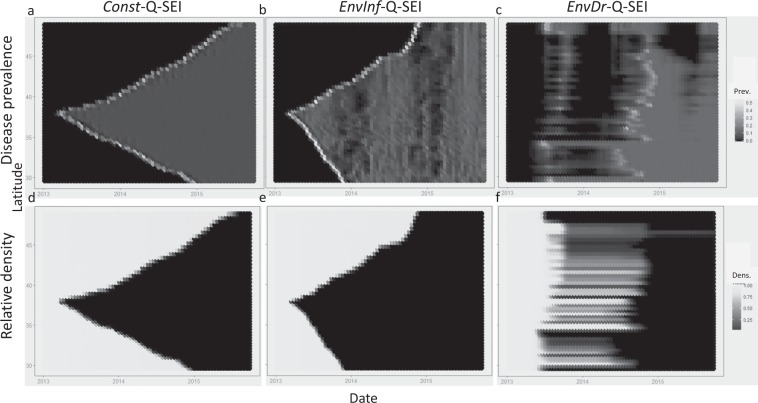
The first signs of sea star wasting disease (SSWD) epidemic occurred in just few months in 2013 along the entire North American Pacific coast. Disease dynamics did not manifest as the typical travelling wave of reaction-diffusion epidemiological model, suggesting that other environmental factors might have played some role. To help explore how external factors might trigger disease, we built a coupled oceanographic-epidemiological model and contrasted three hypotheses on the influence of temperature on disease transmission and pathogenicity. Models that linked mortality to sea surface temperature gave patterns more consistent with observed data on sea star wasting disease, which suggests that environmental stress could explain why some marine diseases seem to spread so fast and have region-wide impacts on host populations.


Conflict of interest statement

The authors declare no competing interests.

Figures

Figure 1
Figure 1
Spatial outbreak pattern for sea star wasting disease in the ochre seastar Pisaster ochraceus. All observational data were gathered via a Citizen Science sampling initiative, in combination with the Multi-Agency Rocky Intertidal Network (MARINe), and are available on www.seastarwasting.org. Observations were in the form of species-specific presence/absence data, with sampling from both long-term research sites and citizen-selected locations. (a) Survey locations along the Pacific coastline of North America. (b) Sea star density relative to pre-SSWD at multiple survey sites, with darker colors indicating greater decline (figure from Miner et al. 2018). The vertical line indicates the start of the SSWD epidemic. (c) The aggregation of survey data into 50 km × 14 day “windows”. The x-axis indicates time in days, with day 1 corresponding to January 1st, 2013, and the y-axis indicates latitude of 5 km cells, the resolution of the simulation. Proportion of “presence” surveys in each window is indicated by color, with brighter points showing a higher proportion.
Figure 2
Figure 2
(a) Within-cell model outline. Susceptible individuals (S) have constant daily recruitment Ri and survival σS and become exposed (E) τ days after interaction with disease propagules (Q) at a rate β. Exposed individuals have survival σE and transition to symptomatic individuals (I) at a constant rate pBG and/or as a function of accumulated degree days, ζ(T). Symptomatic individuals have low survival (σI ≪ σE) and produce propagules at a higher rate than exposed individuals (φI > φA). Disease propagules have a daily persistence of σQ that is not noticeably diminished by infection. (b) Dispersal of disease propagules along a linear, uniform coastline. The dispersal kernel is normal and symmetric, with absorbing boundaries at the ends of the coastline. For any specific cell and day, the mean distance of the normal kernel is determined by mean along-shore current from the ROMS model. (c) An example average daily sea surface temperature anomaly time series from roughly halfway up the coastline, 2013–2015 (cell 300 of the ROMS model), with the zero level shown as a dashed line. (d) Associated within-cell degree-day accumulation and recovery. The triggering threshold is at the top of the y-axis.
Figure 3
Figure 3
Disease spatial spread under the Const-Q-SEI (ad), EnvInf-Q-SEI (eh), and EnvDr-Q-SEI (il) models. (a) Abundance of individuals at t = 50 days under the standard Const-Q-SEI model. The x-axis indicates position along the coastline and y-axis shows log-abundance (base 10) of S (light gray lines), E (dark gray lines), and I (black lines) individuals. (b) Abundance at t = 100. (c) Abundance at t = 200. (d) Abundance at t = 400. (eh) Same as (ad), except under the EnvInf-Q-SEI model. (il) Same as (ad), except under the EnvDr-Q-SEI model.
Figure 4
Figure 4
Simulated spatial dynamics generated by the Const-Q-SEI, EnvInf-Q-SEI, and EnvDr-Q-SEI models. In the first two scenarios, the first infected individual is introduced into cell 250 at t = 20, the middle of a coastline discretized into an arbitrary n = 500 cells. For the EnvDr-Q-SEI model, the infection is pre-existing along the coastline. (a) Disease prevalence map for Const-Q-SEI model. The horizontal axis indicates time in days, the vertical one latitudinal location along the coastline. Shading indicates proportional prevalence of the symptomatic I class with darker colors representing lower prevalence. (b) Same as 4a, except for the EnvInf-Q-SEI model. (c) Same as 4a, except for the EnvDr-Q-SEI model. (d) Relative density map for the Const-Q-SEI model. Shading indicates abundance of all disease classes relative to initial pre-SSWD density, with dark colors representing low relative density. (e) Same as 4d, except for the EnvInf-Q-SEI model. (f) Same as 4d, except for the EnvDr-Q-SEI model.

References

    1. Shope M. Sea Star Wasting. Proc. Natl. Acad. Sci. USA. 2014;111:6855. doi: 10.1073/pnas.1404650111. - DOI - PMC - PubMed
    1. Denner EBM, et al. Aurantimonas coralicida gen. nov., sp. nov., the causative agent of white plague type II on Caribbean scleractinian corals. Int. J. Syst. Evol. Microbiol. 2003;53:1115–1122. doi: 10.1099/ijs.0.02359-0. - DOI - PubMed
    1. Croquer A, Pauls SM, Zubillaga AL. White plague disease outbreak in a coral reef at Los Roques National Park, Venezuela. Rev. Biol. Trop. 2003;1:39–45. - PubMed
    1. Lafferty KD, Kuris AM. Mass mortality of abalone Haliotis cracherodii on the California Channel Islands: tests of epidemiological hypotheses. Mar. Ecol. Ser. 1993;96:239. doi: 10.3354/meps096239. - DOI
    1. Lessios HA. Mass mortality of Diadema antillarum in the Caribbean: what have we learned? Annu. Rev. Ecol. Syst. 1988;19:371–393. doi: 10.1146/annurev.es.19.110188.002103. - DOI

Publication types