

Digital quantitative assessment of PD-L1 using digital spatial profiling
- PMID: 32249818
- PMCID: PMC7502436
- DOI: 10.1038/s41374-020-0424-5
Digital quantitative assessment of PD-L1 using digital spatial profiling
Abstract
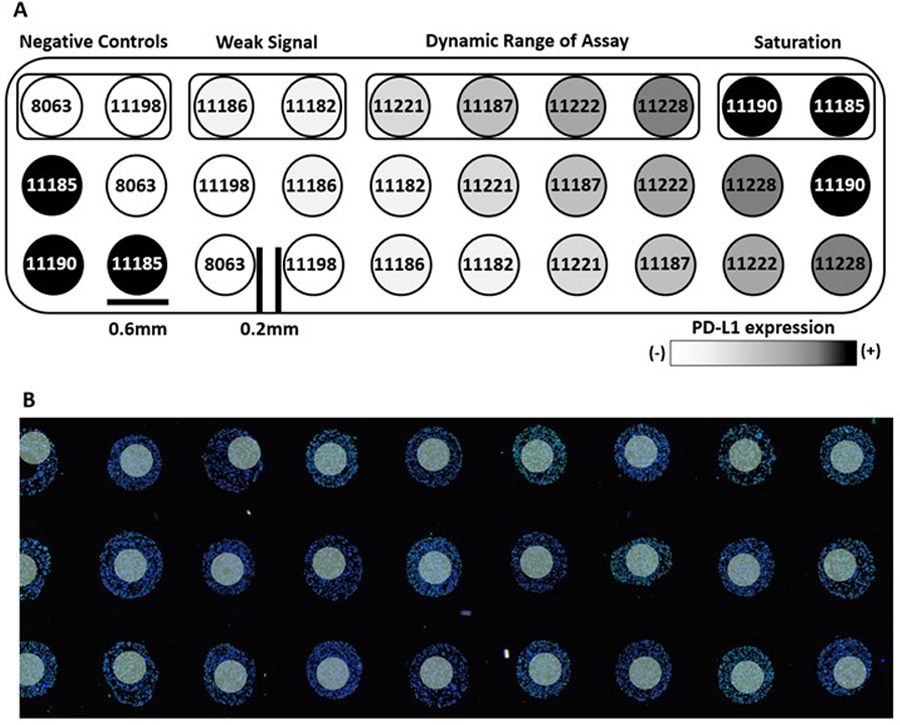
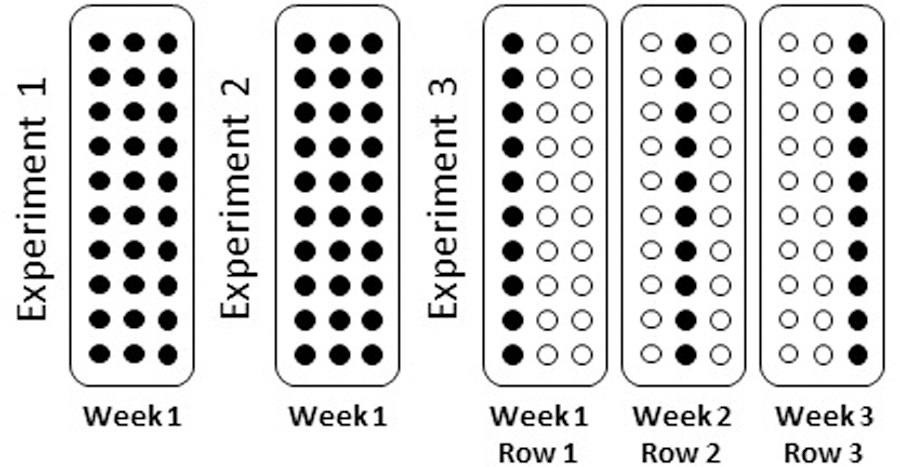
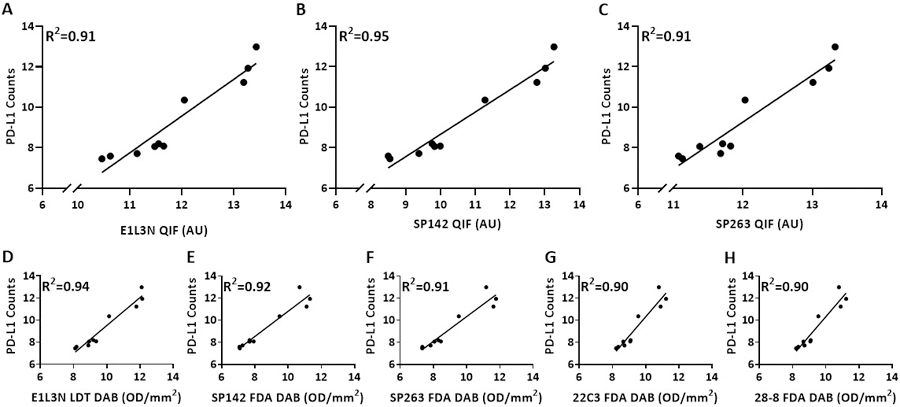
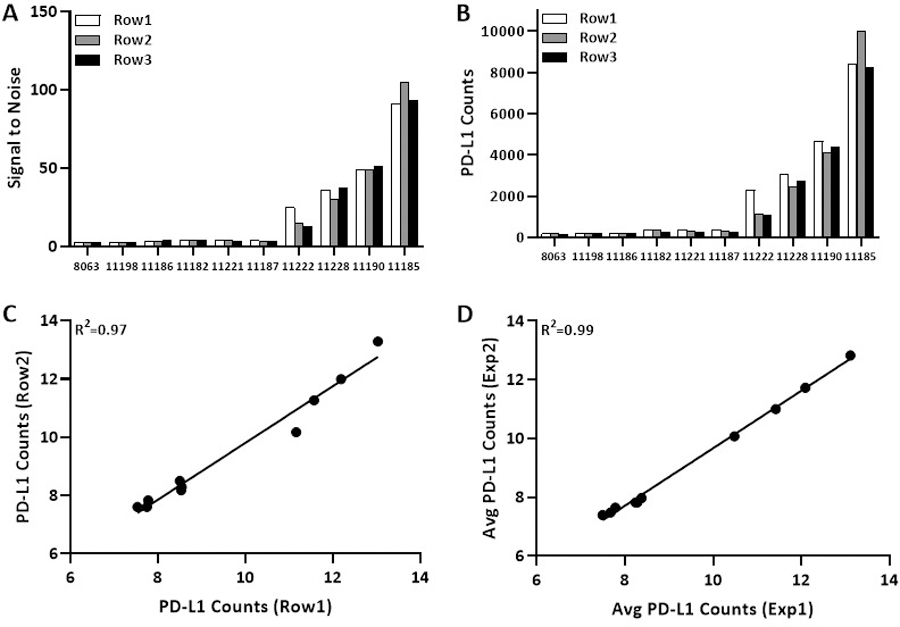
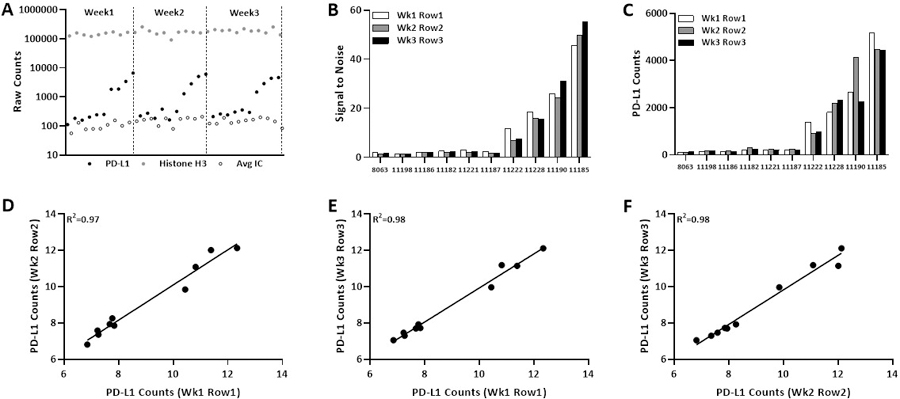
The assessment of programmed death 1 ligand 1 (PD-L1) expression by Immunohistochemistry (IHC) is the US Food and Drug Administration (FDA)-approved predictive marker to select responders to checkpoint blockade anti-PD-1/PD-L1 axis immunotherapies. Different PD-L1 immunohistochemistry (IHC) assays use different antibodies and different scoring methods in tumor cells and immune cells. Multiple studies have compared the performance of these assays with variable results. Here, we investigate an alternative method for assessment of PD-L1 using a new technology known as digital spatial profiling. We use a previously described standardization tissue microarray (TMA) to assess the accuracy of the method and compare digital spatial profiler (DSP) to each FDA-approved PD-L1 assays, one LDT assay and three quantitative fluorescence assays. The standardized cell line Index tissue microarray contains 10 isogenic cells lines in triplicates expressing various ranges of PD-L1. The dynamic range of PD-L1 digital counts was measured in the ten cell lines on the Index TMA using the GeoMx DSP assay and read on the nCounter platform. The digital method shows very high correlation with immunohistochemistry scored with quantitative software and with quantitative fluorescence. High correlation of PD-L1 digital DSP counts were seen between rows on the same Index TMA. Finally, experiments from two Index TMAs showed reproducibility of DSP counts were independent of variable slide storage time over a three-week period after antibody labeling but before collection of cleaved tags. In summary, DSP appears to have quantitative potential comparable to quantitative immunohistochemistry. It is possible that this technology could be used as a PD-L1 protein measurement system for companion diagnostic testing for immune therapy.
Conflict of interest statement
CONFLICT OF INTEREST
DLR is a consultant/advisor to Amgen, Astra Zeneca, Agendia, Biocept, Biocept, BMS, Cell Signaling Technology, Cepheid, Daiichi Sankyo, GSK, InVicro/Konica Minolta, Lilly, Merck, Perkin Elmer, PAIGE.AI, Sanofi and Ultivue. KF is an employee of Nanostring. The remaining authors declare no competing interests.
Figures
References
-
- Antonia SJ, Villegas A, Daniel D, Vicente D, Murakami S, Hui R, et al. Durvalumab after Chemoradiotherapy in Stage III Non-Small-Cell Lung Cancer. N Engl J Med 2017;377(20):1919–29. - PubMed
-
- Herbst RS, Baas P, Kim DW, Felip E, Perez-Gracia JL, Han JY, et al. Pembrolizumab versus docetaxel for previously treated, PD-L1-positive, advanced non-small-cell lung cancer (KEYNOTE-010): a randomised controlled trial. Lancet 2016;387(10027):1540–50. - PubMed
-
- Horn L, Spigel DR, Vokes EE, Holgado E, Ready N, Steins M, et al. Nivolumab Versus Docetaxel in Previously Treated Patients With Advanced Non-Small-Cell Lung Cancer: Two-Year Outcomes From Two Randomized, Open-Label, Phase III Trials (CheckMate 017 and CheckMate 057). J Clin Oncol 2017;35(35):3924–33. - PMC - PubMed
-
- McDermott DF, Sosman JA, Sznol M, Massard C, Gordon MS, Hamid O, et al. Atezolizumab, an Anti-Programmed Death-Ligand 1 Antibody, in Metastatic Renal Cell Carcinoma: Long-Term Safety, Clinical Activity, and Immune Correlates From a Phase Ia Study. J Clin Oncol 2016;34(8):833–42. - PubMed
-
- Patel SP, Kurzrock R. PD-L1 Expression as a Predictive Biomarker in Cancer Immunotherapy. Mol Cancer Ther 2015;14(4):847–56. - PubMed
Publication types
MeSH terms
Substances
Grants and funding
LinkOut - more resources
Full Text Sources
Research Materials
Miscellaneous
