. 2020 Jun 1;105(6):1906-1917.
doi: 10.1210/clinem/dgaa161.

Novel Roles of Chloroquine and Hydroxychloroquine in Graves' Orbitopathy Therapy by Targeting Orbital Fibroblasts

Affiliations

Novel Roles of Chloroquine and Hydroxychloroquine in Graves' Orbitopathy Therapy by Targeting Orbital Fibroblasts

Yan Guo et al. J Clin Endocrinol Metab. .

Abstract

Context: Graves' orbitopathy (GO) causes infiltrative exophthalmos by inducing excessive proliferation, adipogenesis, and glycosaminoglycan production in orbital fibroblasts (OFs). Interference with OF autophagy is a potential therapy for proptosis.

Objectives: Here, we aimed to evaluate the effects of chloroquine (CQ) and hydroxychloroquine (HCQ), the autophagy inhibitors commonly used in clinical practice, on OFs.

Design/setting/participants: OFs isolated from patients with GO (GO-OFs) or control individuals (non-GO-OFs) were cultured in proliferation medium (PM) or subjected to differentiation medium. OFs were treated with CQ or HCQ (0, 0.5, 2, and 10 μM), and subsequently examined in vitro.

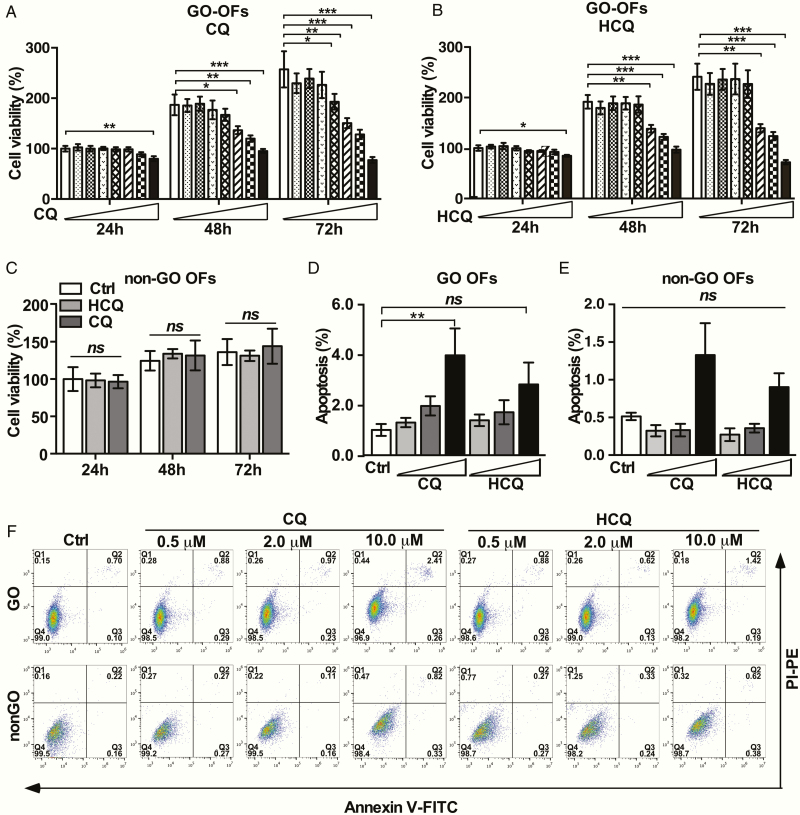
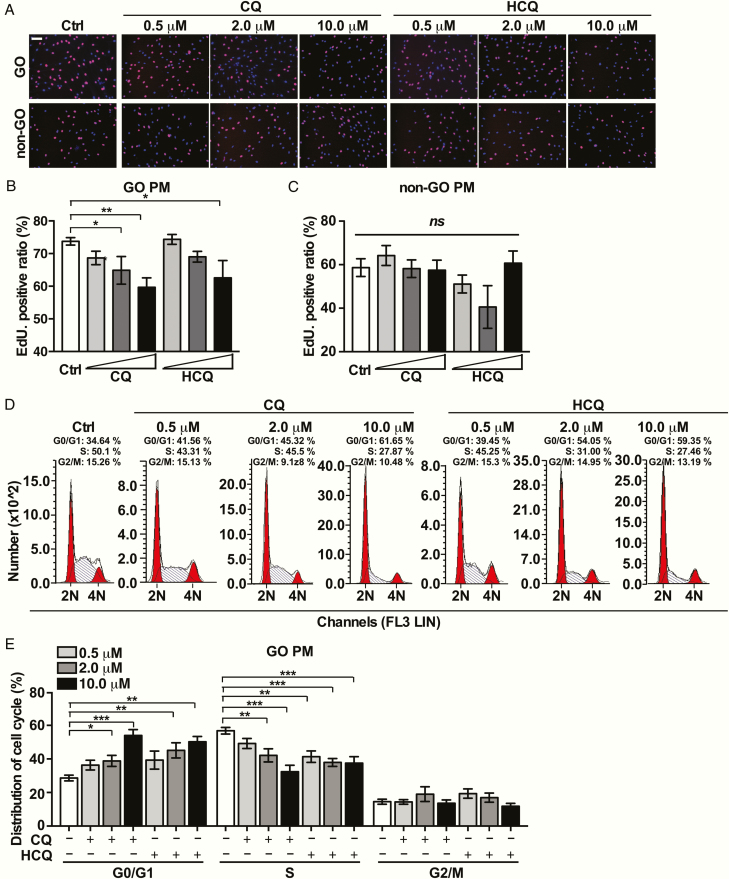
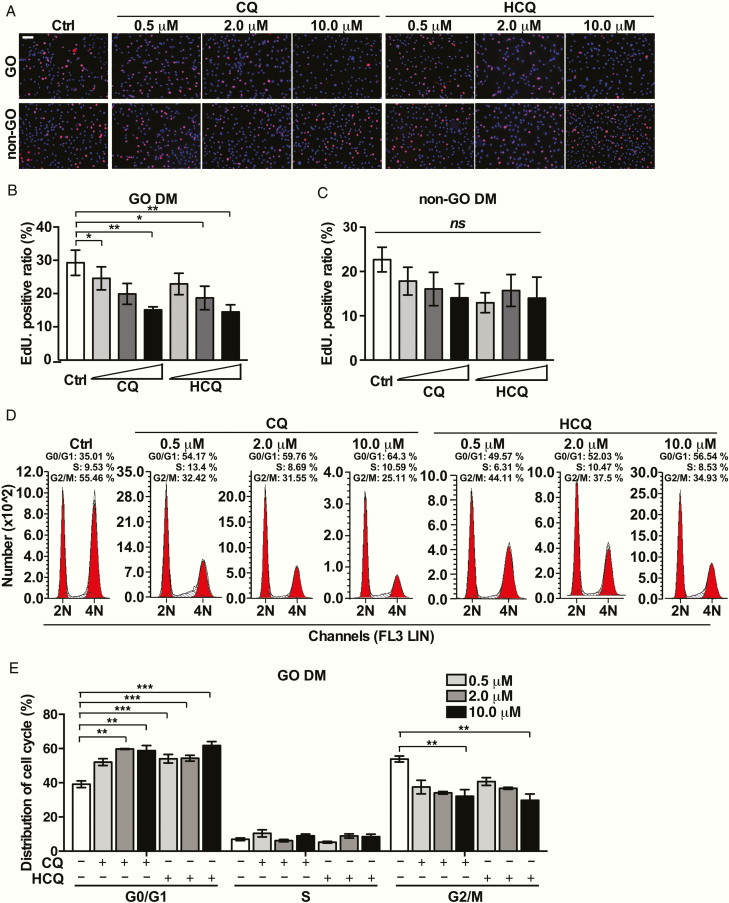
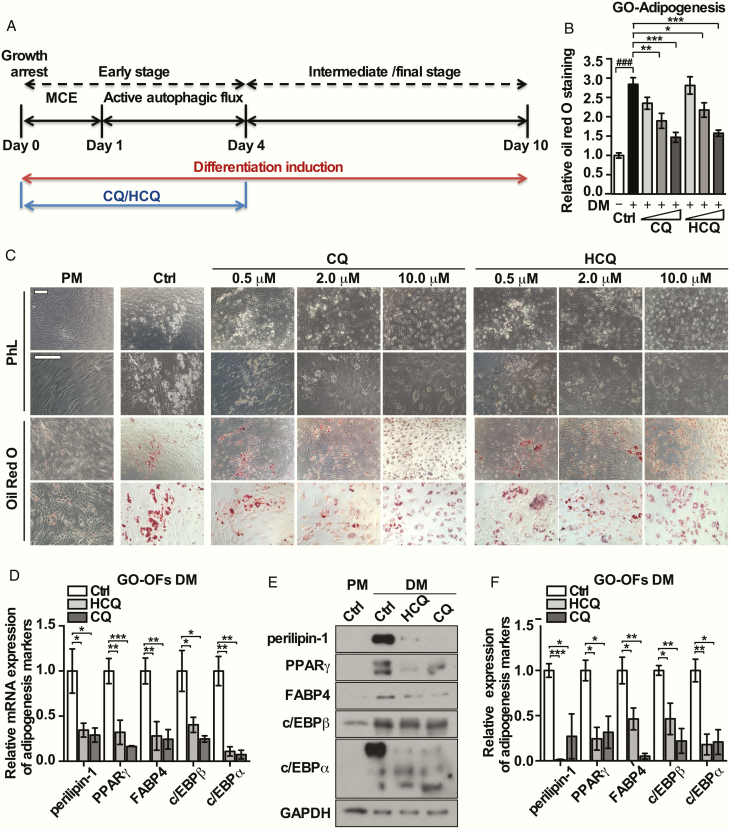
Main outcome measures: CCK-8, EdU incorporation, and flow cytometry assays were used to assess cellular viability. Adipogenesis was assessed with Western blot analysis, real-time polymerase chain reaction (PCR) , and Oil Red O staining. Hyaluronan production was determined by real-time PCR and enzyme-linked immunosorbent assay. Autophagy flux was detected through red fluorescent protein (RFP)-green fluorescent protein (GFP)-LC3 fluorescence staining and Western blot analyses.

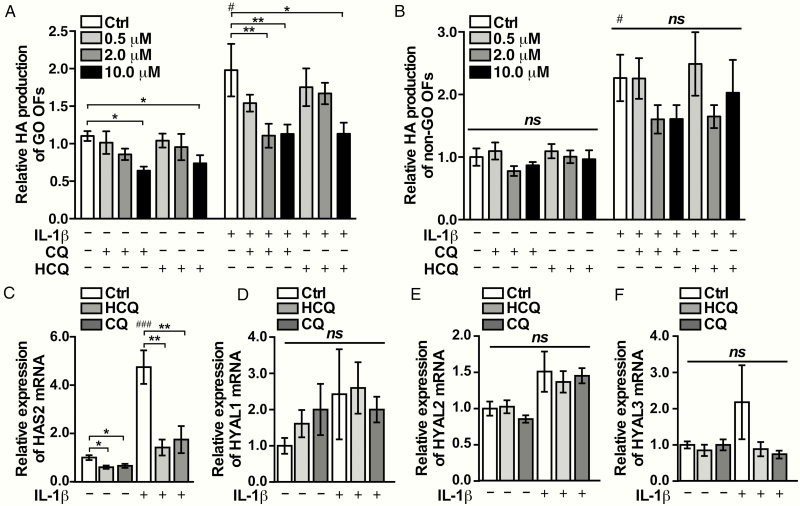
Results: CQ/HCQ halted proliferation and adipogenesis in GO-OFs in a concentration-dependent manner through blockage of autophagy, phenotypes that were not detected in non-GO-OFs. The inhibitory effect of CQ/HCQ on hyaluronan secretion of GO-OFs was also concentration dependent, mediated by downregulation of hyaluronan synthase 2 rather than hyaluronidases. Moreover, CQ (10 μM) induced GO-OF apoptosis without aggravating oxidative stress.

Conclusions: The antimalarials CQ/HCQ affect proliferation, adipogenesis, and hyaluronan generation in GO-OFs by inhibiting autophagy, providing evidence that they can be used to treat GO as autophagy inhibitors.

Keywords: Graves’ orbitopathy; adipogenesis; autophagy; chloroquine; hydroxychloroquine; orbital fibroblasts.


Figures

Figure 1.
Figure 1.
Effect of CQ and HCQ on the cellular viability of OFs from GO and non-GO cases. (A) OFs obtained from 6 GO patients were treated with increasing concentrations of CQ (0, 0.5, 1, 5, 10, 25, 50, and 100 μM) in PM for 24, 48, and 72 hours, respectively. Cell viability is presented as the percentage relative to the viability of the untreated cells. (B) OFs obtained from 6 GO patients were treated with increasing concentrations of HCQ (0, 0.5, 1, 5, 10, 25, 50, and 100 μM) in PM for 24, 48, and 72 hours, respectively. Cell viability is presented as the percentage relative to the viability of the untreated cells. (C) OFs obtained from 6 non-GO patients were treated with or without CQ and HCQ (10 μM) in PM for 24, 48, and 72 hours, respectively. Cell viability is presented as the percentage relative to the viability of the untreated cells. (D) Quantification of cell apoptosis in each GO group (Ctrl, CQ [0.5, 2,10 μM], and HCQ [0.5, 2,10 μM]) as detected by flow cytometry using AV-FITC/PI staining, n = 5. (E) Quantification about cell apoptosis in each non-GO group (Ctrl, CQ [0.5, 2,10 μM], HCQ [0.5, 2,10 μM]) as detected by flow cytometry using AV-FITC/PI staining, n = 5. (F) Experimental diagrams of cell apoptosis induced by CQ/HCQ at the indicated concentration in GO-OFs and non-GO-OFs by flow cytometry using AV-FITC/PI staining. For (A), (B), (C), (D) and (E), the bar graph data are shown as the mean ± standard error of the mean. *P < .05, **P < .01, ***P < .001, nsP ≥ .05 versus Ctrl group.
Figure 2.
Figure 2.
Effects of CQ and HCQ on the cellular proliferation of GO- and non-GO-OFs in PM. (A) Representative images of the EdU incorporation assay results in GO-OFs and non-GO-OFs treated with CQ/HCQ at the indicated concentrations in PM. The cells were observed using a fluorescence microscope, scale bars = 100 μm. Red: EdU, Blue: 4′,6-diamidino-2-phenylindole (DAPI). (B) Quantification of the EdU incorporation assay results of GO-OFs (Ctrl, CQ (0.5, 2,10 μM], HCQ [0.5, 2,10 μM]), n = 5. (C) Quantification of the EdU incorporation assay results of non-GO-OFs (Ctrl, CQ [0.5, 2,10 μM], HCQ [0.5, 2,10 μM]), n = 5. (D) Diagrams of the cell cycle of each group of GO cases in PM, as determined by flow cytometry. (E) Cartogram of cell cycle distribution of each GO-OFs group in PM, n = 5. For (B), (C), and (E), the summarized data are reported as the mean ± standard error of the mean. *P < .05, **P < .01, ***P < .001, nsP ≥ .05 versus the Ctrl group.
Figure 3.
Figure 3.
Effects of CQ and HCQ on the cellular proliferation of GO/non-GO-OFs in DM. Forty-eight hours after GO-OFs were arrested, they were stimulated by DM with or without CQ/HCQ (0.5, 2, 10 μM) before analysis. (A) Representative images of the EdU incorporation assay results for each group of GO-OFs and non-GO-OFs treated with CQ/HCQ at the indicated concentrations in DM, scale bars = 100 μm. Red: EdU, Blue: DAPI. (B) Quantification of the EdU incorporation assay results for GO-OFs (Ctrl, CQ [0.5, 2,10 μM], HCQ [0.5, 2,10 μM]), n = 5. (C) Quantification of the EdU incorporation assay results for non-GO-OFs (Ctrl, CQ [0.5, 2,10 μM], and HCQ [0.5, 2,10 μM]), n = 5. (D) Experimental diagrams of the cell cycle distribution for each group of GO-OFs in DM, as determined by flow cytometry. (E) Cartogram about cell cycle distribution for each group of GO-OFs in DM, n = 5. For (B), (C) and (E), the data are presented as the mean ± SEM. *P < .05, **P < .01, ***P < .001, nsP ≥ .05 versus the Ctrl group.
Figure 4.
Figure 4.
Effects of CQ and HCQ on adipogenesis in GO-OFs in vitro. (A) Forty-eight hours after growth was arrested in confluent GO-OFs, adipogenesis was stimulated with DM supplemented with or without CQ/HCQ (0.5, 2, 10 μM) for the indicated time periods. (B) Microscopic detection was performed to assess the characteristic morphological changes of adipogenesis associated with Oil Red O staining for each group of GO cases (PM-Ctrl, DM-Ctrl, DM-CQ [0.5, 2,10 μM] DM-HCQ [0.5, 2,10 μM]), scale bars = 200 μm. (C) Relative quantification of the Oil Red O staining for each group of GO-OFs, via detection of the OD values at 450 nm after stained cells were solubilized, n = 5. (D) After 4 days of adipogenic induction with or without CQ/HCQ (10 μM), the mRNA levels of the adipogenic markers c/EBPα/β, PPARγ, perilipin-1 and FABP4, were determined by real-time PCR, n = 5. (E) After 10 days of adipogenesis with or without CQ/HCQ (10 μM), the protein expression of the indicated adipogenesis markers in each group was assessed by Western blot analysis. (F) The protein levels were quantified, normalized to the level of GAPDH for each sample, and analyzed, n = 3. For (C), (D), and (F), the results which were derived from 3 to 5 independent GO-OF samples and are expressed as the mean ± standard error of the mean. *P < .05, **P < .01. ***P < .001 versus the Ctrl group; ###P < .001 versus the PM Ctrl group.
Figure 5.
Figure 5.
HA production in GO-OFs is downregulated by CQ or HCQ in vitro. GO-OFs cultivated in DMEM-F12 supplemented with 1% FBS, were treated with or without 1 ng/mL of IL-1β together with CQ/HCQ (0, 0.5, 2, 10 μM) for 48 hours. (A) HA secretion in each GO group was determined by ELISA, n = 5. (B) HA secretion of each group of non-GO was determined by ELISA, n = 5. (C) The mRNA levels of HAS2 in the GO cases in each group (Ctrl, CQ 10 μM, HCQ 10 μM), n = 6. (D) mRNA levels of HYAL1 of each group (Ctrl, CQ 10 μM, HCQ 10 μM) in the GO cases were shown, n = 5. (E) mRNA levels of HYAL2 in the GO cases in each group (Ctrl, CQ 10 μM, HCQ 10 μM), n = 6. (F) mRNA levels of HYAL3 in the GO cases in each group (Ctrl, CQ 10 μM, HCQ 10 μM), n = 5. The data are shown as the mean ± SEM, *P < .05, **P < .01, nsP ≥ .05 versus the Ctrl group; #P < .05, ###P < .001 versus the IL-1β negative Ctrl group.

Similar articles

Cited by

References

    1. Bartalena L, Pinchera A, Marcocci C. Management of Graves’ ophthalmopathy: reality and perspectives. Endocr Rev. 2000;21(2):168-199. - PubMed
    1. Yeatts RP. Quality of life in patients with Graves ophthalmopathy. Trans Am Ophthalmol Soc. 2005;103:368-411. - PMC - PubMed
    1. Wiersinga WM, Bartalena L. Epidemiology and prevention of Graves’ ophthalmopathy. Thyroid. 2002;12(10):855-860. - PubMed
    1. Sisti E, Coco B, Menconi F, et al. . Intravenous glucocorticoid therapy for Graves’ ophthalmopathy and acute liver damage: an epidemiological study. Eur J Endocrinol. 2015;172(3):269-276. - PubMed
    1. Tanda ML, Bartalena L. Efficacy and safety of orbital radiotherapy for graves’ orbitopathy. J Clin Endocrinol Metab. 2012;97(11):3857-3865. - PubMed

Publication types

MeSH terms