. 2020 May 1;130(5):2286-2300.
doi: 10.1172/JCI133316.

Pathogenesis of peritumoral hyperexcitability in an immunocompetent CRISPR-based glioblastoma model

Affiliations

Pathogenesis of peritumoral hyperexcitability in an immunocompetent CRISPR-based glioblastoma model

Asante Hatcher et al. J Clin Invest. .

Abstract

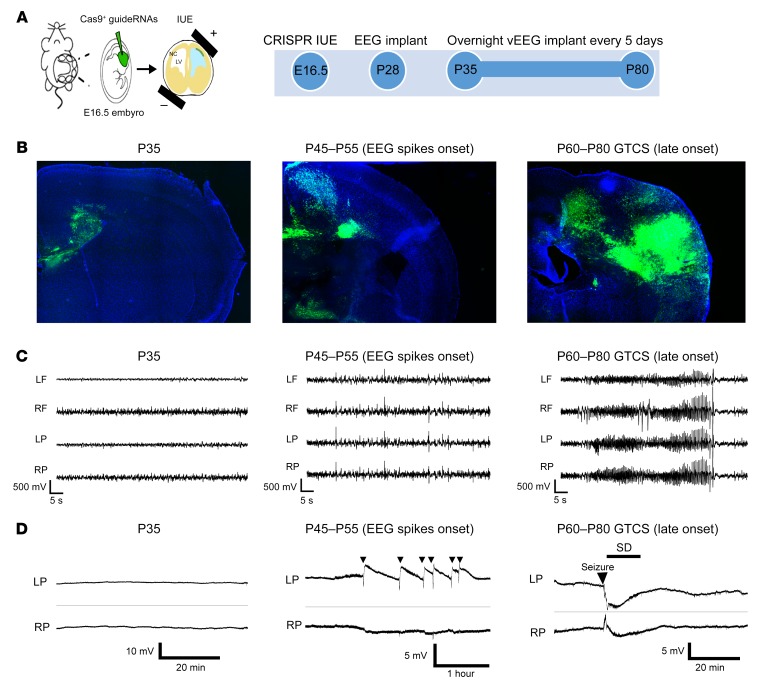
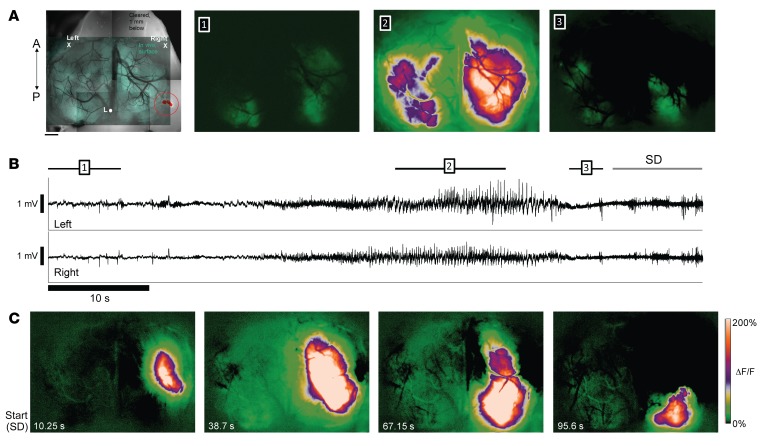
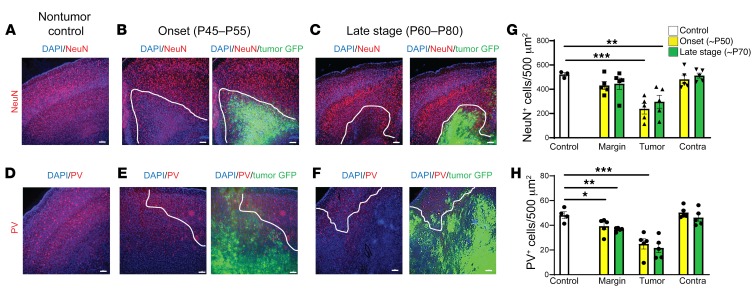
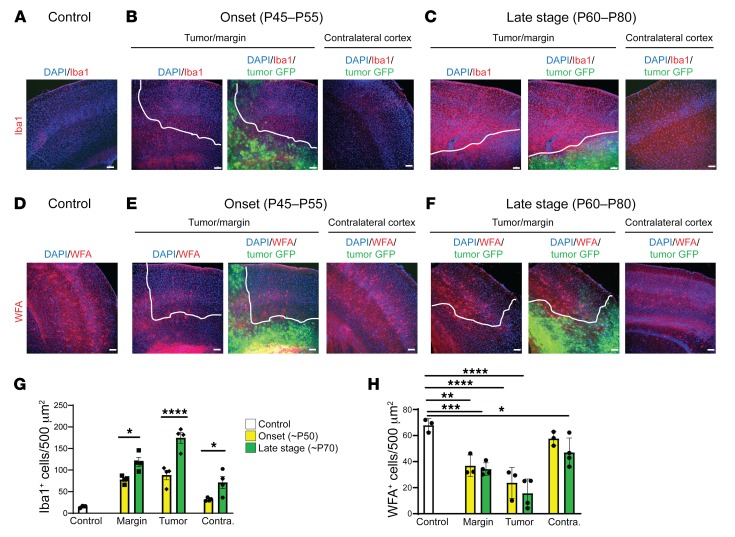
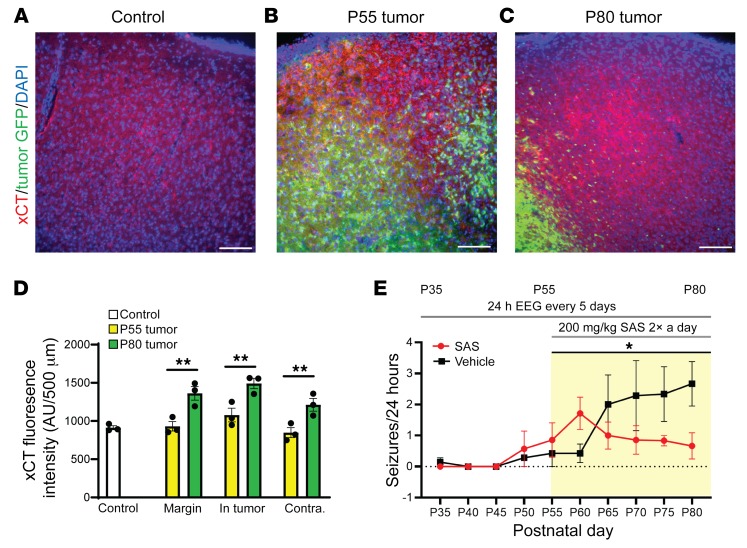
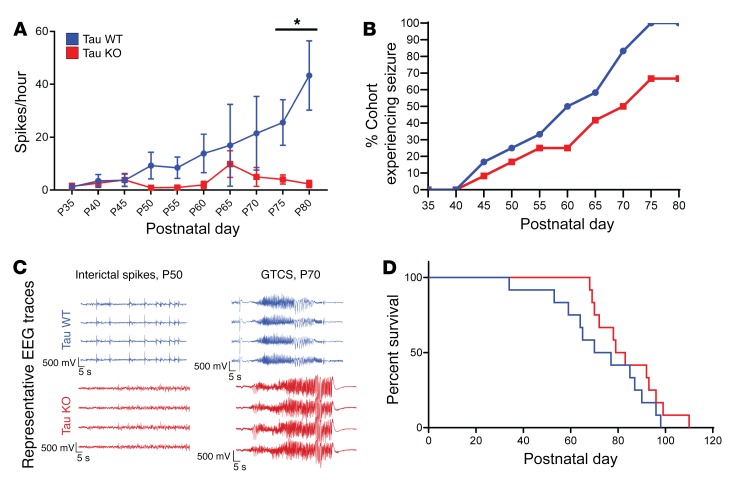
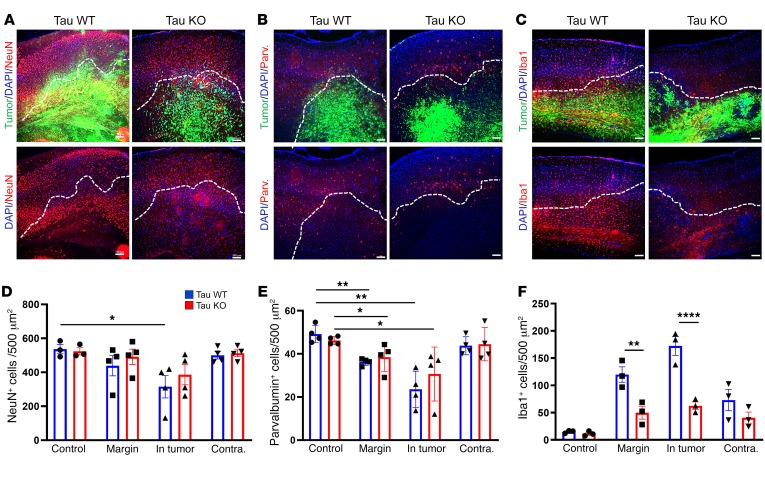
Seizures often herald the clinical appearance of gliomas or appear at later stages. Dissecting their precise evolution and cellular pathogenesis in brain malignancies could inform the development of staged therapies for these highly pharmaco-resistant epilepsies. Studies in immunodeficient xenograft models have identified local interneuron loss and excess glial glutamate release as chief contributors to network disinhibition, but how hyperexcitability in the peritumoral microenvironment evolves in an immunocompetent brain is unclear. We generated gliomas in WT mice via in utero deletion of key tumor suppressor genes and serially monitored cortical epileptogenesis during tumor infiltration with in vivo electrophysiology and GCAMP7 calcium imaging, revealing a reproducible progression from hyperexcitability to convulsive seizures. Long before seizures, coincident with loss of inhibitory cells and their protective scaffolding, gain of glial glutamate antiporter xCT expression, and reactive astrocytosis, we detected local Iba1+ microglial inflammation that intensified and later extended far beyond tumor boundaries. Hitherto unrecognized episodes of cortical spreading depolarization that arose frequently from the peritumoral region may provide a mechanism for transient neurological deficits. Early blockade of glial xCT activity inhibited later seizures, and genomic reduction of host brain excitability by deleting MapT suppressed molecular markers of epileptogenesis and seizures. Our studies confirmed xenograft tumor-driven pathobiology and revealed early and late components of tumor-related epileptogenesis in a genetically tractable, immunocompetent mouse model of glioma, allowing the complex dissection of tumor versus host pathogenic seizure mechanisms.

Keywords: Brain cancer; Epilepsy; Neurological disorders; Oncology; Therapeutics.


Conflict of interest statement

Conflict of interest: The authors have declared that no conflict of interest exists.

Figures

Figure 1
Figure 1. IUE tumor mice exhibited progressive cortical hyperexcitability and generalized tonic-clonic seizures during GBM invasion of the neocortex.
(A) Embryos were electroporated with 3 defined tumor gene variants at E16.5. Timeline shows steps in EEG monitoring protocol. GFP+ fluorescence in whole brain reveals typical end-stage brain tumor. LV, left ventricle; NC, neocortex. (B) Representative sections show GFP+ tumor growth at P35 (before onset of EEG abnormalities), P45 to P55 (onset of cortical spiking activity), and P60 to P80 (behavioral seizures, late-stage tumor). (C) Representative bilateral frontal and parietal EEG traces during tumor growth. EEG shows normal activity until P35, vigorous interictal spike activity during the early stage of tumor emergence (P45–P55), and convulsive seizures (generalized tonic-clonic) during the late stage (P60–P80). Rarely, generalized seizures occurred before P55, and spikes may emerge before P45, possibly due to asymmetric tumor invasion. GTCS, generalized tonic-clonic seizures; LF, left frontal lobe; RF, right frontal lobe; LP, left parietal lobe; RF, right parietal lobe. (D) Prolonged DC monitoring of cortical surface slow potentials revealed normal signal at P35 (left); spontaneous episodes of unilateral SD emerged at the onset of hyperexcitability and can be recurrent events (denoted by arrows; center), or occur postictally in mice experiencing generalized seizure activity (arrow, right) at late disease stage.
Figure 2
Figure 2. In vivo 1-photon imaging of epileptiform activity and SD in tumor animals.
(A) Left: Green transparent overlay: in vivo, 1-photon, widefield GCaMP7f fluorescence image of the cortical surface of a 3xCr mouse at P70 illuminated using blue light. Average of 1,000 frames (10 seconds). Left X/Right X mark locations of 2 cortical leads used to record EEG below. Reference in cerebellum. Grayscale background image shows horizontal section 1 mm below brain surface, illuminated using green light for visualization of fluorescent protein–labeled tumor cells (highlighted and circled in red). A/P arrow indicates anterior/posterior orientation. L, Lambda. Top panels 1–3: Average ΔF/F fluorescence over 10-second, 12-second, and 2-second periods of GCaMP7f fluorescence (focused at 300 μm below cortical surface), respectively. 1: Baseline calcium signal activity several seconds before generalized seizure onset (indicated by bar 1 in B). 2: Intense bilateral activation during middle portion of seizure (bar 2 in B). 3: Postictal activity before SD (bar 3 in B). (B) EEG traces simultaneously acquired during optical recording of calcium signal (top, left cortex; bottom, right cortex). Black bars above EEG traces indicate time spans corresponding to averaged image frames above (sampled at 100 Hz). (C) (Left to right) Evolution of SD wave originating in peritumoral region and moving across cortical surface. Beginning of SD event is marked by gray arrow above EEG traces in B. First panel on the left shows extent of the spreading wave at time point corresponding to the end of the gray arrow (10.25 seconds after wave first appears). Remaining 3 panels show serial snapshots of wave at 38.7, 67.15, and 95.6 seconds, respectively, as it spreads and recedes. Note that intense wave (white zone) remained confined to right hemisphere. Video of episode in Supplemental Video 1.
Figure 3
Figure 3. Tumor mice exhibited cortical cell loss at early stage of hyperexcitability before seizures were detected.
Representative images and quantification of cortical pan-neuronal (NeuN) (AC), and PV (DF) interneuron loss. White line indicates local tumor margin demarcating subcortical tumor-rich from tumor-poor cortex. Images shown without and with green fluorescent infiltrating tumor cells. (G) Compared with control animals (n = 3), NeuN neuronal expression was significantly reduced in tumor cortex at both onset (P = 0.0004, n = 5) and late-stage animals (P = 0.0052, n = 5), but loss in peritumoral regions was not significant. (H) PV+ cells were significantly reduced in peritumoral regions at both onset (P = 0.0393, n = 5), and late-stage tumor animals (P = 0.0083, n = 5). Data are presented as mean ± SEM. *P < 0.05, **P < 0.01, ***P < 0.001 by 2-way ANOVA with Tukey’s multiple-comparisons test. Scale bars: 100 μm.
Figure 4
Figure 4. Tumor mice exhibited increases in microglial activation and PNN degradation that correlated with increased hyperexcitability.
Representative images and quantification of Iba1+ microglia (AC and G) and WFA+ cells (DF and H). Dotted white line indicates local tumor margin demarcating subcortical tumor-rich from tumor-poor cortex. Images shown without and with infiltrating green fluorescent tumor cell signal. (AC and G) Relative to control brain, there was a marked increase in Iba1+ microglia at onset of hyperexcitability. This microglial invasion progressed into the late stage, where, relative to onset, Iba1+ cell number was further increased in tumor margin (P = 0.0163), GFP+ tumor (P < 0.0001), and tumor-free (P = 0.0217) regions of cortex. (DF and H) WFA labels PNNs in the CNS. Compared with controls, WFA+ cells (red) were reduced to similar levels in tumor margin (onset, P = 0.0016; late stage P = 0.0003) and tumor regions (onset and late stage, P < 0.0001). WFA+ cells were reduced in contralateral tumor-free regions of late-stage animals (P = 0.0275), but not onset animals. However, WFA+ cell number was not significantly reduced between onset and late stage in any cortical region, including tumor-free cortex, and statistical analysis subsequently did not show a significant interaction of disease time point on WFA+ cell number. n = 3 animals for all controls, n = 4 animals for onset and late-stage Iba1, n = 3 for onset WFA, n = 4 for late-stage WFA; data presented as mean ± SEM. *P < 0.05, **P < 0.01, ***P < 0.001, ****P < 0.0001 by 2-way ANOVA. Scale bars: 100 μm.
Figure 5
Figure 5. Antibody staining for xCT was increased in late-disease-stage mice, and xCT inhibitor SAS downregulated generalized seizure activity.
Representative patterns of xCT expression in coronal brain sections using specific fluorescent anti-xCT antibody. Compared with nontumor controls (A) ×20 images of xCT in control, (B) P55 tumor animals experiencing hyperexcitability, and (C) P80 tumor animals that exhibited generalized seizure activity. (D) Analysis of fluorescence intensity in xCT stained tumor brains showed that, compared with controls and with P55 tumor animals, xCT fluorescence intensity was significantly increased in peritumoral (P = 0.001), GFP-positive tumor (P = 0.002), and tumor-free regions of cortex (P = 0.006); N = 3 animals for all regions and time points. Two-way ANOVA with Tukey’s correction for multiple comparisons. (E) Blockade of xCT reduces seizures. Tumor mice were administered 200 mg/kg SAS twice daily from P55 to P80, while control animals received PBS. Seizure activity monitored in SAS-treated mice declined gradually throughout the treatment period, differing significantly from that in untreated tumor littermates (P = 0.028; PBS n = 8, SAS n = 7); mixed-effects ANOVA. *P < 0.05; **P < 0.01. Scale bars: 100 μm.
Figure 6
Figure 6. Tau deletion in host brain suppressed generalized spikes and seizures.
(A) Interictal spike and seizure activity sampled over a 17-hour period every 5 days from P35 to P80 in WT and tau-KO tumor mice. WT mice exhibited a significant increase in spike activity over the course of disease compared with tau-KO-tumor mice (P = 0.0015), 1-way ANOVA, WT n = 11, KO n = 13. (B) Comparison of generalized seizure activity in cohorts of WT and tau-KO-tumor mice. WT tumor mice showed progressive increases in seizure activity, with 100% of WT tumor mice experiencing seizure by P80 (n = 12). In contrast, tau-KO-tumor mice exhibited seizures, but the increase in seizure prevalence was slower than WT tumor animals; by P80 only 67% of tau-KO-tumor mice had had a seizure (n = 12). (C) Representative EEG of interictal spikes and seizures in tau-KO and WT mice. (D) Kaplan-Meier survival plot of WT (blue) and tau-KO-tumor (red) mice. WT median 73.5 days; n = 12. KO median 81 days; n = 12. Data are presented as mean ± SEM. *P < 0.05.
Figure 7
Figure 7. Histopathological analysis of tumoral and peritumoral regions in tau-WT- and tau-KO-tumor animals.
Representative images of (A) NeuN, (B) PV, and (C) Iba1 expression in tumor-burdened cortex of tau-WT and -KO mice. The lower images are the same as the upper, but the tumor GFP channel has been removed so that changes in expression within the tumor burden can be more easily seen. The dotted white line demarcates the tumor margin. (D) Compared with control brain, NeuN+ cell number was significantly reduced in GFP+ tumor regions of WT (P = 0.0236) but not KO animals. (E) Relative to control brain, PV+ cells were significantly reduced in peritumoral margin (WT P = 0.0014, KO P = 0.0385) and GFP+ tumor regions (WT P = 0.012, KO P = 0.0385). (F) Increase in Iba1+ cell number was significantly larger in tau-WT-tumor animals compared with tau-KO-tumor animals in both peritumoral margin (P = 0.0038) and GFP+ tumor regions (P < 0.0001). NeuN (WT and KO), control n = 3, tumor n = 4. PV (WT and KO) control and tumor n = 4. Iba1 (WT and KO) control and tumor n = 3. Data are presented as mean ± SEM. *P < 0.05; **P < 0.01; ****P < 0.0001 by 2-way ANOVA with Tukey’s multiple-comparisons test. Scale bars: 100 μm.

Comment in

References

    1. Molinaro AM, Taylor JW, Wiencke JK, Wrensch MR. Genetic and molecular epidemiology of adult diffuse glioma. Nat Rev Neurol. 2019;15(7):405–417. doi: 10.1038/s41582-019-0220-2. - DOI - PMC - PubMed
    1. Englot DJ, Chang EF, Vecht CJ. Epilepsy and brain tumors. Handb Clin Neurol. 2016;134:267–285. doi: 10.1016/B978-0-12-802997-8.00016-5. - DOI - PMC - PubMed
    1. Dührsen L, et al. Seizures as presenting symptom in patients with glioblastoma. Epilepsia. 2019;60(1):149–154. - PubMed
    1. Quail DF, Joyce JA. The microenvironmental landscape of brain tumors. Cancer Cell. 2017;31(3):326–341. doi: 10.1016/j.ccell.2017.02.009. - DOI - PMC - PubMed
    1. Jones C, et al. Pediatric high-grade glioma: biologically and clinically in need of new thinking. Neuro-oncology. 2017;19(2):153–161. - PMC - PubMed

Publication types

MeSH terms