Learner Driver Experience and Teenagers' Crash Risk During the First Year of Independent Driving
- PMID: 32250391
- PMCID: PMC7136860
- DOI: 10.1001/jamapediatrics.2020.0208
Learner Driver Experience and Teenagers' Crash Risk During the First Year of Independent Driving
Abstract
Importance: One mechanism for teenagers' elevated crash risk during independent driving may be inadequate learner driving experience.
Objective: To determine how learner driver experience was associated with crash risk during the first year of independent driving.
Design, setting, and participants: Youth aged 15.5 to 16.1 years at recruitment were eligible to participate. Participants' vehicles were instrumented with sensors, and driving was recorded during the learner period through 1 year of independent driving. Data were collected from January 2011 through August 2014 in southwestern Virginia.
Exposures: The amount, consistency and variety of practice, driving errors, and kinematic risky driving (KRD) rates during the learner period were recorded. Surveys, including one on sensation-seeking personality traits, were assessed at baseline.
Main outcomes and measures: Cox proportional hazard regressions examined associations between individual characteristics and learner driving experience with driving time to first crash and all crashes in the first year of independent driving. So that hazard ratios (HRs) can be directly comparable, units of measurement were standardized to the interquartile range.
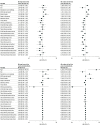
Results: Of 298 individuals who responded to recruitment, 90 fulfilled the criteria and 82 completed the study (of whom 75 were white [91%] and 44 were girls [54%]). Teenage participants drove a mean (SD) of 1259.2 (939.7) miles over 89 days during the learner period. There were 49 property-damage crashes and/or police-reportable crashes during independent driving. Factors associated with driving time to first crash included higher sensation-seeking personality scale scores (HR, 1.67 [95% CI, 1.08-2.57] per 0.75-unit increase), learner driving KRD rates (HR, 1.27 [95% CI, 1.12-1.43] per 9.24-unit increase), and learner driving errors (HR, 0.44 [95% CI, 0.22-0.86] per increase of 6.48 errors). Similar results were obtained for all crashes in the first year, with the addition of consistency of learner driving practice (HR, 0.61 [95% CI, 0.38-0.99] per 0.23-unit increase).
Conclusions and relevance: Individual characteristics and learner driving experiences were associated with crash risk during independent driving. As expected, there was an association between sensation seeking and crashes. Elevated KRD rates during the learner period may reflect risky driving behavior among novices or tolerance to abrupt maneuvers by parents who supervise driving. Consistent practice throughout the learner period could reduce teenage crash risk, which is supported by learning theories indicating distributed practice is effective for developing expertise. Errors during practice may constitute learning events that reinforce safer driving. Physicians could encourage parents to provide opportunities for regular practice driving and monitor their teenager's KRD rates during the learner period using in-vehicle or smartphone-based technology.
Conflict of interest statement
Figures


Comment in
-
Public Policies Protect Young Drivers.JAMA Pediatr. 2020 Dec 1;174(12):1215. doi: 10.1001/jamapediatrics.2020.2582. JAMA Pediatr. 2020. PMID: 33016989 No abstract available.
-
Public Policies Protect Young Drivers-Reply.JAMA Pediatr. 2020 Dec 1;174(12):1215-1216. doi: 10.1001/jamapediatrics.2020.2588. JAMA Pediatr. 2020. PMID: 33017004 No abstract available.
References
-
- Foss RD, Masten SV, Goodwin AH, O’Brien NP The role of supervised driving requirements in graduated driver licensing programs (DOT HS 811 550). Published 2012. Accessed February 28, 2020. https://www.nhtsa.gov/sites/nhtsa.dot.gov/files/811550.pdf
Publication types
MeSH terms
Grants and funding
LinkOut - more resources
Full Text Sources
Research Materials

