Review
. 2020 Jul 8:43:391-415.
doi: 10.1146/annurev-neuro-100219-105424. Epub 2020 Apr 6.

Neuromodulation of Brain State and Behavior

Affiliations
Review

Neuromodulation of Brain State and Behavior

David A McCormick et al. Annu Rev Neurosci. .

Abstract

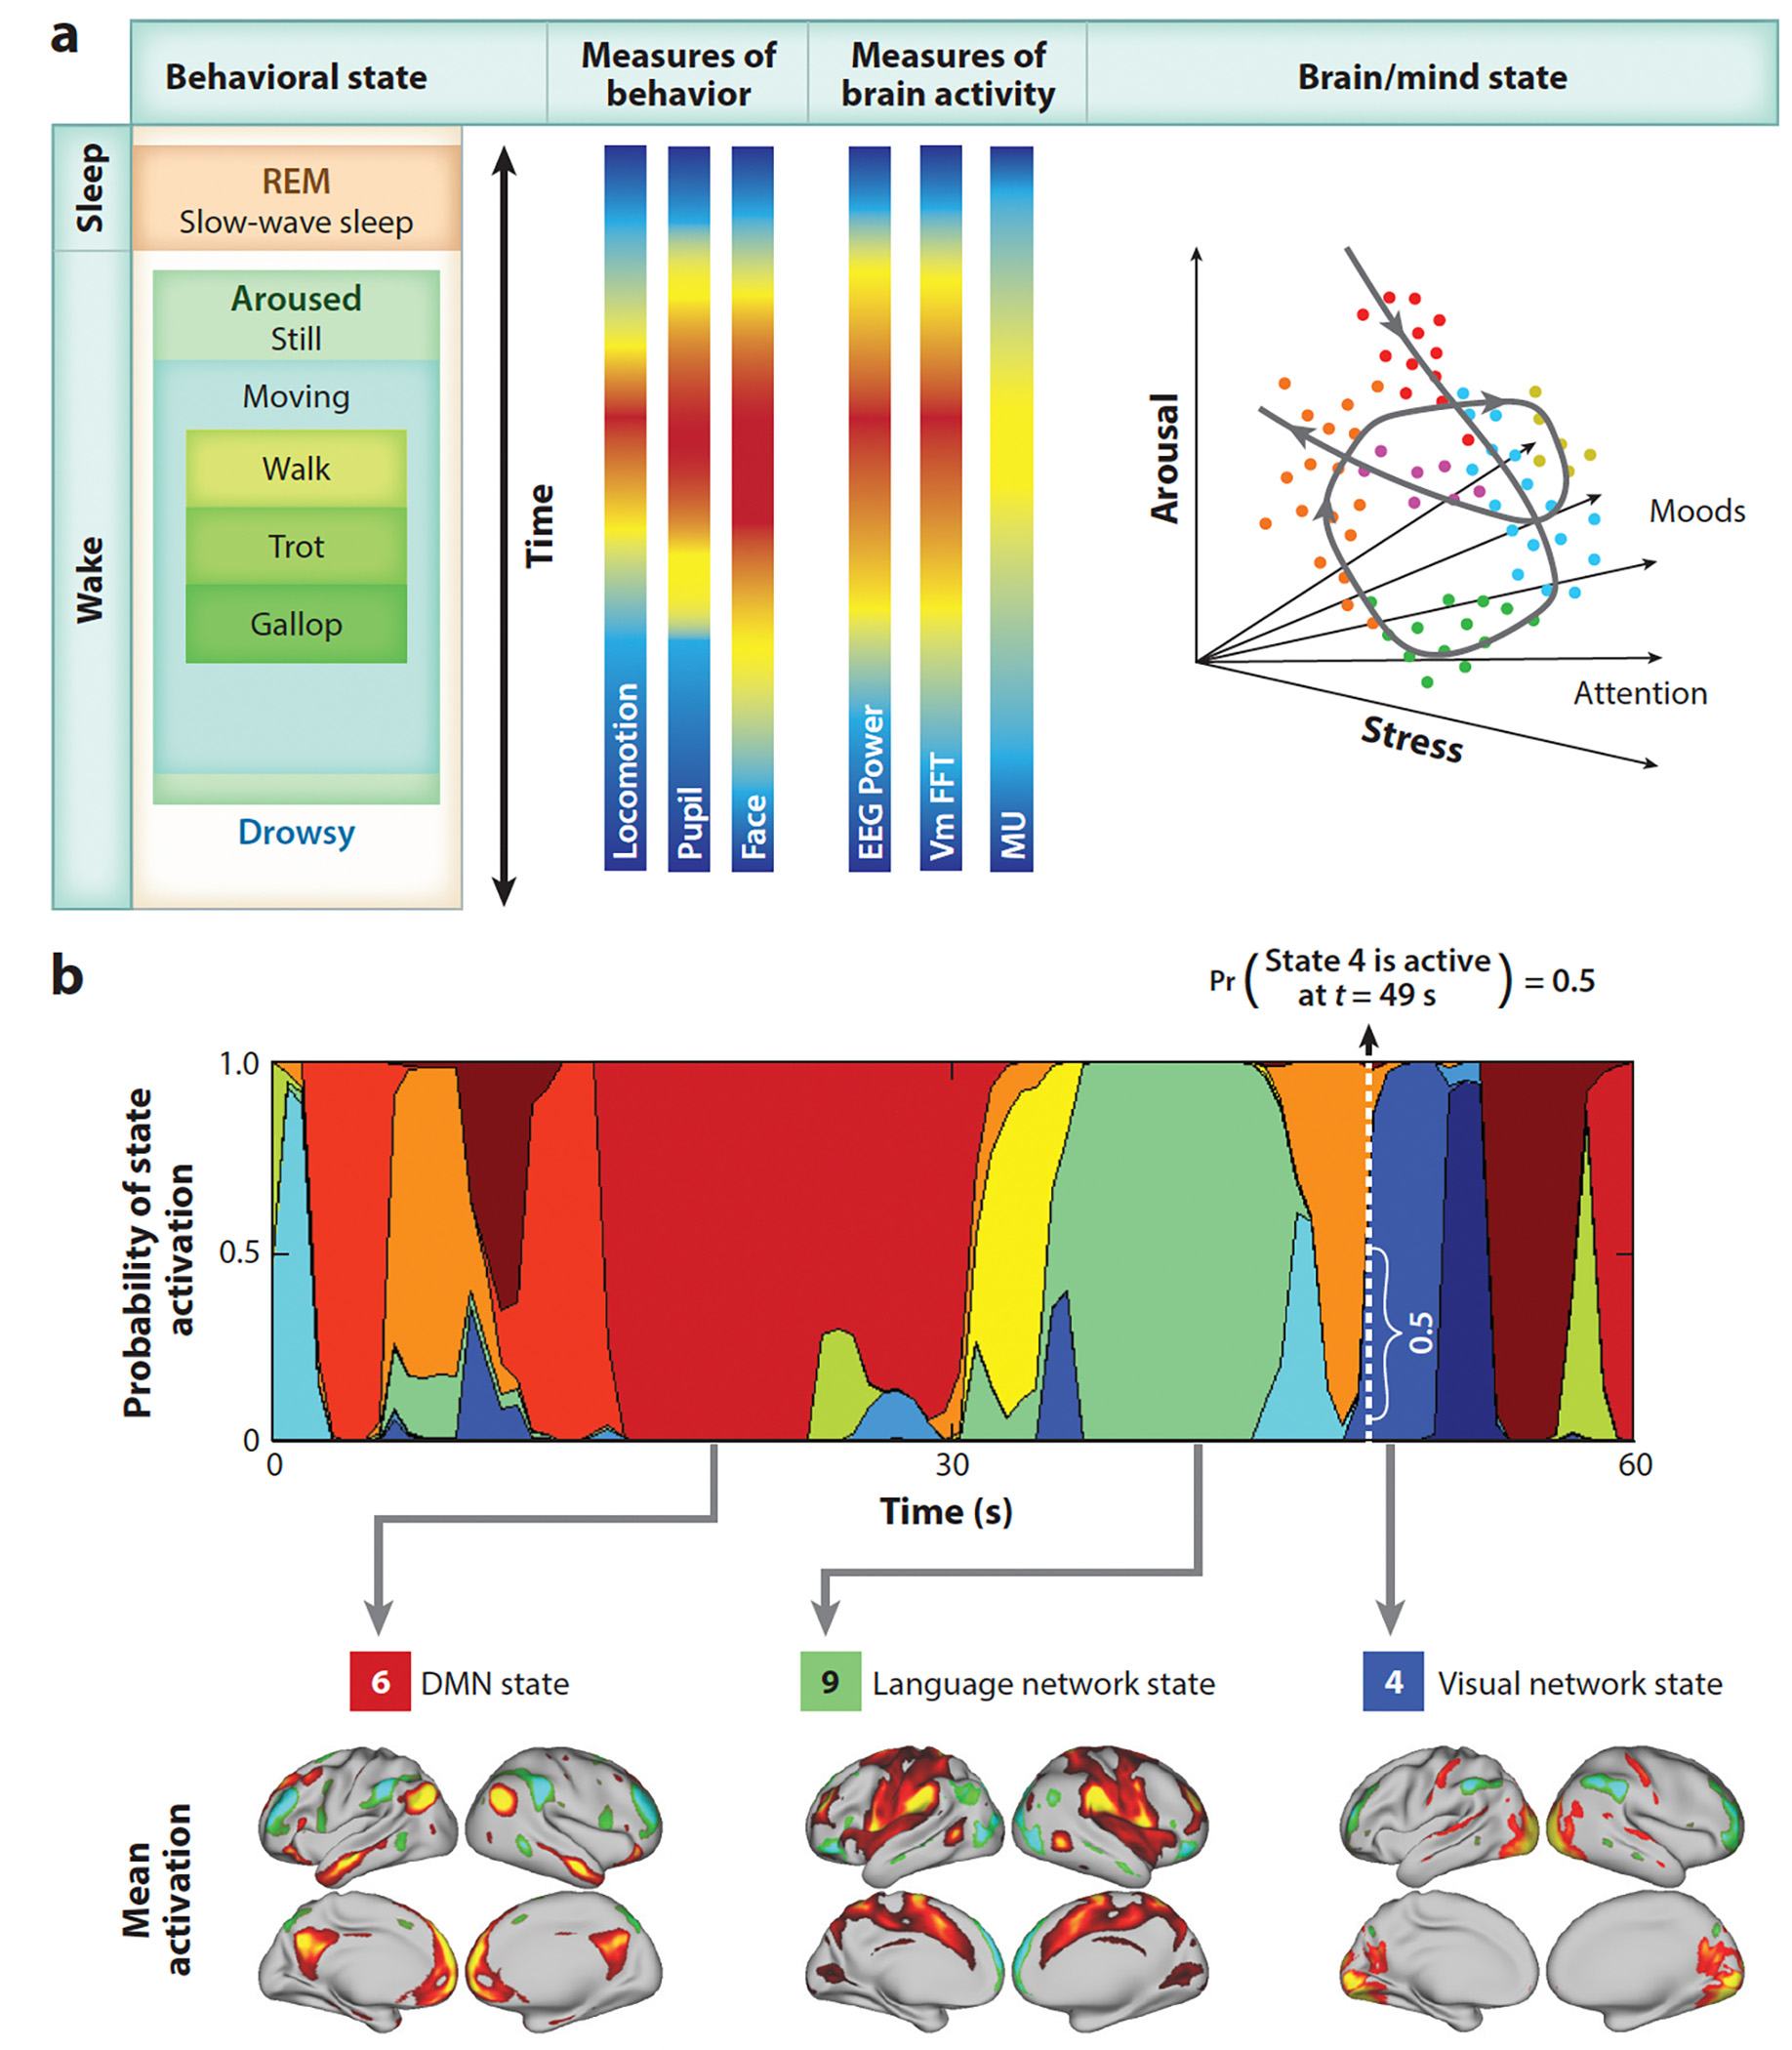
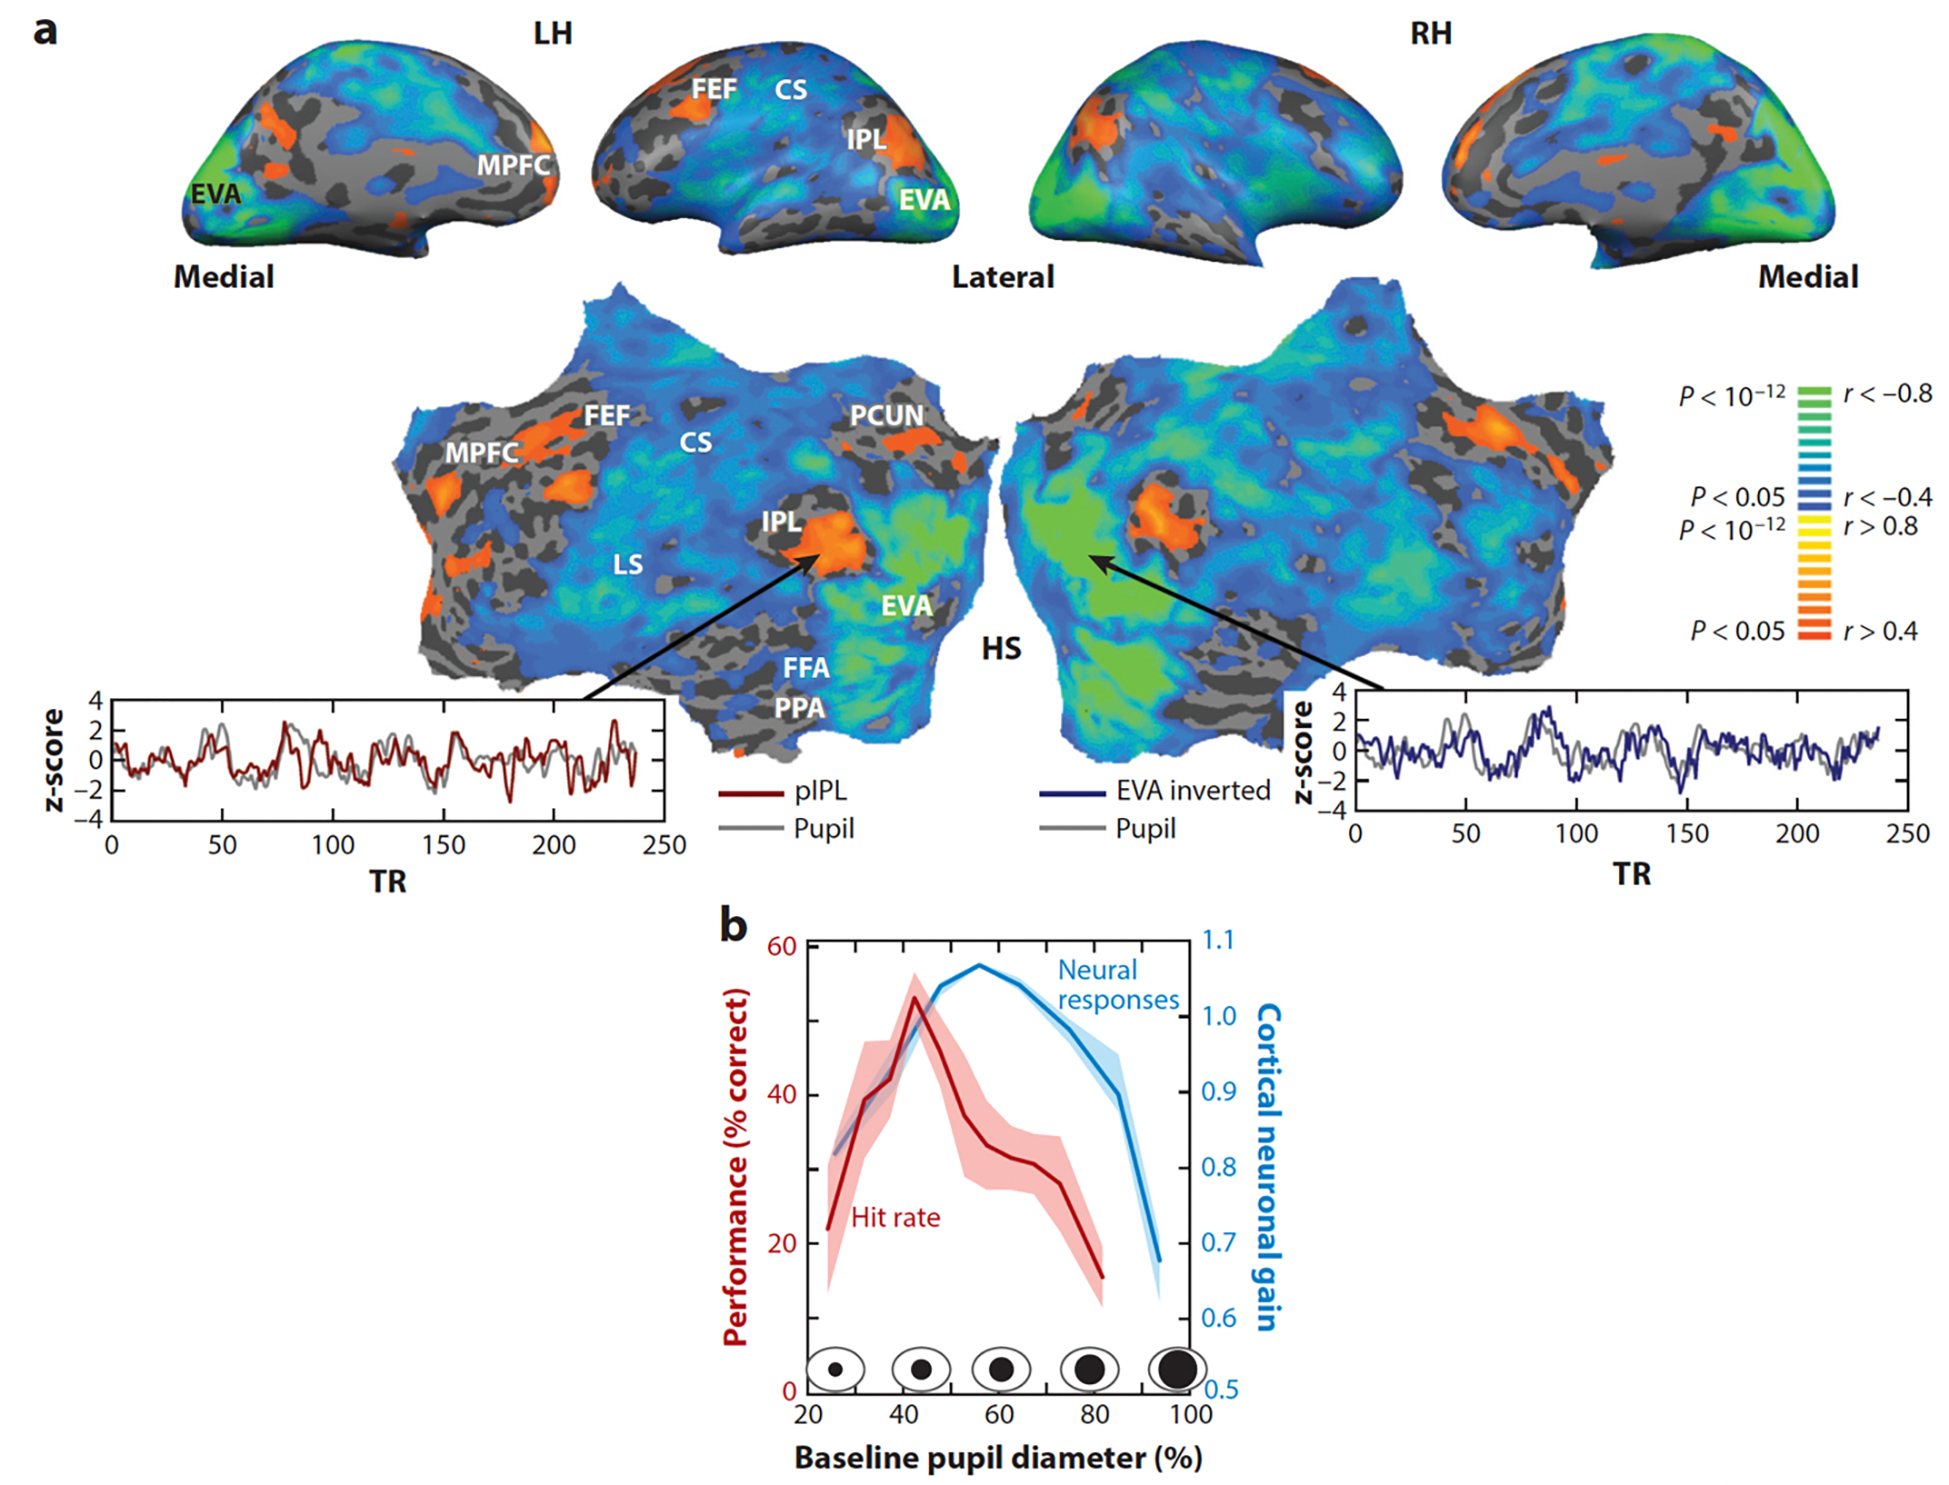
Neural activity and behavior are both notoriously variable, with responses differing widely between repeated presentation of identical stimuli or trials. Recent results in humans and animals reveal that these variations are not random in their nature, but may in fact be due in large part to rapid shifts in neural, cognitive, and behavioral states. Here we review recent advances in the understanding of rapid variations in the waking state, how variations are generated, and how they modulate neural and behavioral responses in both mice and humans. We propose that the brain has an identifiable set of states through which it wanders continuously in a nonrandom fashion, owing to the activity of both ascending modulatory and fast-acting corticocortical and subcortical-cortical neural pathways. These state variations provide the backdrop upon which the brain operates, and understanding them is critical to making progress in revealing the neural mechanisms underlying cognition and behavior.

Keywords: cerebral cortex; human; perception; performance; spontaneous activity; variability.


Figures

Figure 1
Figure 1
Behavior and brain activity move through preferred states. (a) Characterization of behavioral and brain states. Behavioral state typically consists of nested states. Sleep contains substates such as REM and slow-wave sleep. Waking can be characterized along multiple behavioral or neural dimensions, which vary rapidly or slowly over time. We hypothesize that plotting these variables in high-dimensional space would result in clouds of preferred states (colored dots) and preferred trajectories through these states. Not all states would be discrete—some states would be connected together as a continuum. (b) Brain state continuously varies in human fMRI activity. A hidden Markov model estimates a number of brain networks (or states) that are common to all subjects, together with a specific state time course for each subject indicating when each state is active. The states are characterized by their mean activation and functional connectivity matrix. (Top) Sixty-second section of the state time course for one example subject. (Bottom) Mean activation maps (projected from 50 dimensional independent component analysis space to brain space) for 3 of the 12 inferred states, along with their corresponding functional connectivity matrices. Panel b adapted from Vidaurre et al. (2017). Abbreviations: DMN, default mode network; fMRI, functional MRI; Pr, probability; REM, rapid eye movement.
Figure 2
Figure 2
Pupil diameter can be measured in both animals and humans and reveals variations in brain state. (a) Spatial topography of pupil-BOLD signal correlations in rest-fixation experiment. Single-subject correlation map, projected on an inflated (top) and unfolded cortex (bottom). Multisubject pupil-BOLD correlations on an unfolded map with random effects analysis, corrected, on 20 subjects. Note that in both maps, sensorimotor areas are negatively correlated and default mode areas are positively correlated to the pupil diameter predictor. Color scale indicates statistical significance. Yellow/orange regions represent areas for which the BOLD signal was positively correlated to the pupil predictor, whereas blue/green regions indicate negative correlations. Panel a adapted from Yellin et al. (2015). (b) Optimal performance on an auditory detection task occurs at intermediate levels of arousal in mice, as revealed by pupil diameter. Performance on the detection task varies with pupil diameter. Hit rate (red) peaked at intermediate pupil diameters, similar to the Yerkes-Dodson curve (Yerkes & Dodson 1908). Similarly, responses to sound in the auditory cortex also exhibited an inverted-U relationship with arousal. Small or large pupil diameters, indicating low or high arousal levels, were associated with nonoptimal task performance and auditory cortical responses. Panel b adapted from McGinley et al. (2015a). Abbreviations: A, anterior; CS, central sulcus; EVA, early visual cortex; IPL, inferior parietal lobule; IPS, intraparietal sulcus; LH, left hemisphere; LS, lateral sulcus; MPFC, medial prefrontal cortex; P, posterior; PCUN, precuneus; RH, right hemisphere.
Figure 3
Figure 3
Variations in human state and effects on behavior. (a) Using whole-head magnetoencephalography (MEG), two separate spontaneous processes were discovered in the 2-s time window before the onset of a brief visual stimulus: A noncontent-specific (NCS) general process indiscriminately influences visual object recognition by shifting the decision criterion regardless of the content of the stimulus. By contrast, a content-specific (CS) process influences visual object recognition of specific object categories by enhancing the recognition sensitivity (i.e., enlarging the distance between real and scrambled objects) for stimuli from a specific category. The NCS, but not CS, spontaneous process is correlated with spontaneous fluctuations in pupil size and hence is arousal linked. Panel a adapted from Podvalny et al. (2019). (b) Trajectories of MEG activity on seen trials (green lines) begin in a location distinct from those of unseen trials (red lines) for people performing a threshold-level visual perception task. The time of stimulus onset is indicated by circles, and different stimulus orientations are indicated by solid or dashed lines. For seen trials, the voyage of the trajectory through state space is characterized by a marked increase in velocity following stimulus onset, indicated by the length of black arrows. Unseen trials, on the other hand, only accelerate minimally following stimulus onset, indicated by the length of gray arrows. Seen and unseen trajectories remain well separated throughout the trial. For seen trials, across-trial variability decreases substantially following stimulus onset (green shading). Panel b adapted from Baria et al. (2017). (c) The phase of infraslow activity [infraslow electroencephalography fluctuations (ISF); gray line] recorded by electroencephalography modulates higher-frequency activity power (colored lines) and hit rate (black line) in a threshold-level somatosensory detection task in humans. Panel c adapted from Monto et al. (2008).
Figure 4
Figure 4
Pathways and mechanisms involved in rapid modulation of waking cortical state. (a) Graphic illustrating that the rapid modulation of the state of a region of cortex (b) may be influenced by other cortical areas (e.g., feedback), (c) subcortical inputs (e.g., thalamus), and (d,e) modulatory transmitter systems from the basal forebrain, hypothalamus, or brainstem. (f) Whole-cell recording of a deep-lying pyramidal cell in auditory cortex during spontaneous variations in behavioral state. During periods of small pupil diameter, the cortical network may generate slow oscillatory rhythms, presumably through intracortical mechanisms (McCormick et al. 2015). Periodically, this activity is interrupted by microarousals associated with pupil dilations and membrane potential depolarization, owing to a barrage of synaptic potentials. During a period of walking, the membrane potential depolarizes strongly, slow oscillatory activity is suppressed, and the pupil strongly dilates, indicating increased arousal. (c) The state of cortical activity can be altered through the stimulation of feedback pathways. In this whole-cell recording of a pyramidal cell in the primary somatosensory cortex, activation of the feedback pathway from the motor cortex results in a rapid depolarization and cessation of slow rhythmic activity of anesthesia. (d) Blocking thalamic inputs results in a suppression of the whisker movement–associated depolarization of somatosensory cortical pyramidal cells, although the slow oscillatory activity is still suppressed. However, if both the thalamic and cholinergic pathways are blocked, then movement no longer has these effects on rhythmic synaptic activity. Panel b adapted from McGinley et al. (2015a), panel c adapted from Zagha et al. (2013), and panel d adapted from Poulet & Crochet (2018).
Figure 5
Figure 5
Movements of the face and body and behavioral state explain a significant portion of ongoing and trial-related activity in the mouse dorsal cortex. (a) Example time course of running speed (green line), pupil area (gray line), whisking (light green line), and first principle component (PC) of spontaneous population neuronal activity (magenta dashed line) in an untrained mouse alternating between behavioral quiescence and movement. Neuronal activity is shown in the raster plots (bottom), with neurons sorted vertically by first PC weighting. (b) A ridge regression linear model was used to fit the pixel-by-pixel amplitude-time course of wide-field brain activity (e.g., panel b) in a mouse performing a visual detection task. Regressors used in the model include unitary variables such as trial type (visual, auditory, catch), intensity of visual stimulus (low or high), response choice (hit/no response/false alarm), and response time and continuous variables such as time, motion energy in the entire video, motion energy in the whisker pad only (see panel c), walking speed, eye movement amplitude, and pupil diameter. The linear model generated spatiotemporal maps of β weights for each variable (see panels f,g) and were used to predict the amplitude-time course of each pixel of the widefield movie of cortical activity. Examples of the activity (black lines) and model fit (gray lines) for averaged regions of pixels in secondary motor cortex (MOs), primary somatosensory cortex (S1), and primary visual cortex (V1) are shown. (c) Example frame from a video of the mouse face and eye during the performance of the task. The video was used to examine movements of the face [video motion energy (ME)], whisker pad (whisk ME), eye, and pupil diameter. (d) The model is able to explain a significant fraction (approximately 35–55%) of neural activity variance during performance of the task. (e) Total and unique explained variance for each parameter. Movement (video, whisk, walk, eye movement) explains a high degree of neural activity, while other variables such as arousal (pupil diameter), response choice, and timing also make significant contributions. Bars are mean +/− standard error of the mean. (f,g) Spatial maps of the β weights of the model for choice and eye movement. Note that behavioral choice peaks in MOs. The activity maps are roughly aligned to the Allen Institute Common Coordinate Framework (Oh et al. 2014) for illustrative purposes. Panel a adapted from Stringer et al. (2019), panels bg adapted from Salkoff et al. (2019).

References

    1. Anton-Erxleben K, Carrasco M. 2013. Attentional enhancement of spatial resolution: linking behavioural and neurophysiological evidence. Nat. Rev. Neurosci. 14(3):188–200 - PMC - PubMed
    1. Arazi A, Censor N, Dinstein I. 2017. Neural variability quenching predicts individual perceptual abilities. J. Neurosci. 37(1):97–109 - PMC - PubMed
    1. Arnsten AFT, Wang MJ, Paspalas CD. 2012. Neuromodulation of thought: flexibilities and vulnerabilities in prefrontal cortical network synapses. Neuron 76(1):223–39 - PMC - PubMed
    1. Aston-Jones G, Cohen JD. 2005. An integrative theory of locus coeruleus-norepinephrine function: adaptive gain and optimal performance. Annu. Rev. Neurosci. 28:403–50 - PubMed
    1. Ayaz A, Saleem AB, Schölvinck ML, Carandini M. 2013. Locomotion controls spatial integration in mouse visual cortex. Curr. Biol. 23(10):890–94 - PMC - PubMed

Publication types

LinkOut - more resources