. 2020 Mar 23;11(1):1517.
doi: 10.1038/s41467-020-15328-3.

Leptin receptor-expressing neuron Sh2b1 supports sympathetic nervous system and protects against obesity and metabolic disease

Affiliations

Leptin receptor-expressing neuron Sh2b1 supports sympathetic nervous system and protects against obesity and metabolic disease

Lin Jiang et al. Nat Commun. .

Erratum in

Abstract

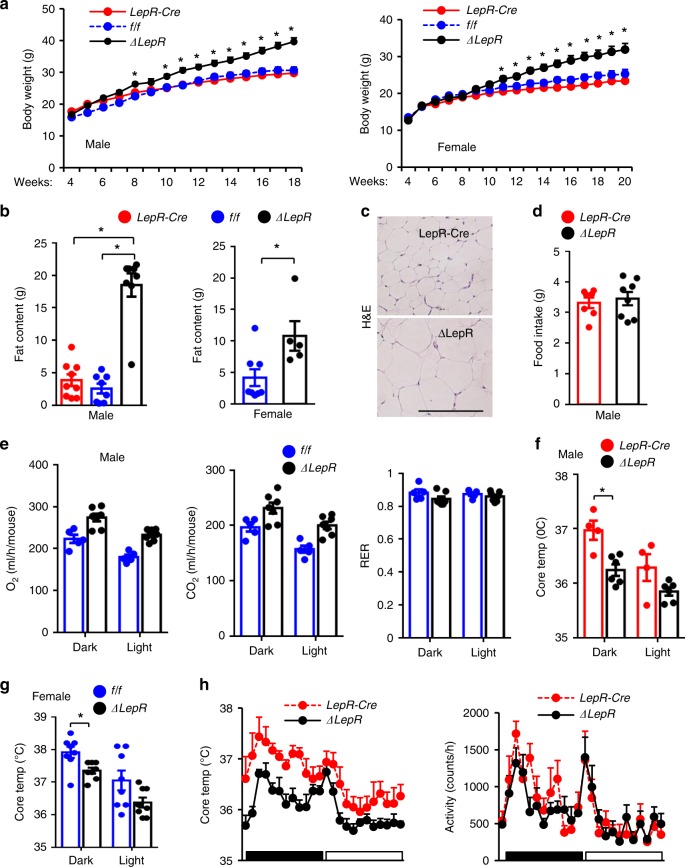
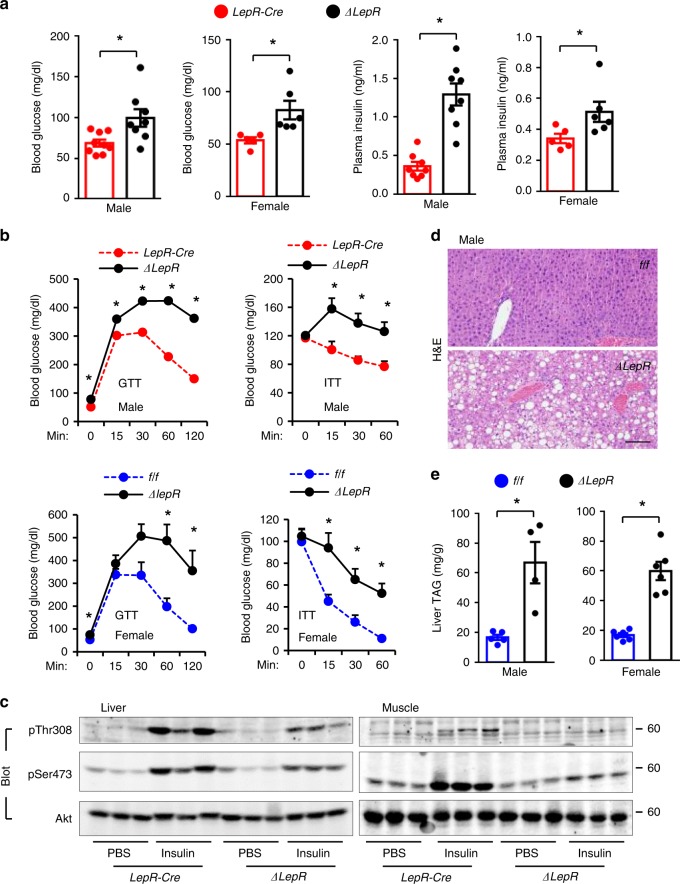
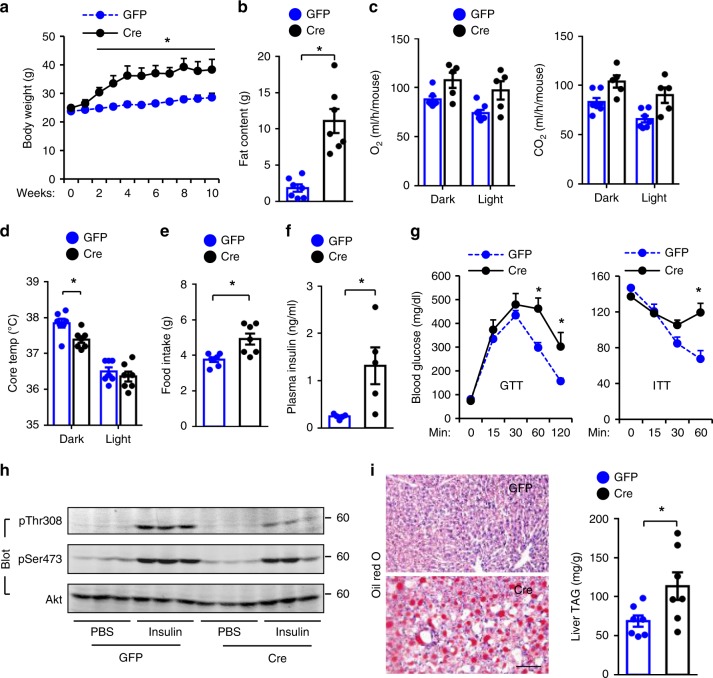
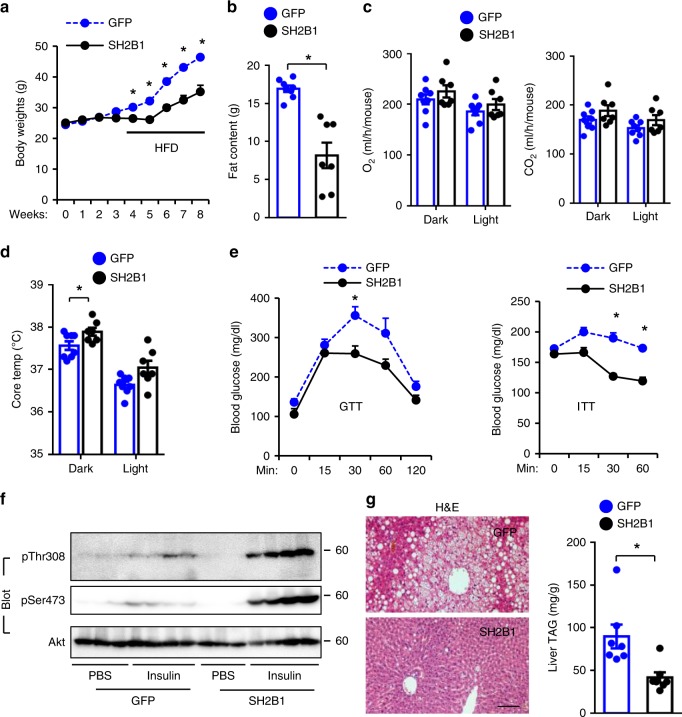
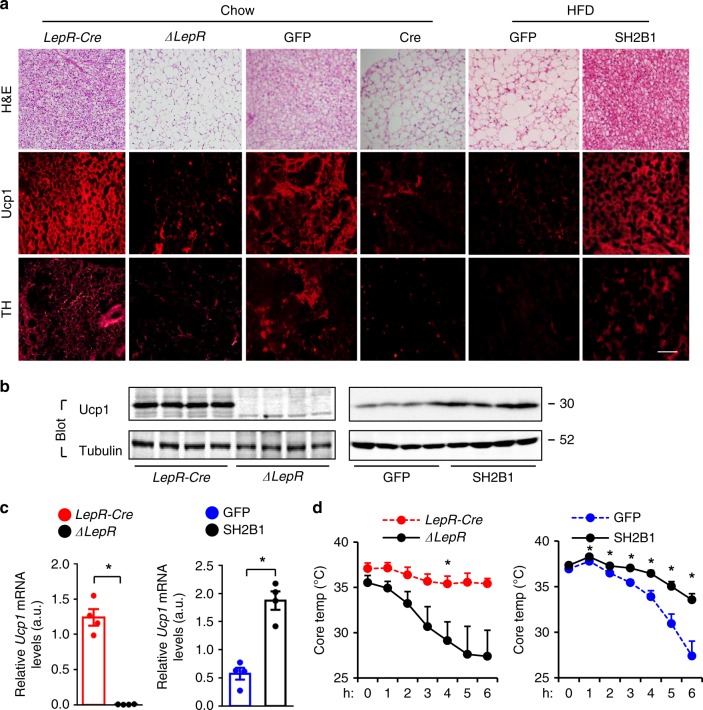
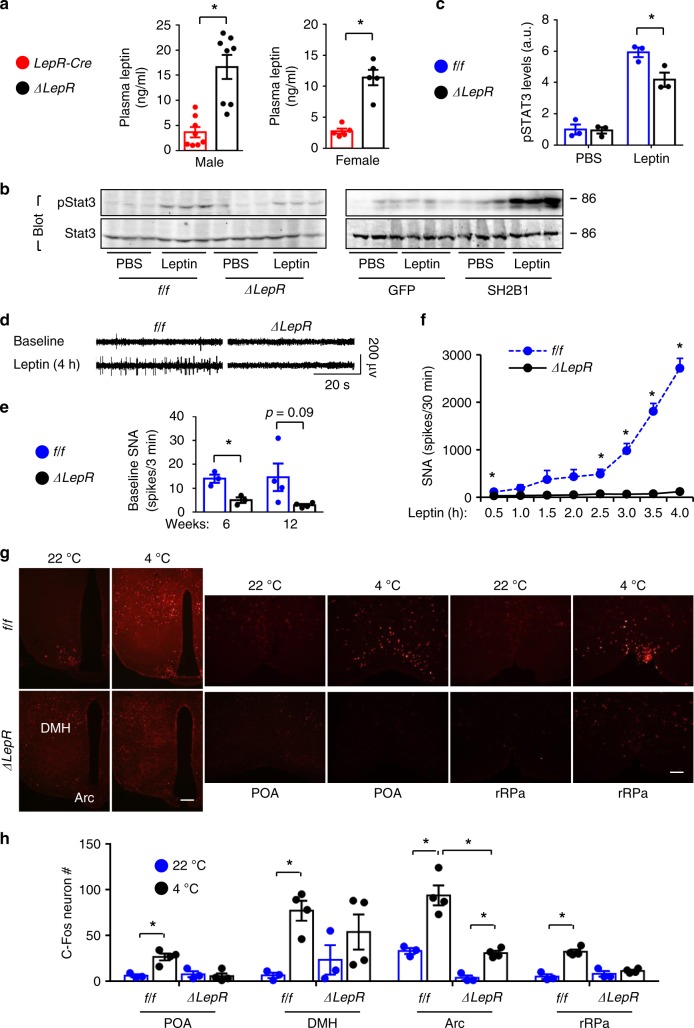
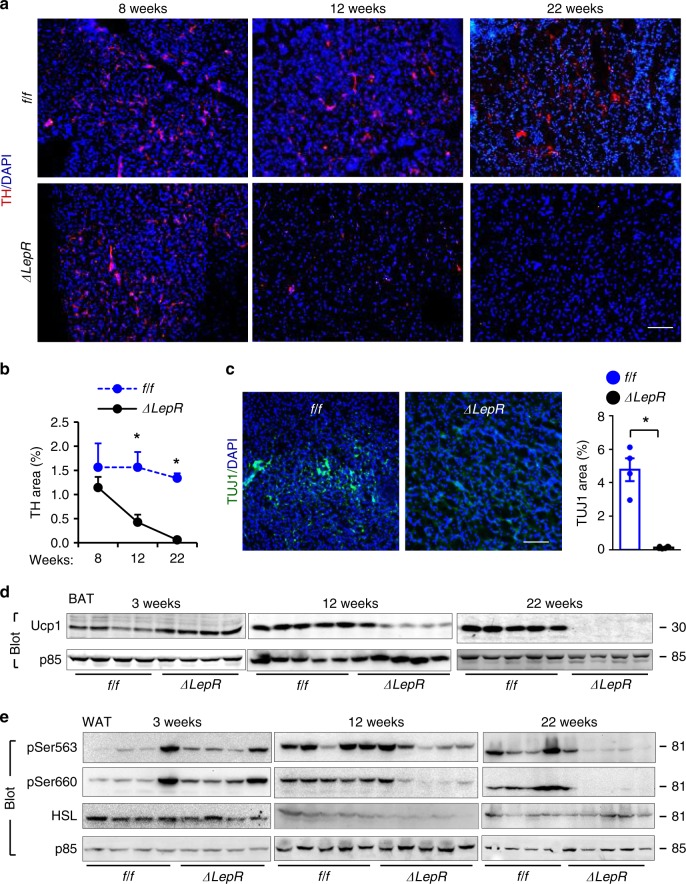
Leptin stimulates the sympathetic nervous system (SNS), energy expenditure, and weight loss; however, the underlying molecular mechanism remains elusive. Here, we uncover Sh2b1 in leptin receptor (LepR) neurons as a critical component of a SNS/brown adipose tissue (BAT)/thermogenesis axis. LepR neuron-specific deletion of Sh2b1 abrogates leptin-stimulated sympathetic nerve activation and impairs BAT thermogenic programs, leading to reduced core body temperature and cold intolerance. The adipose SNS degenerates progressively in mutant mice after 8 weeks of age. Adult-onset ablation of Sh2b1 in the mediobasal hypothalamus also impairs the SNS/BAT/thermogenesis axis; conversely, hypothalamic overexpression of human SH2B1 has the opposite effects. Mice with either LepR neuron-specific or adult-onset, hypothalamus-specific ablation of Sh2b1 develop obesity, insulin resistance, and liver steatosis. In contrast, hypothalamic overexpression of SH2B1 protects against high fat diet-induced obesity and metabolic syndromes. Our results unravel an unrecognized LepR neuron Sh2b1/SNS/BAT/thermogenesis axis that combats obesity and metabolic disease.


Conflict of interest statement

The authors declare no competing interests.

Figures

Fig. 1
Fig. 1. Sh2b1ΔLepR mice develop obesity.
a Growth curves. Male: f/f: n = 10, LepR-Cre: n = 19, Sh2b1ΔLepR: n = 25; female: f/f: n = 8, LepR-Cre: n = 15, Sh2b1ΔLepR: n = 16. b Fat content. Male (22 weeks): f/f: n = 8, Cre: n = 9, Sh2b1ΔLepR: n = 8; females (20 weeks): f/f: n = 8, Sh2b1ΔLepR: n = 5. c Representative H&E staining of epididymal WAT sections at 22 weeks of age (3 pairs). Scale bar: 200 μm. d Food intake of males at 10 weeks of age. LepR-Cre: n = 7, Sh2b1ΔLepR: n = 8. e O2 consumption and CO2 production at 10 weeks of age. Male: f/f: n = 5, Sh2b1ΔLepR: n = 7. fg Rectal temperature at 20 weeks of age. Male: Cre: n = 4, Sh2b1ΔLepR: n = 6; female: f/f: n = 8, Sh2b1ΔLepR: n = 8. h Core body temperature and locomotor activity in male mice (10 weeks) recorded using pre-implanted E-Mitters. LepR-Cre: n = 4, Sh2b1ΔLepR: n = 6. Data are presented as mean ± SEM. *p < 0.05, two-tailed unpaired Student’s t-test (b female, dg), two-way ANOVA (a), or one-way ANOVA (b male). Source data are provided as a Source Data file.
Fig. 2
Fig. 2. Sh2b1ΔLepR mice develop insulin resistance, glucose intolerance, and liver steatosis.
a Overnight fasting blood glucose and insulin levels at 22 weeks of age. Male: LepR-Cre: n = 8 (insulin) and n = 9 (glucose), Sh2b1ΔLepR: n = 8; female: LepR-Cre: n = 5, Sh2b1ΔLepR: n = 6. b GTT and ITT at 20 weeks of age. Male: LepR-Cre: n = 9, Sh2b1ΔLepR: n = 8; female: f/f: n = 5, Sh2b1ΔLepR: n = 5. c Male mice (23 weeks) were stimulated with insulin. Liver and skeletal muscle extracts were immunoblotted with the indicated antibodies. Male: f/f: n = 6, Sh2b1ΔLepR: n = 6; female: f/f: n = 6, Sh2b1ΔLepR: n = 6. d Representative H&E staining of liver sections at 23 weeks of age (3 pairs). Scale bar: 200 μm. e Liver TAG levels (normalized to liver weight) at 23 weeks of age. Male: f/f: n = 5, Sh2b1ΔLepR: n = 4; female: f/f: n = 6, Sh2b1ΔLepR: n = 6. Data are presented as mean ± SEM. *p < 0.05, two-tailed unpaired Student’s t-test. Source data are provided as a Source Data file.
Fig. 3
Fig. 3. Adult-onset, MBH-specific ablation of Sh2b1 results in obesity, insulin resistance, and liver steatosis.
AAV1-hSyn-Cre or AAV1-hSyn-GFP vectors were bilaterally injected into the MBH of Sh2b1f/f males at 10 weeks of age. a Growth curves. b Fat content in 10 weeks post transduction. c Energy expenditure in 10 weeks after transduction. d Rectal temperature in 10 weeks following transduction. e Food intake at 10 weeks post transduction. f Overnight fasting plasma insulin levels in 10 weeks after transduction. g GTT and ITT in 10–11 weeks post transduction. h Mice were stimulated with insulin in 11 weeks post transduction. Liver extracts were immunoblotted with the indicated antibodies (n = 3 mice per group). i Representative Oil Red O staining of liver sections and liver TAG levels (normalized to liver weight) in 11 weeks post transduction. a, b, d, e, g, i: AAV1-hSyn-GFP: n = 7, AAV1-hSyn-Cre: n = 7; c: AAV1-hSyn-GFP: n = 7, AAV1-hSyn-Cre: n = 5; f: AAV1-hSyn-GFP: n = 5, AAV1-hSyn-Cre: n = 5. Scale bar: 100 μm. Data are presented as mean ±  SEM. *p < 0.05, two-tailed unpaired Student’s t-test. Source data are provided as a Source Data file.
Fig. 4
Fig. 4. MBH-specific overexpression of SH2B1 protects against HFD-induced obesity, insulin resistance, and liver steatosis.
AAV9-CAG-SH2B1β (n = 7) or AAV9-CAG-GFP (n = 7–8) vectors were bilaterally injected into the MBH of adult C57BL/6J males, followed by HFD feeding. a Growth curves. b Fat content in 10 weeks post HFD. c Energy expenditure in 10 weeks post HFD. d Rectal temperature in 10 weeks post HFD. e GTT and ITT in 10–11 weeks post HFD. f Mice (11 weeks post HFD) were stimulated with PBS (n = 3 mice per group) or insulin (n = 4 mice per group). Liver extracts were immunoblotted with the indicated antibodies. g Representative H&E staining of liver sections and liver TAG levels (normalized to liver weight) in 12 weeks post HFD. Scale bar: 200 μm. Data are presented as mean ± SEM. *p < 0.05, two-tailed unpaired Student’s t-test. Source data are provided as a Source Data file.
Fig. 5
Fig. 5. Sh2b1 in LepR neurons supports the maintenance and function of BAT.
ac BAT was harvested from Sh2b1ΔLepR and LepR-Cre males at 10 weeks of age, and from Sh2b1f/f males in 11 weeks after they were bilaterally injected into the MBH with AAV1-hSyn-Cre or AAV1-hSyn-GFP vectors (on chow diet). Adult C57BL/6J males were bilaterally injected into the MBH with AAV9-CAG-SH2B1β or AAV9-CAG-GFP vectors and then fed an HFD for 12 weeks. a Representative BAT images. Scale bar: 200 μm. Sh2b1ΔLepR: n = 3, LepR-Cre: n = 4, AAV1-hSyn-Cre: n = 7, AAV1-hSyn-GFP: n = 7, AAV9-CAG-GFP: n = 8, AAV9-CAG-SH2B1: n = 8. b BAT extracts were immunoblotted with the indicated antibodies. Sh2b1ΔLepR: n = 4, LepR-Cre: n = 4, AAV9-CAG-GFP: n = 4, AAV9-CAG-SH2B1: n = 4. c Ucp1 mRNA levels were normalized to 36B4 levels. Sh2b1ΔLepR: n = 4, LepR-Cre: n = 4, AAV9-CAG-GFP: n = 4, AAV9-CAG-SH2B1β: n = 4. a.u. arbitrary units. d Core body temperature was recorded using E-Mitters in Sh2b1ΔLepR (n = 3) and LepR-Cre (n = 3) at 10 weeks of age, on chow diet, and upon cold temperature (4 °C). Adult C57BL/6J males were bilaterally injected into the MBH with AAV9-CAG-GFP (n = 7) or AAV9-CAG-SH2B1β (n = 7) vectors and then fed an HFD for 10 weeks. Rectal temperature was measured upon cold exposure. Data are presented as mean ± SEM. *p < 0.05, two-tailed unpaired Student’s t-test. Source data are provided as a Source Data file.
Fig. 6
Fig. 6. Sh2b1 in LepR neurons mediates leptin stimulation of adipose SNS.
a Overnight fasting plasma leptin levels at 22 weeks of age. Male: LepR-Cre: n = 8, Sh2b1ΔLepR: n = 8; female: LepR-Cre: n = 5, Sh2b1ΔLepR: n = 5. b, c Sh2b1ΔLepR and Sh2b1f/f males (6 weeks) were treated with leptin. Hypothalamic extracts were immunoblotted with antibodies against phospho-Stat3 (pTyr705) or Stat3. Stat3 phosphorylation was normalized to total Stat3 levels. Adult C57BL/6J males were bilaterally injected into the MBH with AAV9-CAG-SH2B1β or AAV9-CAG-GFP vectors, fed an HFD for 10 weeks, fasted overnight, and centrally injected with leptin for 15 min. Phosphorylation of hypothalamic Stat3 was assessed. c n = 3 per group. a.u. arbitrary units. df BAT sympathetic nerve activity (SNA). d Representative traces. e Baseline SNA at 6 (n = 3 mice per group) and 12 (n = 4 mice per group) weeks of age. f Time courses of leptin response. Leptin was centrally administrated into Sh2b1ΔLepR (n = 3) and Sh2b1f/f (n = 3) males at 6 weeks of age. g, h Sh2b1ΔLepR and Sh2b1f/f males (7 weeks) were exposed to 22 or 4 °C for 4 h. Hypothalamic sections were stained with anti-Fos antibody. g Representative c-Fos staining of hypothalamic sections. Scale bar: 200 μm. h Number of c-Fos neurons in different hypothalamic areas. 4 °C: n = 4 mice per group, 22 °C: n = 3 mice per group. Data are presented as mean ± SEM. *p < 0.05, two-tailed unpaired Student’s t-test (a, c, e, f) or two-way ANOVA (h). Source data are provided as a Source Data file.
Fig. 7
Fig. 7. Sh2b1 in LepR neurons supports the maintenance of adipose SNS.
a, b BAT sections were prepared from male mice at 8, 12, and 22 weeks of age and stained with anti-tyrosine hydroxylase (TH) antibodies. a Representative images (n = 3 mice per group). b TH areas were quantified and normalized to total areas (n = 3 mice per group). c BAT sections were prepared at 22 weeks of age and stained with anti-TUJ1 antibody. TUJ1 areas were normalized to total areas. Sh2b1f/f: n = 4, Sh2b1ΔLepR: n = 6. d, e BAT (d) and epididymal WAT (e) extracts were prepared from male mice at 3, 12, and 22 weeks of age and immunoblotted with the indicated antibodies. Each lane represents an individual mouse. Data are presented as mean ± SEM. *p < 0.05, two-tailed unpaired Student’s t-test. Source data are provided as a Source Data file.

References

    1. Zhou Y, Rui L. Leptin signaling and leptin resistance. Front. Med. 2013;7:207–222. doi: 10.1007/s11684-013-0263-5. - DOI - PMC - PubMed
    1. Patterson CM, Leshan RL, Jones JC, Myers MG., Jr. Molecular mapping of mouse brain regions innervated by leptin receptor-expressing cells. Brain Res. 2011;1378:18–28. doi: 10.1016/j.brainres.2011.01.010. - DOI - PMC - PubMed
    1. Scott MM, et al. Leptin targets in the mouse brain. J. Comp. Neurol. 2009;514:518–532. doi: 10.1002/cne.22025. - DOI - PMC - PubMed
    1. Morris DL, Rui L. Recent advances in understanding leptin signaling and leptin resistance. Am. J. Physiol. Endocrinol. Metab. 2009;297:E1247–E1259. doi: 10.1152/ajpendo.00274.2009. - DOI - PMC - PubMed
    1. Mori H, et al. Socs3 deficiency in the brain elevates leptin sensitivity and confers resistance to diet-induced obesity. Nat. Med. 2004;10:739–743. doi: 10.1038/nm1071. - DOI - PubMed

Publication types

MeSH terms