. 2020 Mar 23;11(1):1512.
doi: 10.1038/s41467-020-15342-5.

Colonic microbiota is associated with inflammation and host epigenomic alterations in inflammatory bowel disease

Affiliations

Colonic microbiota is associated with inflammation and host epigenomic alterations in inflammatory bowel disease

F J Ryan et al. Nat Commun. .

Abstract

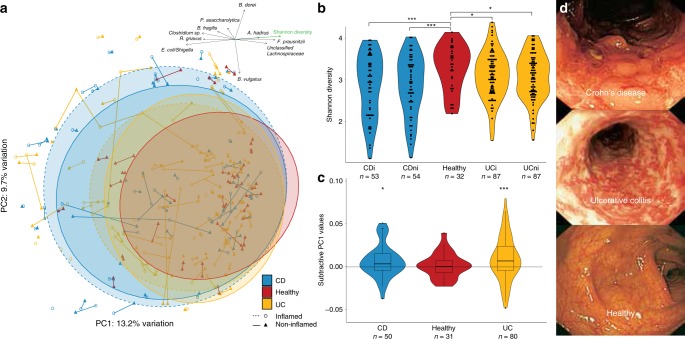
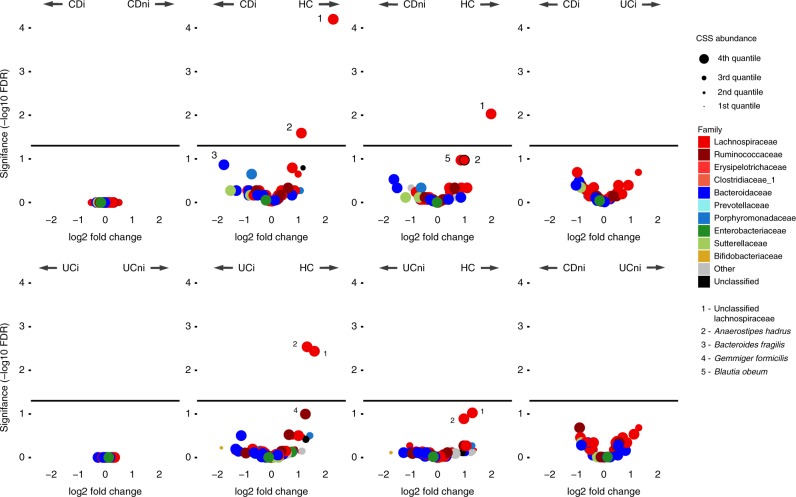
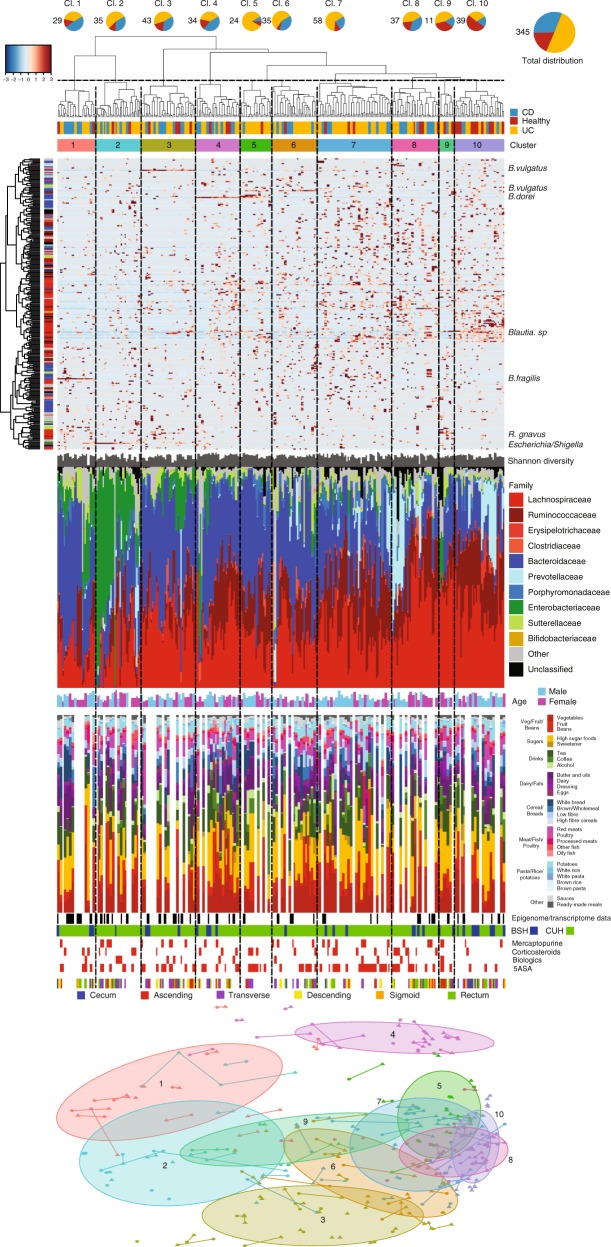
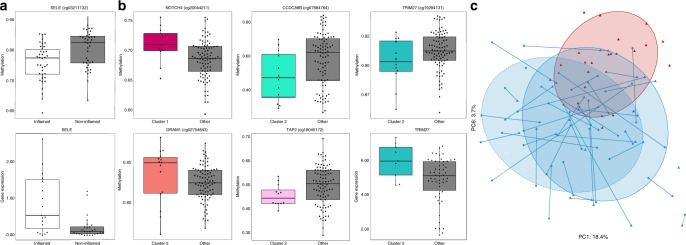
Studies of inflammatory bowel disease (IBD) have been inconclusive in relating microbiota with distribution of inflammation. We report microbiota, host transcriptomics, epigenomics and genetics from matched inflamed and non-inflamed colonic mucosa [50 Crohn's disease (CD); 80 ulcerative colitis (UC); 31 controls]. Changes in community-wide and within-patient microbiota are linked with inflammation, but we find no evidence for a distinct microbial diagnostic signature, probably due to heterogeneous host-microbe interactions, and show only marginal microbiota associations with habitual diet. Epithelial DNA methylation improves disease classification and is associated with both inflammation and microbiota composition. Microbiota sub-groups are driven by dominant Enterbacteriaceae and Bacteroides species, representative strains of which are pro-inflammatory in vitro, are also associated with immune-related epigenetic markers. In conclusion, inflamed and non-inflamed colonic segments in both CD and UC differ in microbiota composition and epigenetic profiles.


Conflict of interest statement

This work was supported in part by Second Genome; T.Z.D. is a co-founder and Vice-president of Second Genome; P.J.M., S.I., and C.C.A. were employees of Second Genome at the time of the analysis.

Figures

Fig. 1
Fig. 1. Overall microbiota composition and diversity of inflamed and non-inflamed colonic mucosa from 161 subjects (CD—blue, UC—yellow, and healthy controls—red), based on 257 RSVs that were present in ≥5% of the samples.
a PCoA of Bray–Curtis distances with paired biopsies from each subject connected by vectors. Ellipses indicate 80% confidence regions with solid and dashed lines for non-inflamed and inflamed mucosa, respectively. The top arrows represent gradients of Shannon diversity (green) and abundances of a selection of bacterial taxa most correlated with the first two principal coordinates (Supplementary Table 2). b Differences in Shannon diversity were significantly lower in IBD compared with healthy mucosa (unpaired biopsies included), but not between diseases or for different inflammation status (Mann–Whitney test, two-sided; P-values: CDi vs H:0.006; CDni vs H: 0.008; UCi vs H: 0.0102; UCni vs H: 0.050). c For each pair of biopsies PC1, values from the inflamed sample were subtracted from the non-inflamed sample for each of the three conditions (reference samples randomly selected for healthy controls). Medians significantly higher than zero indicate within-patient gradient of inflammation away from non-inflamed/healthy microbiota (one-sample Wilcoxon, two-sided; P-values: CD = 0.08; UC = 0.009; box plot lower and upper sides show 25th and 75th percentiles, respectively. The whiskers are 1.5 of the interquartile range. P-values: *<0.1; **<0.05; ***<0.01). d Representative photographs of colons from CD, UC, and control subjects. Source: ref. .
Fig. 2
Fig. 2. Volcano plots showing differential abundance of RSVs between sample groups.
Both inflamed vs. non-inflamed tests were based on paired biopsies only. y-axis show adjusted P value (false discovery rate) and x-axis shows log2 fold change. Horizontal lines reflect 0.05 FDR. Points are colored by family level classification based by Mothur against the RDP database v11.4. Circle sizes are assigned based on the mean cumulative-sum scaling (CSS) and divided into quartiles with the larger circles corresponding to higher abundances. Species discussed in the text are explicitly listed; see Supplementary Table 3 for a complete list.
Fig. 3
Fig. 3. Sample clustering, diversity and relative abundance of mucosal microbiota from 346 biopsies (CD, UC and healthy), based on 257 ribosomal sequence variants (RSVs) that were present in ≥5% of the samples.
From the top: pie charts with total numbers and proportions of the three subject cohorts for each cluster; hierarchical Ward linkage clustering based on Bray–Curtis distances; cohort belongingness. Ten individually colored clusters obtained through the DynamicTreeCut algorithm; heatmap with RSV abundance values to the right of vertical clustering of RSVs using Ward linkage based on Spearman correlation coefficients (heatmap shows z-scores, i.e., number of standard deviations from the mean value of each row); Shannon diversity for each sample; and bar plot of relative abundances at taxonomic family levels with red families belonging to the Firmicutes phylum, blue Bacteroidetes, green Proteobacteria, and yellow Actinobacteria; age and gender for each sample, major food categories, hospital, medication, and biopsy location; clusters mapped back onto the Bray–Curtis PCoA from Fig. 1a. The right-most margin shows species classifications for RSVs consistently abundant for certain clusters.
Fig. 4
Fig. 4. Differences in host DNA methylation and gene expression across subject groups with regards to inflammation and microbiota clustering.
Significant differential host DNA methylation [beta values; significance determined using mixed linear models from lme4 library, adjusted with FDR] with corresponding gene expression [log2(fragments per kilobase of transcript per million mapped reads)] of examples of immune-related genes in a inflamed/non-inflamed CD tissue, b microbiota clusters 1–3 (expression, using stattest from the ballgown library, was significant before adjustment for multiple testing with FDR, and for a subset of 71 matching samples; extreme outliers removed to improve clarity; gene body methylation in NOTCH4, DRAM1, and TRIM27 (b), promoter methylation in SELE (a) and CCDC88B (b)) (box plot lower and upper sides show 25th and 75th percentiles, respectively. The whiskers are 1.5 of the interquartile range). c Epigenome principal component analysis outlining the inflammation- (PC1) and disease- (PC6) associated epigenetic trends.

Similar articles

Cited by

References

    1. Harris RA, et al. Colonic mucosal epigenome and microbiome development in children and adolescents. J. Immunol. Res. 2016;2016:9170162. doi: 10.1155/2016/9170162. - DOI - PMC - PubMed
    1. Lopez-Siles M, et al. Mucosa-associated Faecalibacterium prausnitzii phylotype richness is reduced in patients with inflammatory bowel disease. Appl Environ. Microbiol. 2015;81:7582–7592. doi: 10.1128/AEM.02006-15. - DOI - PMC - PubMed
    1. Iwai S, et al. Piphillin: improved prediction of metagenomic content by direct inference from human microbiomes. PLoS One. 2016;11:e0166104. doi: 10.1371/journal.pone.0166104. - DOI - PMC - PubMed
    1. David P, Baumann M, Wikstrom M, Finel M. Interaction of purified NDH-1 from Escherichia coli with ubiquinone analogues. Biochim Biophys. Acta. 2002;1553:268–278. doi: 10.1016/S0005-2728(01)00248-1. - DOI - PubMed
    1. Albenberg L, et al. Correlation between intraluminal oxygen gradient and radial partitioning of intestinal microbiota. Gastroenterology. 2014;147:1055–1063. doi: 10.1053/j.gastro.2014.07.020. - DOI - PMC - PubMed

Publication types

MeSH terms