

RNA-Seq transcriptome profiling in three liver regeneration models in rats: comparative analysis of partial hepatectomy, ALLPS, and PVL
- PMID: 32251301
- PMCID: PMC7089998
- DOI: 10.1038/s41598-020-61826-1
RNA-Seq transcriptome profiling in three liver regeneration models in rats: comparative analysis of partial hepatectomy, ALLPS, and PVL
Erratum in
-
Publisher Correction: RNA-Seq transcriptome profiling in three liver regeneration models in rats: comparative analysis of partial hepatectomy, ALLPS, and PVL.Sci Rep. 2020 May 5;10(1):7502. doi: 10.1038/s41598-020-64447-w. Sci Rep. 2020. PMID: 32372000 Free PMC article.
Abstract
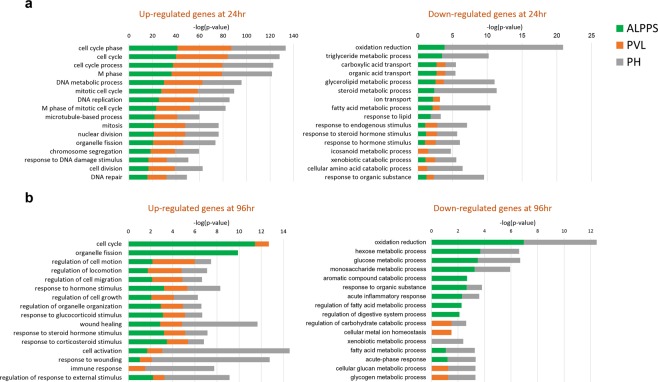
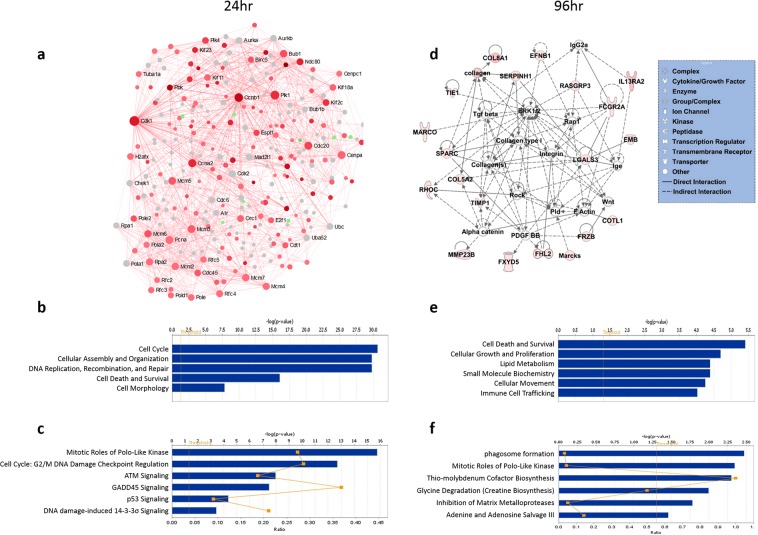
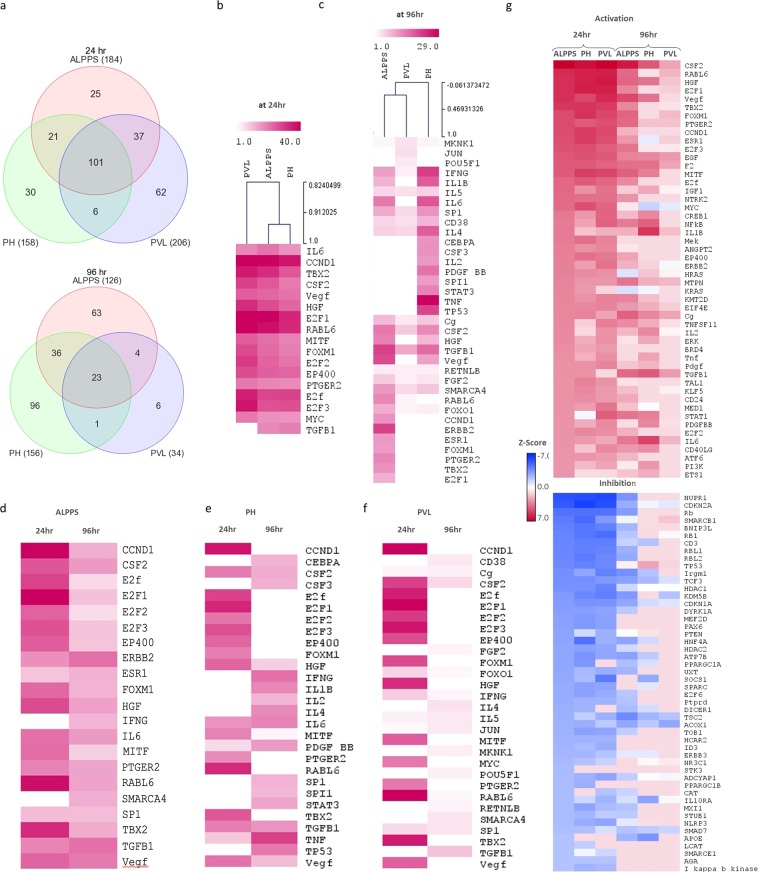
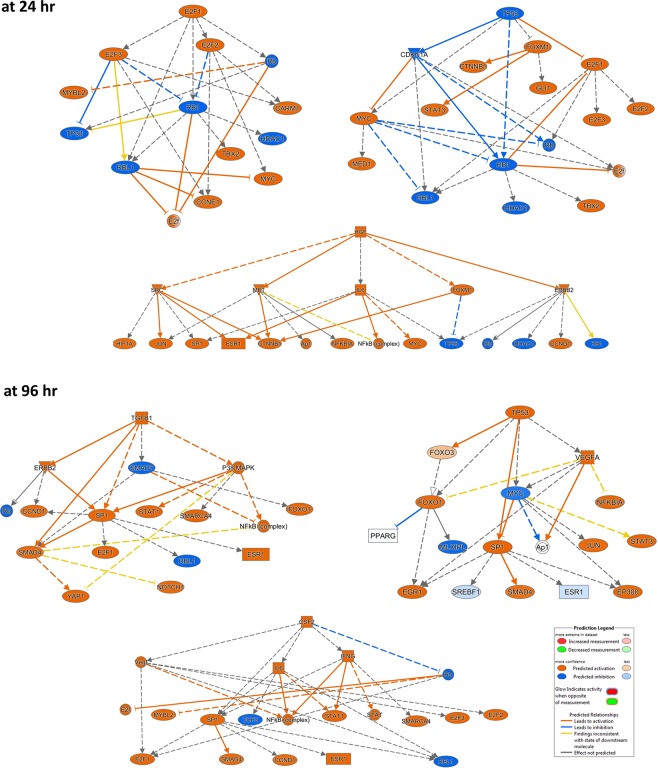
The liver is a unique organ that has a phenomenal capacity to regenerate after injury. Different surgical procedures, including partial hepatectomy (PH), intraoperative portal vein ligation (PVL), and associated liver partition and portal vein ligation for staged hepatectomy (ALPPS) show clinically distinct recovery patterns and regeneration. The observable clinical differences likely mirror some underlying variations in the patterns of gene activation and regeneration pathways. In this study, we provided a comprehensive comparative transcriptomic analysis of gene regulation in regenerating rat livers temporally spaced at 24 h and 96 h after PH, PVL, and ALPPS. The time-dependent factors appear to be the most important determinant of post-injury alterations of gene expression in liver regeneration. Gene expression profile after ALPPS showed more similar expression pattern to the PH than the PVL at the early phase of the regeneration. Early transcriptomic changes and predicted upstream regulators that were found in all three procedures included cell cycle associated genes (E2F1, CCND1, FOXM1, TP53, and RB1), transcription factors (Myc, E2F1, TBX2, FOXM1), DNA replication regulators (CDKN1A, EZH2, RRM2), G1/S-transition regulators (CCNB1, CCND1, RABL6), cytokines and growth factors (CSF2, IL-6, TNF, HGF, VEGF, and EGF), ATM and p53 signaling pathways. The functional pathway, upstream, and network analyses revealed both unique and overlapping molecular mechanisms and pathways for each surgical procedure. Identification of molecular signatures and regenerative signaling pathways for each surgical procedure further our understanding of key regulators of liver regeneration as well as patient populations that are likely to benefit from each procedure.
Conflict of interest statement
The authors declare no competing interests.
Figures

Similar articles
-
Associated Liver Partition and Portal Vein Ligation (ALPPS) vs Selective Portal Vein Ligation (PVL) for Staged Hepatectomy in a Rat Model. Similar Regenerative Response?PLoS One. 2015 Dec 2;10(12):e0144096. doi: 10.1371/journal.pone.0144096. eCollection 2015. PLoS One. 2015. PMID: 26630386 Free PMC article.
-
JNK1 induces hedgehog signaling from stellate cells to accelerate liver regeneration in mice.J Hepatol. 2018 Sep;69(3):666-675. doi: 10.1016/j.jhep.2018.04.017. Epub 2018 Apr 28. J Hepatol. 2018. PMID: 29709677
-
Mitochondrial function after associating liver partition and portal vein ligation for staged hepatectomy in an experimental model.Br J Surg. 2019 Jan;106(1):120-131. doi: 10.1002/bjs.10978. Epub 2018 Sep 27. Br J Surg. 2019. PMID: 30259964
-
Chance and challenge of associating liver partition and portal vein ligation for staged hepatectomy.Hepatobiliary Pancreat Dis Int. 2019 Jun;18(3):214-222. doi: 10.1016/j.hbpd.2019.04.006. Epub 2019 Apr 24. Hepatobiliary Pancreat Dis Int. 2019. PMID: 31056484 Review.
-
Partial ALPPS versus complete ALPPS for staged hepatectomy.BMC Gastroenterol. 2019 Oct 26;19(1):170. doi: 10.1186/s12876-019-1090-1. BMC Gastroenterol. 2019. PMID: 31655548 Free PMC article. Review.
Cited by
-
Circulating proliferative factors versus portal inflow redistribution: mechanistic insights of ALPPS-derived rapid liver regeneration.Front Oncol. 2025 Jan 7;14:1429564. doi: 10.3389/fonc.2024.1429564. eCollection 2024. Front Oncol. 2025. PMID: 39839786 Free PMC article. Review.
-
A comprehensive investigation on liver regeneration: a meta-analysis and systems biology approach.Clin Exp Hepatol. 2021 Jun;7(2):183-190. doi: 10.5114/ceh.2021.107564. Epub 2021 Jun 30. Clin Exp Hepatol. 2021. PMID: 34295986 Free PMC article.
-
Vascular Heterogeneity With a Special Focus on the Hepatic Microenvironment.Front Physiol. 2020 Nov 11;11:591901. doi: 10.3389/fphys.2020.591901. eCollection 2020. Front Physiol. 2020. PMID: 33262705 Free PMC article. Review.
-
Astragaloside IV Suppresses Hepatic Proliferation in Regenerating Rat Liver after 70% Partial Hepatectomy via Down-Regulation of Cell Cycle Pathway and DNA Replication.Molecules. 2021 May 13;26(10):2895. doi: 10.3390/molecules26102895. Molecules. 2021. PMID: 34068164 Free PMC article.
-
Hepatectomy-Induced Alterations in Hepatic Perfusion and Function - Toward Multi-Scale Computational Modeling for a Better Prediction of Post-hepatectomy Liver Function.Front Physiol. 2021 Nov 18;12:733868. doi: 10.3389/fphys.2021.733868. eCollection 2021. Front Physiol. 2021. PMID: 34867441 Free PMC article. Review.
References
Publication types
MeSH terms
LinkOut - more resources
Full Text Sources
Research Materials
Miscellaneous
