. 2020 Mar 23;10(1):5224.
doi: 10.1038/s41598-020-62117-5.

The pan-cancer landscape of netrin family reveals potential oncogenic biomarkers

Affiliations

The pan-cancer landscape of netrin family reveals potential oncogenic biomarkers

Wenjun Hao et al. Sci Rep. .

Abstract

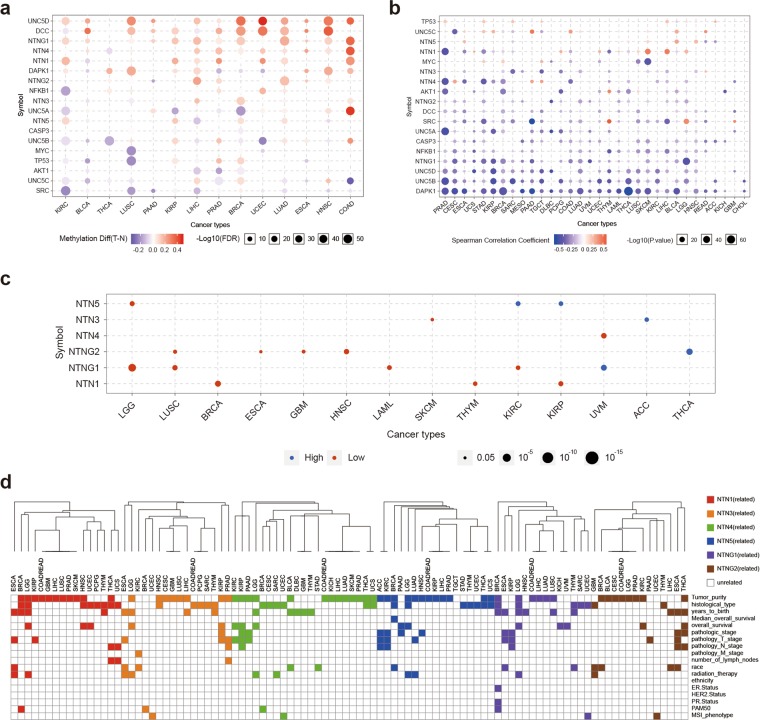
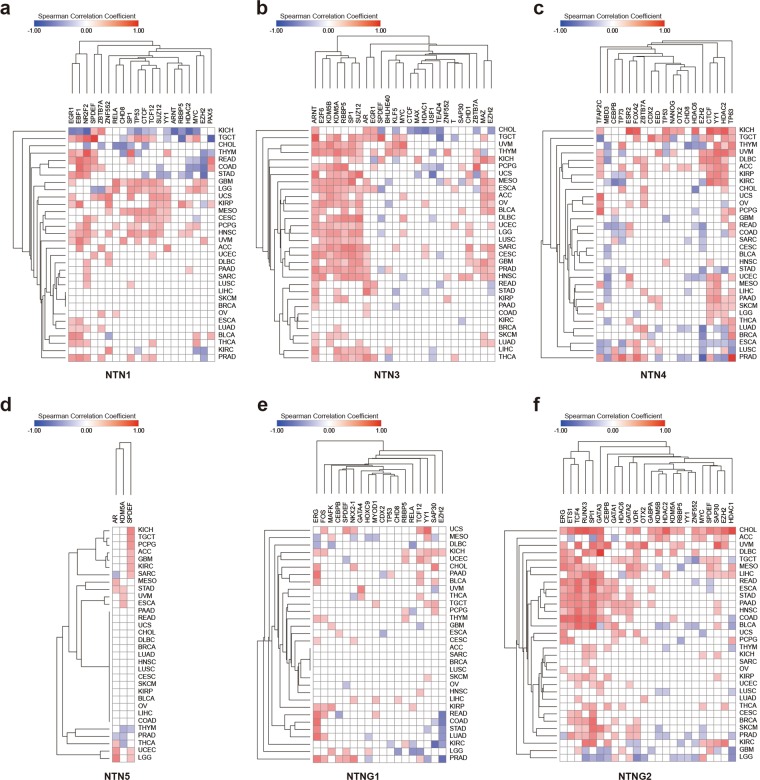
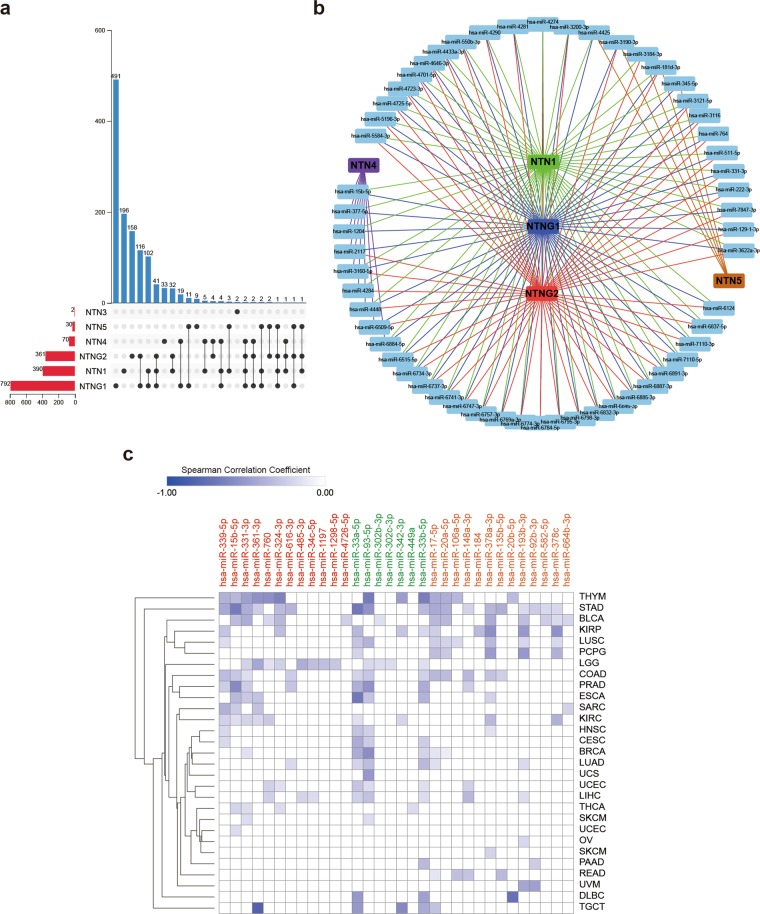
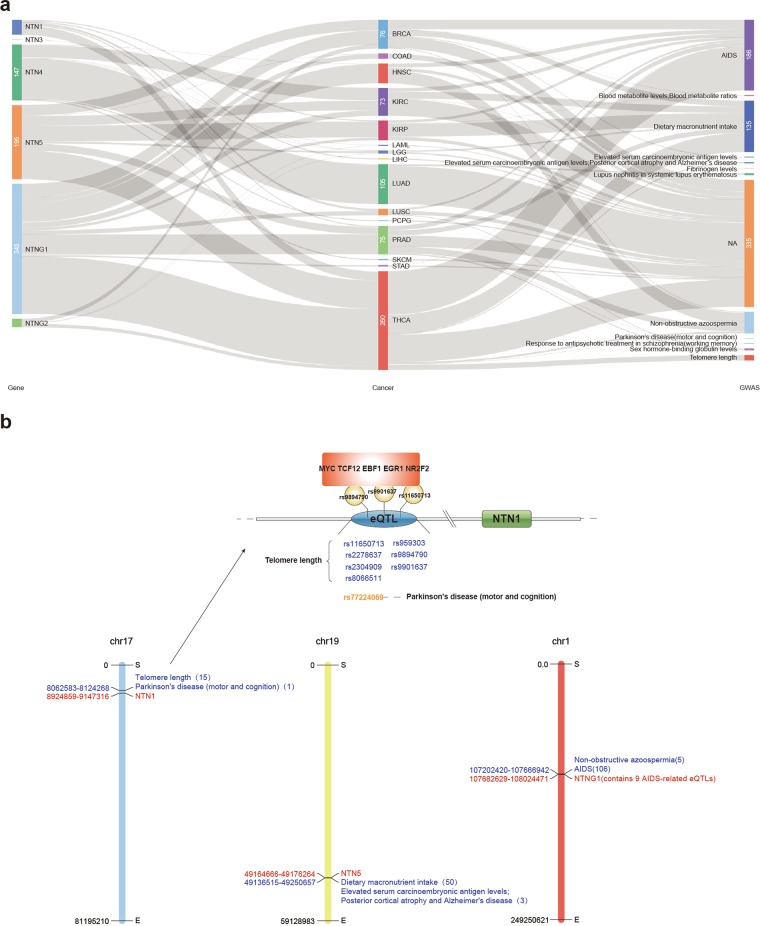
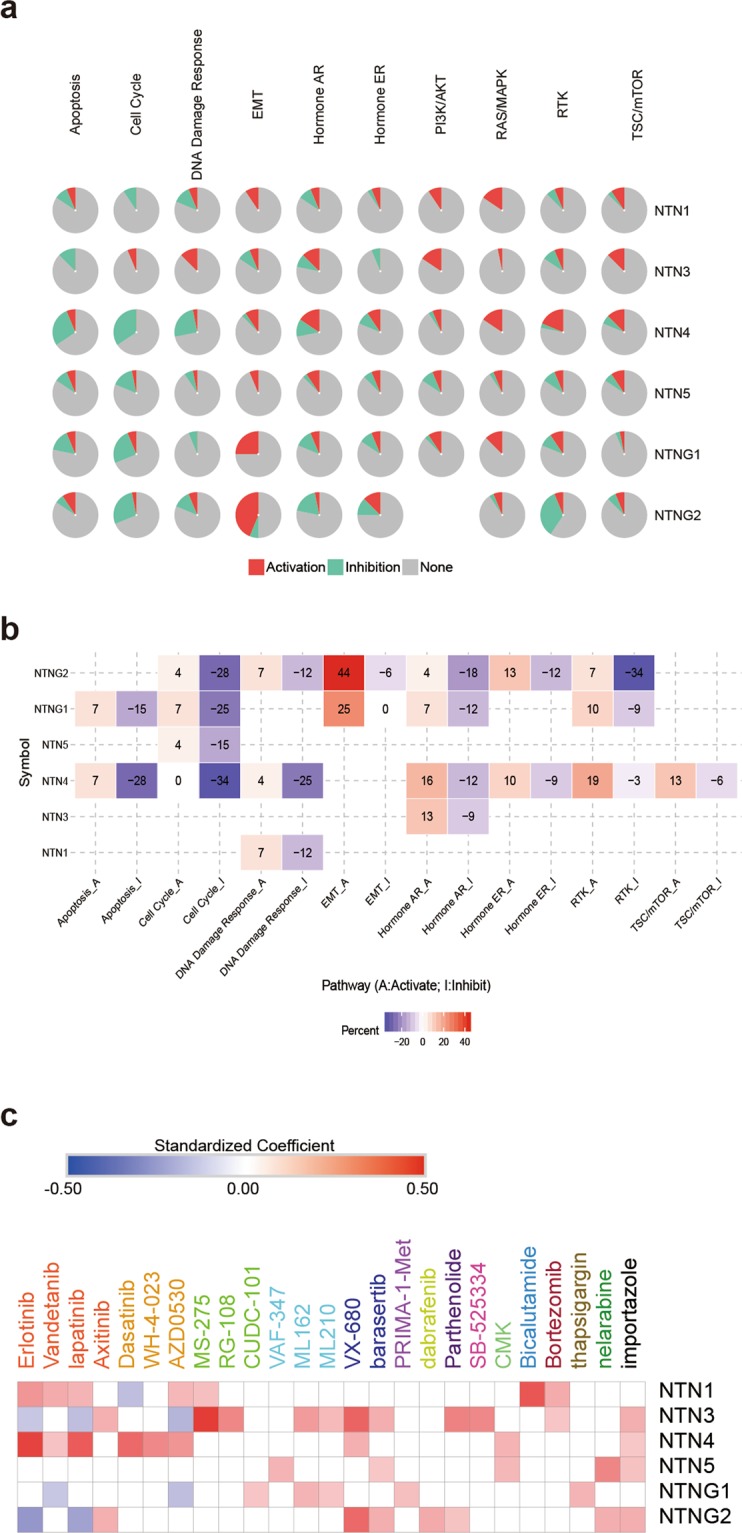
Recent cancer studies have found that the netrin family of proteins plays vital roles in the development of some cancers. However, the functions of the many variants of these proteins in cancer remain incompletely understood. In this work, we used the most comprehensive database available, including more than 10000 samples across more than 30 tumor types, to analyze the six members of the netrin family. We performed comprehensive analysis of genetic change and expression of the netrin genes and analyzed epigenetic and pathway relationships, as well as the correlation of expression of these proteins with drug sensitivity. Although the mutation rate of the netrin family is low in pan-cancer, among the tumor patients with netrin mutations, the highest number are Uterine Corpus Endometrial Carcinoma patients, accounting for 13.6% of cases (54 of 397). Interestingly, the highest mutation rate of a netrin family member is 38% for NTNG1 (152 of 397). Netrin proteins may participate in the development of endocrine-related tumors and sex hormone-targeting organ tumors. Additionally, the participation of NTNG1 and NTNG2 in various cancers shows their potential for use as new tumor markers and therapeutic targets. This analysis provides a broad molecular perspective of this protein family and suggests some new directions for the treatment of cancer.


Conflict of interest statement

The authors declare no competing interests.

Figures

Figure 1
Figure 1
Netrins mutations in cancer. (a) Netrins exhibit non-synonymous mutations in the coding region in 26 kinds of TCGA cancers. Each gray vertical bar represents a patient. (b) Amino acid mutation of netrins in TCGA cancers. Hot spot mutations are indicated. Substituted mutations are represented by slash-separated single-letter amino acid codes. Other indicates important mutation sites that predicted as damaging in both VEST3 and REVEL algorithms in the VEST3 and REVEL algorithms and coverage < 0.1 in the functional and structural importance of the protein sequence position. Fs, frameshifts; *, termination codon. (c) Amino acid mutation of netrins in Cancer Cell Line Encyclopedia (CCLE). Substituted mutations are represented by slash-separated single-letter amino acid codes. Other represents a mutation site consistent with TCGA mutation in CCLE.
Figure 2
Figure 2
Distribution of netrin mutations in individuals and proteins. (a) The intersection of mutations in individuals of members of the netrin family. (b) The number of mutations in the netrin family in TCGA cancers. (c) Percentage map of the distribution of cancers associated with mutations in netrin genes (number of mutations ≥ 5) among genetic ancestry groups. (d) Percentage distribution of mutations in each member of the netrin family in its domain. (e) Percentage map of mutations in the netrin family domain among genetic ancestry groups.
Figure 3
Figure 3
Fusion gene of netrins. (a) Fusion gene of NTN1, NTN4, NTNG1 in cancer. (b) NTN4 and LETMD1 fusion transcription. Blue indicates the exon of the NTN4 gene, red indicates the exon of the LETMD1 gene, and the dotted line indicates the linkage of the two partial genes.
Figure 4
Figure 4
Netrin expression and clinical features. (a) Differential expression of netrins between TCGA cancers and their normal tissues. Blue indicates low expression in cancer tissue (p < 0.05), red indicates high expression in cancer tissue (p < 0.05). (b) Differential survival between high and low expression of netrins in TCGA cancers. Blue indicates worse survival of low expression in cancer tissue (p < 0.05), and red indicates worse survival of high expression in cancer tissue (p < 0.05). (c) The relationship between netrin expression and the clinical parameters of TCGA cancer. Color indicates that clinical parameters were associated with gene expression (p < 0.05), and white indicates the opposite. (d) Heat map of netrin expression in human blood. (e) The survival curve of NTN4 in pancreatic cancer (optimal cut off). (f) The survival curve of NTNG2 in pancreatic cancer (optimal cut off). (g) Expression heatmap of NTN1 and NTN4 as extracellular vesicle proteins in 60 cell lines of NCI-60.
Figure 5
Figure 5
Netrins methylation and distribution in clinical samples. (a) Bubble map of the differential methylation of netrins and downstream genes between TCGA cancer and normal samples. Blue dots represent methylation down-regulation in tumors, and red dots represent methylation up-regulation in tumors, with the darker the color, the greater the difference. The size of the point represents statistical significance, where the larger the size, the greater the significance. (b) Correlation between methylation and netrin expression and downstream genes in TCGA cancer. Blue dots indicates gene methylation level is up-regulated and gene expression is down-regulated. Red dots indicate that gene methylation level and gene expression are up-regulated. The darker the color, the higher the correlation. The size of the point represents the statistical significance, where the larger the size, the greater the significance. (c) Differential survival of high and low methylation of netrins in TCGA cancer. Only genes with p value < 0.05 are displayed on the diagram. Red dots represent worse survival of hypermethylation in tumors, and blue dots indicate the opposite. The size of the point represents the statistical significance, where the larger the size, the greater the significance. (d) Relationship between netrin methylation and clinical parameters in TCGA cancers. Color indicates that clinical parameters are associated with methylation (p < 0.05), and white indicates no association.
Figure 6
Figure 6
Co-expression of netrin transcription regulators and netrins in 32 kinds of TCGA cancer. Co-expression of transcription regulators of (a) NTN1, (b) NTN3, (c) NTN4, (d) NTN5, (e) NTNG1, and (f) NTNG2 in 32 kinds of TCGA cancers. We used ±0.2 as the cut off value, -0.2 < Spearman Correlation Cofficient < 0.2 as irrelevant. Red indicates a positive correlation to co-expression between the gene and its transcriptional regulator in cancer, while blue is opposite. The darker the color, the higher the correlation.
Figure 7
Figure 7
Identification of mirRNA that may target netrins. (a) Statistical distribution of mirRNA and Netrins. (b) MirRNA that are associated with at least three members of the netrin family. (c) The expression correlation heat map between 32 mirRNA and netrin family members in pan-cancer. Red mirRNAs have the potential to bind to NTN1, green mirRNAs have the potential to bind to NTN4, and orange mirRNAs have the potential to bind to NTNG1. The darker the color, the higher the correlation.
Figure 8
Figure 8
Netrin Cis-eQTLs in TCGA. (a) Distribution of netrin Cis-eQTLs in TCGA cancers and corresponding GWAS-related traits. NA indicates that it is not correlated with GWAS traits. (b) The distribution of NTN1, NTN5, and NTNG1 Cis-eQTLs and the corresponding GWAS-related traits in THCA and the possible mechanism of NTN1 eQTL in THCA.
Figure 9
Figure 9
Netrins in pathways and sensitivity to drugs. (a) Global percentage shows percentage of gene’s function (activation or inhibition) for each pathway in all cancers. (b) Heatmap show netrin family members that have function (inhibit or activate) in at least 5 cancer types. Pathway A represent activation of this pathway, inhibition in a similar way showed as pathway I. (c) Heatmap of drug sensitivity / tolerance of netrins with high expression.

Similar articles

Cited by

References

    1. Patel S, Ngounou WA, Darie CC, Clarkson BD. Cancer secretomes and their place in supplementing other hallmarks of cancer. Adv Exp Med Biol. 2014;806:409–442. doi: 10.1007/978-3-319-06068-2_20. - DOI - PubMed
    1. Greening DW, Gopal SK, Xu R, Simpson RJ, Chen W. Exosomes and their roles in immune regulation and cancer. Semin Cell Dev Biol. 2015;40:72–81. doi: 10.1016/j.semcdb.2015.02.009. - DOI - PubMed
    1. Lasser C, et al. Exosomes in the nose induce immune cell trafficking and harbour an altered protein cargo in chronic airway inflammation. J Transl Med. 2016;14:181. doi: 10.1186/s12967-016-0927-4. - DOI - PMC - PubMed
    1. Record M, Poirot M, Silvente-Poirot S. Emerging concepts on the role of exosomes in lipid metabolic diseases. Biochimie. 2014;96:67–74. doi: 10.1016/j.biochi.2013.06.016. - DOI - PubMed
    1. Salem KZ, et al. Exosomes in Tumor Angiogenesis. Methods Mol Biol. 2016;1464:25–34. doi: 10.1007/978-1-4939-3999-2_3. - DOI - PubMed

Publication types