. 2020 Mar 23;10(1):5241.
doi: 10.1038/s41598-020-62106-8.

Differential impact of the ERBB receptors EGFR and ERBB2 on the initiation of precursor lesions of pancreatic ductal adenocarcinoma

Affiliations

Differential impact of the ERBB receptors EGFR and ERBB2 on the initiation of precursor lesions of pancreatic ductal adenocarcinoma

Nora Meyers et al. Sci Rep. .

Abstract

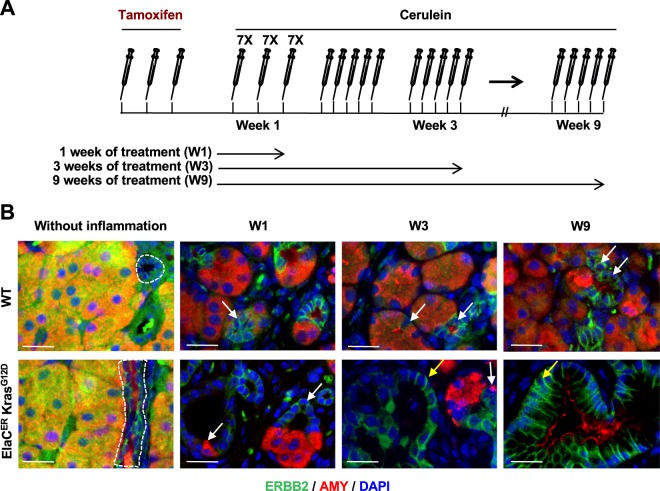
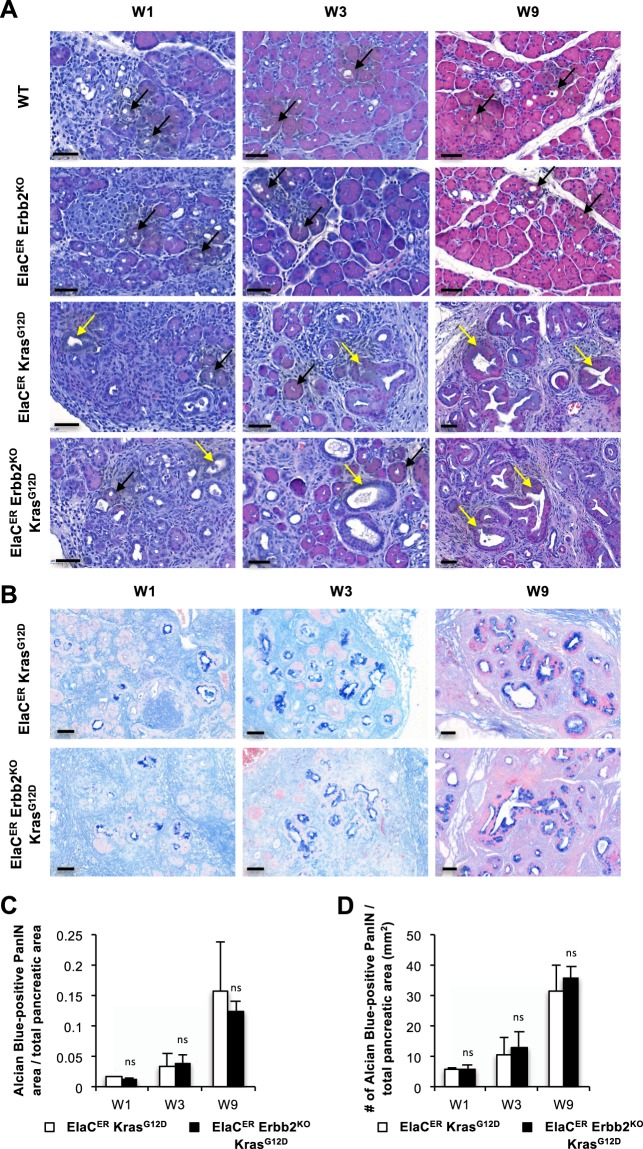
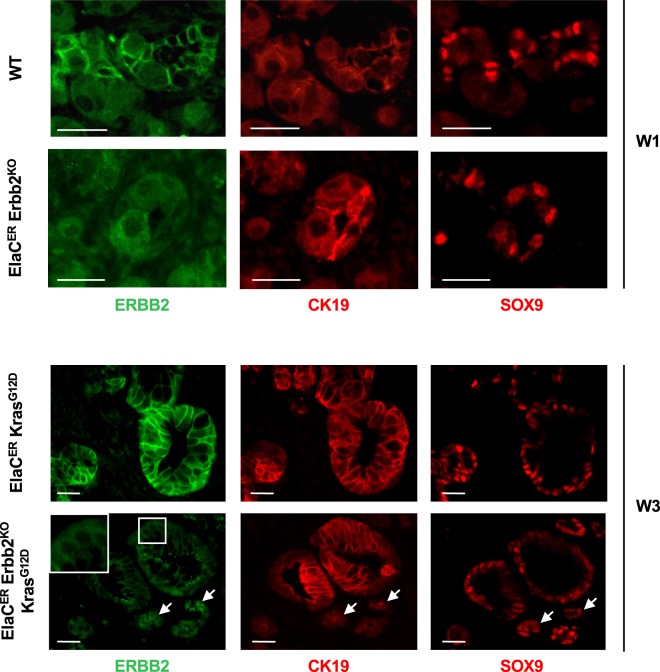
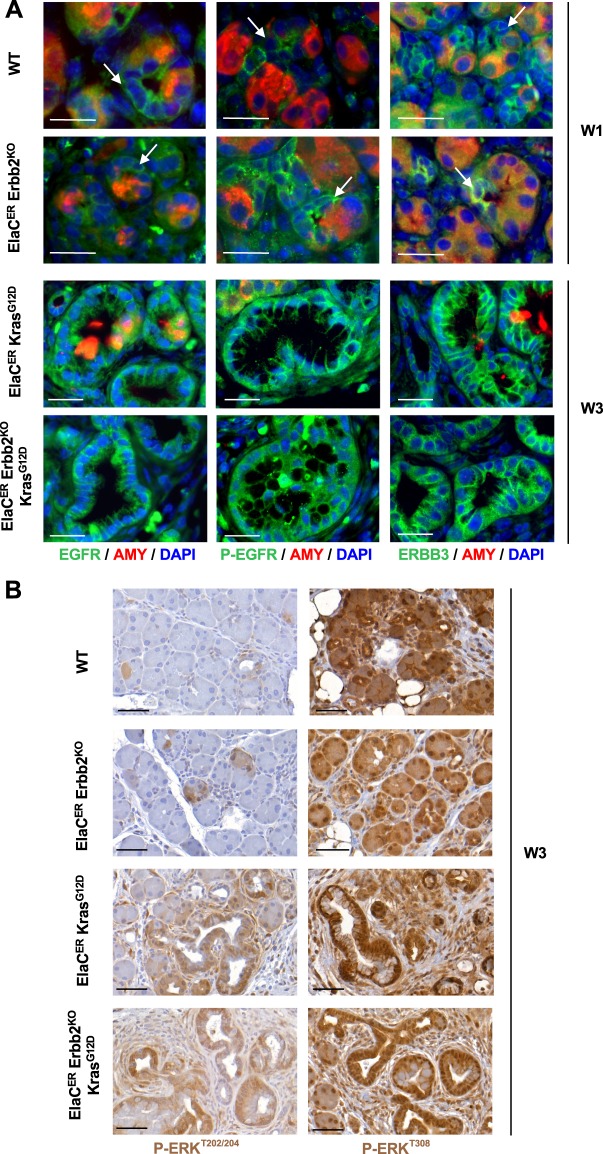
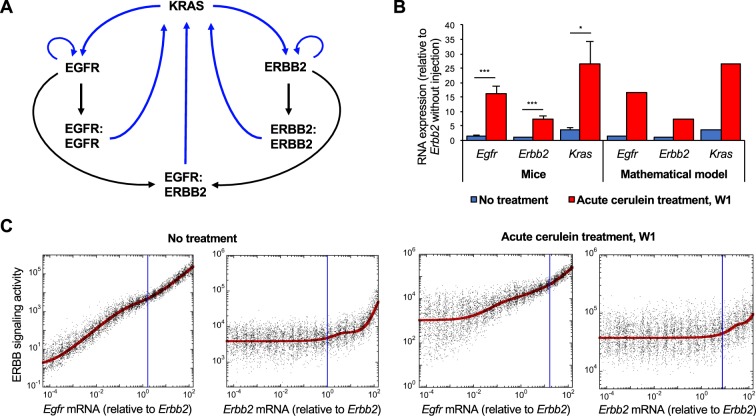
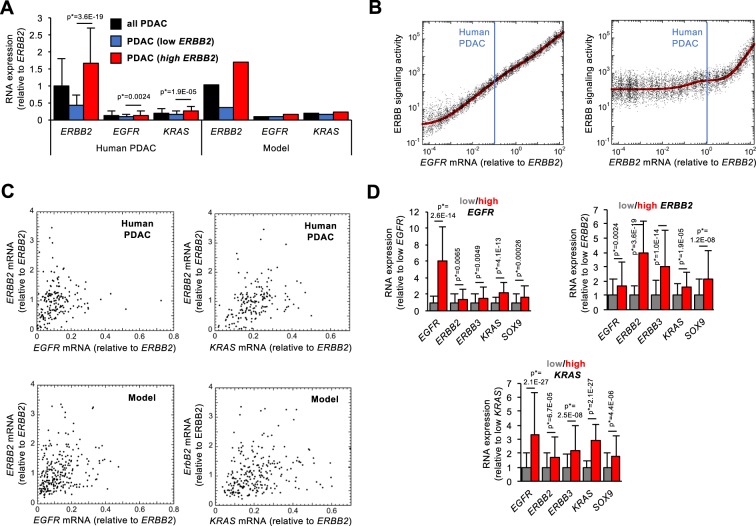
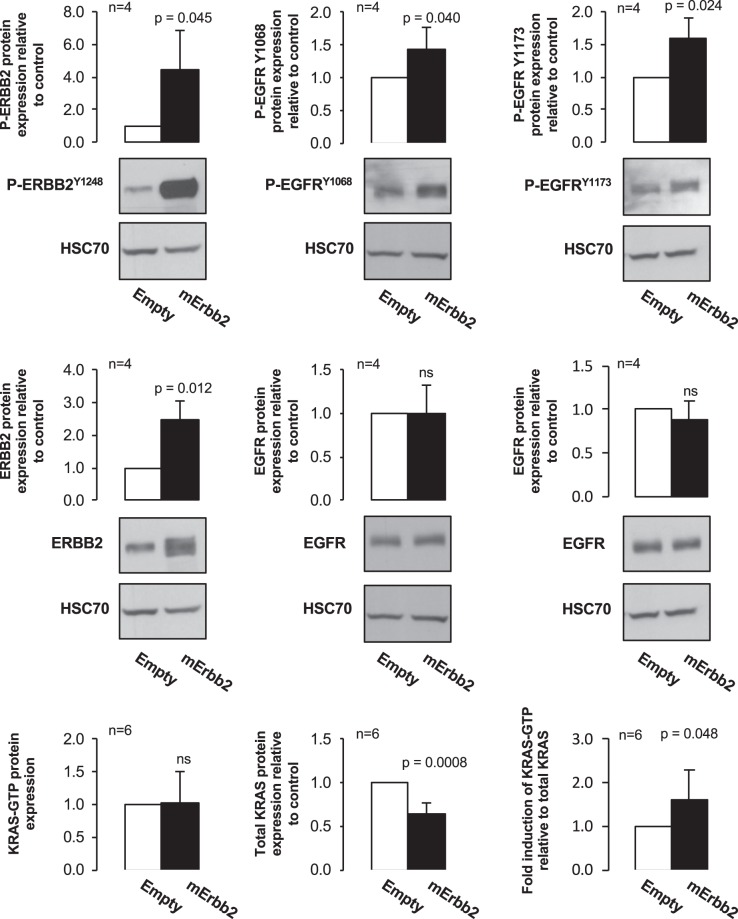
Earlier diagnosis of pancreatic ductal adenocarcinoma (PDAC) requires better understanding of the mechanisms driving tumorigenesis. In this context, depletion of Epidermal Growth Factor Receptor (EGFR) is known to impair development of PDAC-initiating lesions called acinar-to-ductal metaplasia (ADM) and Pancreatic Intraepithelial Neoplasia (PanIN). In contrast, the role of v-erb-b2 erythroblastic leukemia viral oncogene homolog 2 (ERBB2), the preferred dimerization partner of EGFR, remains poorly understood. Here, using a mouse model with inactivation of Erbb2 in pancreatic acinar cells, we found that Erbb2 is dispensable for inflammation- and KRasG12D-induced development of ADM and PanIN. A mathematical model of EGFR/ERBB2-KRAS signaling, which was calibrated on mouse and human data, supported the observed roles of EGFR and ERBB2. However, this model also predicted that overexpression of ERBB2 stimulates ERBB/KRAS signaling; this prediction was validated experimentally. We conclude that EGFR and ERBB2 differentially impact ERBB signaling during PDAC tumorigenesis, and that the oncogenic potential of ERBB2 is only manifested when it is overexpressed. Therefore, the level of ERBB2, not only its mere presence, needs to be considered when designing therapies targeting ERBB signaling.


Conflict of interest statement

The authors declare no competing interests.

Figures

Figure 1
Figure 1
ERBB2 is expressed in ADM and PanIN. (A) Schedule of tamoxifen and cerulein treatments. (B) Immunofluorescent labeling of ERBB2 and Amylase (AMY) in wild type (WT) and ElaCER KrasG12D mice without inflammation and after acute (1 week of cerulein treatment, W1) or chronic (W3 and W9) pancreatitis. ERBB2 expression is normally restricted to ductal cells (dotted lines) but is induced after inflammation in metaplastic acinar duct-like cells in WT and ElaCER KrasG12D mice (white arrows), and in PanIN in ElaCER KrasG12D mice (yellow arrow). DAPI is added to visualize cell nuclei. Scale bars = 50 μm.
Figure 2
Figure 2
ADM and PanIN formation does not require ERBB2. (A) Hematoxylin and eosin staining of WT, ElaCER Erbb2KO, ElaCER KrasG12D and ElaCER Erbb2KO KrasG12D mice after 1, 3 or 9 weeks of cerulein (W1, W3, W9) treatment. ADM (black arrows) and mild inflammation were present in all mice, and PanIN were detected in ElaCER KrasG12D and ElaCER KrasG12D Erbb2KO mice. Inflammation and PanIN grade increase with the duration of the treatment. Scale bars = 50 μm. (B) Alcian blue staining of ElaCER KrasG12D and ElaCER Erbb2KO KrasG12D mice after 1, 3 or 9 weeks of cerulein (W1, W3, W9) treatment. PanIN numbers increased with the duration of treatment but no significant difference was detected between the two genotypes. Scale bars = 50 μm. (C) The ratio of area of Alcian Blue-positive lesions to total pancreatic area increases progressively with the duration of cerulein treatment (W1, W3, W9). No significant difference is observed between the ElaCER KrasG12D mice and ElaCER Erbb2KO KrasG12D mice. (D) Number (#) of Alcian Blue-positive PanIN relative to total pancreatic area (mm2) in ElaCER KrasG12D and ElaCER Erbb2KO KrasG12D mice as a function of duration of cerulein treatment (W1, W3, and W9). No significant difference is observed between genotypes.
Figure 3
Figure 3
Erbb2 deletion is efficient and does not affect the expression of metaplastic markers. Immunofluorescent labeling of ERBB2, CK19 and SOX9 in WT and ElaCER Erbb2KO mice treated 1 week with cerulein (W1), and in ElaCER KrasG12D and ElaCER KrasG12D Erbb2KO mice treated 3 weeks with cerulein (W3). Efficient deletion of ERBB2 is detected in ElaCER Erbb2KO and ElaCER KrasG12D Erbb2KO mice. Inset in the ElaCER KrasG12D Erbb2KO panel shows that the ERBB2 labeling is cytoplasmic and non-specific. Expression of the metaplastic markers CK19 and SOX9 is observed in ductal cells (white arrows) which also express ERBB2 as well as in duct-like cells and PanIN. Scale bars = 50 μm.
Figure 4
Figure 4
ERBB family members and downstream effectors of ERBB signaling are not affected by Erbb2 loss. (A) Immunofluorescent labeling for EGFR, P-EGFR, ERBB3, and Amylase in WT and ElaCER Erbb2KO mice treated for 1 week with cerulein (W1) and in ElaCER KrasG12D and ElaCER Erbb2KO KrasG12D mice treated for 3 weeks with cerulein (W3). EGFR and ERBB3 are both expressed, and EGFR is activated in ADM in WT and ElaCER Erbb2KO pancreas (white arrows) and in PanIN present in ElaCER KrasG12D and ElaCER Erbb2KO KrasG12D pancreas. DAPI staining visualizes cell nuclei. Scale bars = 50 μm. (B) Immunohistochemical staining for P-ERKT202/204 and P-AKTT308 after 3 weeks of cerulein treatment (W3). Similar proportions of ADM are positive for P-ERK and P-AKT in WT and ElaCER Erbb2KO mice whereas a large number of PanIN are stained by both antibodies in ElaCER KrasG12D and ElaCER KrasG12D Erbb2KO mice. High activity of the AKT pathway is detected in the pancreata of the different genotypes. Scale bars = 50 μm.
Figure 5
Figure 5
Impact of ERBB2 expression on the activity of ERBB signaling pathway in mice. (A) Scheme of the minimal molecular network defining the regulations between KRAS, EGFR, and ERBB2. (B) Relative RNA expression levels of mouse Egfr, Erbb2 and Kras in the absence (blue bars) or in the presence of acute cerulein treatment (red bars), as determined experimentally in mice (left) and predicted by mathematical modeling (right). Expression data are mean +/− SD, n ≥ 3. *, p < 0.05 and *** p < 0.001. (C) Modeling ERBB signaling activity (red curves) as a function of Egfr or Erbb2 mRNA in the absence (left panels) or in the presence of acute cerulein treatment (right panels). Each black dot represents a cell in a heterogeneous cell population where 50% of uniform random variations are considered around the basal value of each parameter (see Supplementary Information for details). Vertical blue lines correspond to the measured mean expression levels of Egfr and Erbb2 with or without inflammation as shown in (B). These expression levels are relative to Erbb2 expression in the absence of treatment.
Figure 6
Figure 6
Impact of EGFR and ERBB2 expression on ERBB signaling activity in human PDAC. (A) Left: RNA expression of EGFR, ERBB2 and KRAS in all PDAC from TCGA (black bars, n = 178), in tumors with lowest (n = 50, blue bars) or highest (n = 50, red bars) ERBB2 expression. Right: Calibration of the mathematical model on the RNA expression levels available in TCGA. mRNA expression levels were normalized to the mean expression level of ERBB2 mRNA in all PDAC. (B) Modeling the predicted impact of EGFR and ERBB2 expression levels on ERBB signaling activity in human PDAC (red curves). Each black dot is a PDAC patient of a heterogeneous population where 50% of uniform random variations are considered around the basal value of each parameter. Vertical blue lines correspond to the expression levels of EGFR and ERBB2 (relative to the mean ERBB2 expression in all tumors). For (A,B), parameter values are described in Supplementary Information. (C) Expression levels of ERBB2 as a function of EGFR (left) or KRAS (right) in all human PDAC (upper panels, n = 178) and in the mathematical model for a heterogeneous population of 250 PDAC patients with 50% of random uniform variations of parameter values (bottom panels). (D) RNA expression levels in tumors with lowest (n = 50, grey bars) or highest (n = 50, red bars) expression of EGFR (left), ERBB2 (middle) or KRAS (right). Data are means +/− SD. p* values were adjusted with Benjamini-Hochberg corrections considering the entire transcriptome.
Figure 7
Figure 7
ERBB2 overexpression partially impacts ERBB signaling activity. Representative immunoblots of proteins extracted from PANC1 cells infected with empty or mErbb2 lentiviruses. Levels of ERBB2, EGFR and their phosphorylated forms, as well as the KRAS-GTP/KRAS ratio, were quantified; they increased significantly after mErbb2 lentiviral infection. Fold inductions are mentioned as mean +/− SD; ns, p > 0.05. Phosphorylated and non-phosphorylated forms of ERBB2 and EGFR were detected on the same blots. Consequently, HSC70 loading controls were the same. Blots were cropped and full-lengt blots are avaible in Supplementary Figs. S13 to S15.

Similar articles

Cited by

References

    1. Ryan DP, Hong TS, Bardeesy N. Pancreatic adenocarcinoma. N Engl J Med. 2014;371:2140–2141. doi: 10.1056/NEJMc1412266. - DOI - PubMed
    1. Guerra C, et al. Chronic pancreatitis is essential for induction of pancreatic ductal adenocarcinoma by K-Ras oncogenes in adult mice. Cancer Cell. 2007;11:291–302. doi: 10.1016/j.ccr.2007.01.012. - DOI - PubMed
    1. Guerra C, Barbacid M. Genetically engineered mouse models of pancreatic adenocarcinoma. Mol Oncol. 2013;7:232–247. doi: 10.1016/j.molonc.2013.02.002. - DOI - PMC - PubMed
    1. Prevot PP, et al. Role of the ductal transcription factors HNF6 and Sox9 in pancreatic acinar-to-ductal metaplasia. Gut. 2012;61:1723–1732. doi: 10.1136/gutjnl-2011-300266. - DOI - PMC - PubMed
    1. Rooman I, Real FX. Pancreatic ductal adenocarcinoma and acinar cells: a matter of differentiation and development? Gut. 2012;61:449–458. doi: 10.1136/gut.2010.235804. - DOI - PubMed

Publication types

MeSH terms