. 2020 Jun;21(6):615-625.
doi: 10.1038/s41590-020-0646-0. Epub 2020 Apr 6.

Blocking elevated p38 MAPK restores efferocytosis and inflammatory resolution in the elderly

Affiliations

Blocking elevated p38 MAPK restores efferocytosis and inflammatory resolution in the elderly

Roel P H De Maeyer et al. Nat Immunol. 2020 Jun.

Erratum in

Abstract

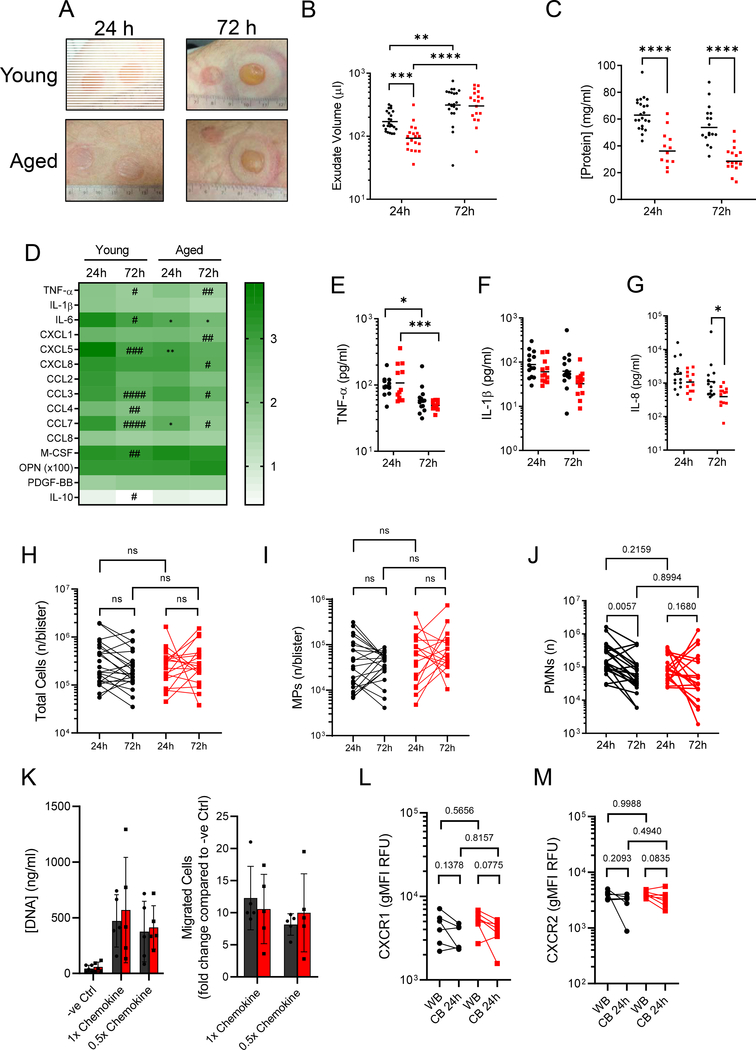
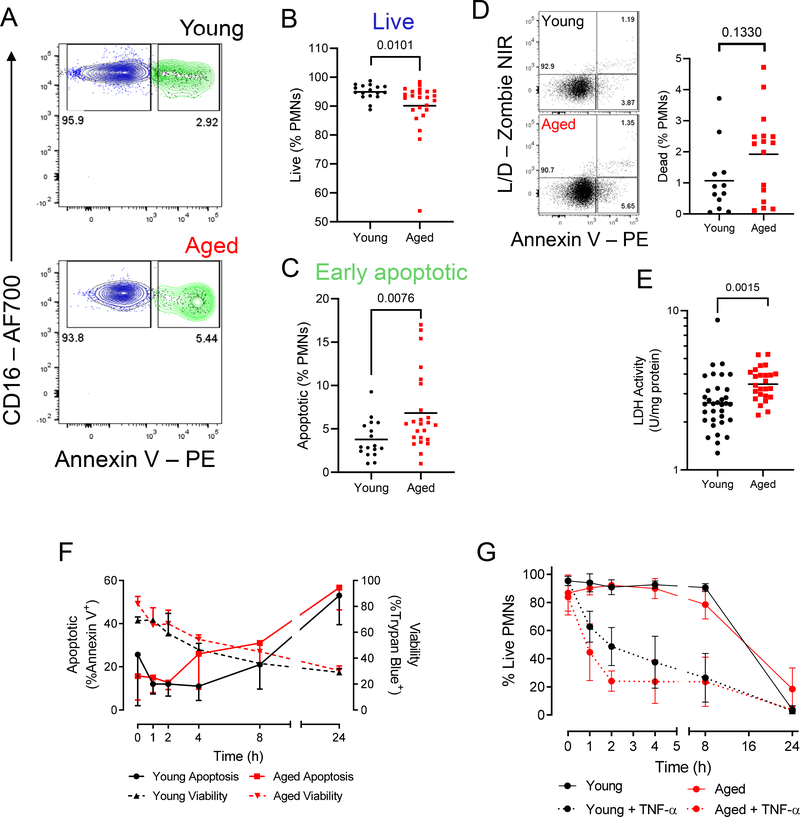
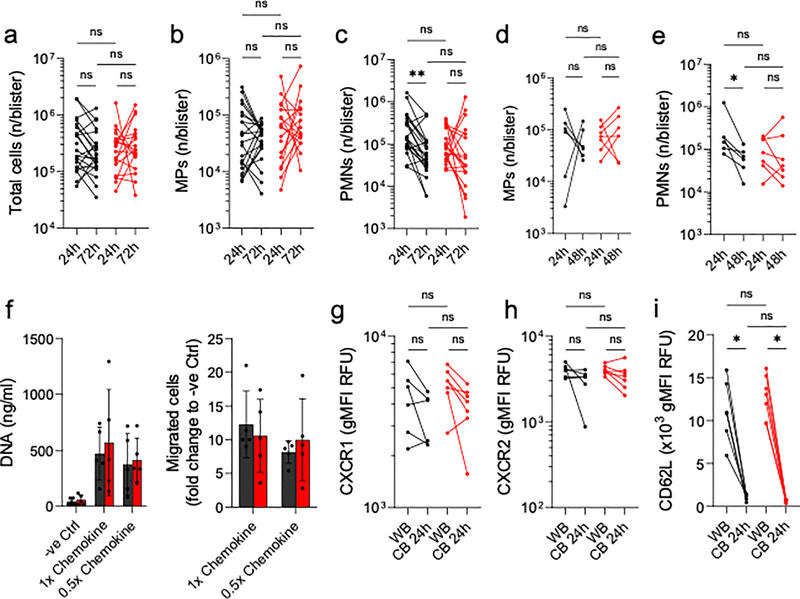
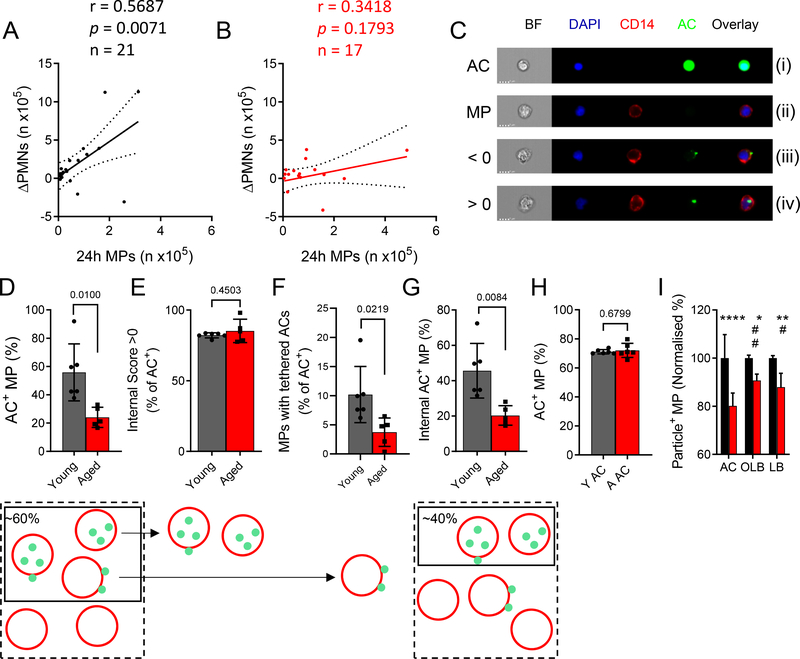
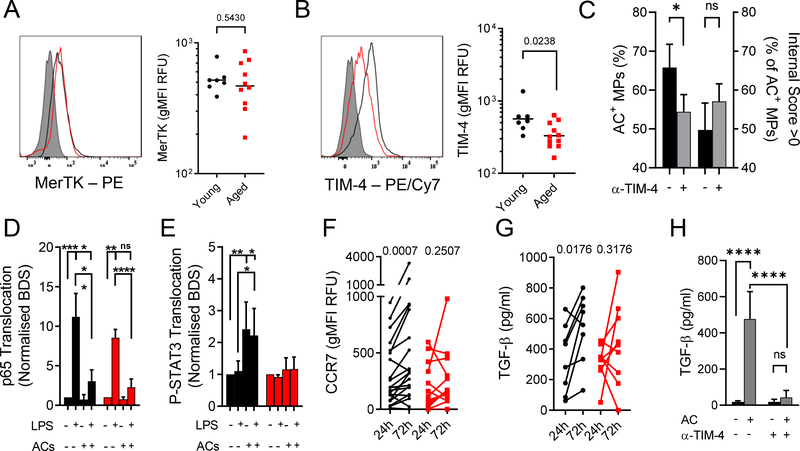
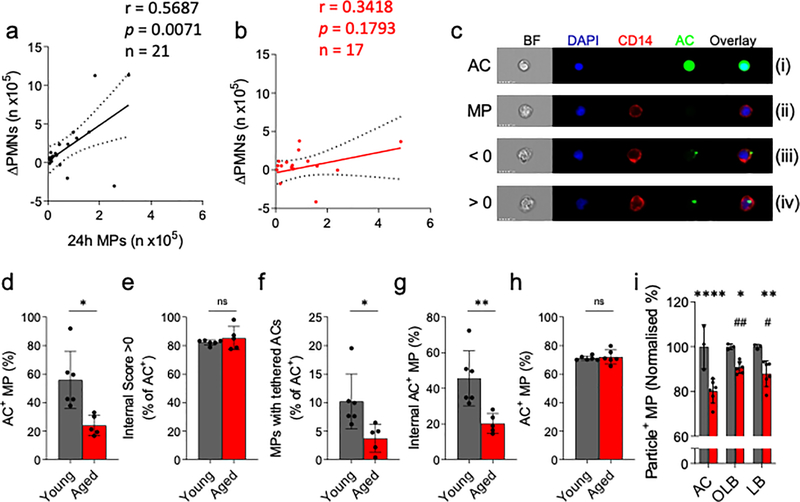
Increasing age alters innate immune-mediated responses; however, the mechanisms underpinning these changes in humans are not fully understood. Using a human dermal model of acute inflammation, we found that, although inflammatory onset is similar between young and elderly individuals, the resolution phase was substantially impaired in elderly individuals. This arose from a reduction in T cell immunoglobulin mucin receptor-4 (TIM-4), a phosphatidylserine receptor expressed on macrophages that enables the engulfment of apoptotic bodies, so-called efferocytosis. Reduced TIM-4 in elderly individuals was caused by an elevation in macrophage p38 mitogen-activated protein kinase (MAPK) activity. Administering an orally active p38 inhibitor to elderly individuals rescued TIM-4 expression, cleared apoptotic bodies and restored a macrophage resolution phenotype. Thus, inhibiting p38 in elderly individuals rejuvenated their resolution response to be more similar to that of younger people. This is the first resolution defect identified in humans that has been successfully reversed, thereby highlighting the tractability of targeting pro-resolution biology to treat diseases driven by chronic inflammation.


Conflict of interest statement

Competing interest declaration

MU is an employee of AstraZeneca and holds share in the company.

The other authors declare no competing interest.

Figures

Figure 1:
Figure 1:. Cantharidin skin blisters reveal impaired neutrophil clearance in old humans.
A) Representative photographs of cantharidin skin blisters at 24 h and 72 h on young and aged participants. Ruler shows diameter in cm. B) Blister exudate volume determined by weight (n = 25 young, n = 22 aged). C) Total blister protein concentration determined by Bradford assay (n = 22 young at 24 h, 17 at 72 h. n = 12 aged at 24 h, 17 at 72 h.). D) Multiplex ELISA was used to quantify levels of 15 cytokines in cell-free cantharidin blister exudates and these are shown as a log-transformed heatmap (log[pgml]). # denotes temporal, within age-group differences per analyte, * denotes differences between age-groups for the given time point (n = 13 young, n = 12 aged). E) TNF-α, F) IL-1β and G) IL-8 (CXCL8) (n = 13 young, n = 12 aged). F) Data are shown as a log-transformed heatmap of all 14 ELISA analytes in cell-free cantharidin blister exudate (log[pg/ml]). H) Total cell counts per blister determined by haemocytometer (n = 24 young, 20 aged). Polychromatic flow cytometry was performed to identify I) mononuclear phagocytes (MPs) and J) neutrophils (PMNs) in cantharidin blisters from young and aged volunteers at 24 h and 72 h (n = 22 young, 20 aged). K) 15 minute in vitro migration assays were performed on isolated peripheral blood PMNs. Flow cytometry was used to determine L) CXCR1 and M) CXCR2 expression on PMNs in peripheral blood (WB) and 24 hour cantharidin blister exudates. All plots show young in black and aged in red. Lognormally distributed data are plotted on a log scale, with the geometric mean. Normally distributed data are plotted on a linear scale with the arithmetic mean. For statistical analyses, lognormally distributed data were log-transformed. Each symbol represents a sample from a single participant. B-M) Two-way ANOVA with Sidak’s multiple comparisons post-test correction. ns p > 0.05 * p <0.05, ** p < 0.01 *** p < 0.001, **** p < 0.0001 or calculated p values values.
Figure 2:
Figure 2:. Apoptotic neutrophils accumulate in cantharidin skin blisters of the elderly, but apoptosis is unimpaired.
A) Representative dot plots for a young (top panel) and old (bottom panel) donor of a cantharidin skin blister sample at 24h, gated on Lin-HLA-DR- cells, showing CD16 expression and Annexin V binding. B) Live CD16hiAnnexin V- cells and C) apoptotic, CD16hiAnnexin V+ granulocytes are shown as a proportion of total granulocytes. Each symbol represents a sample from a single participant (n = 17 young, 24 old). D) Proportion of blister PMNs positive for a viability dye (n = 12 young, 16 old). E) Lactate dehydrogenase (LDH) measured in cell-free cantharidin blister exudate at 24 h (n = 34 young, 20 old). B-D) Mann-Whitney U test. E) Unpaired Student’s t test with Welch’s correction on log-transformed data. p values shown. F) Time-course of spontaneous ex vivo neutrophil apoptosis detected by annexin V binding (left y-axis, full lines) and death measured by a trypan blue viability stain (right y-axis, dotted lines). G) TNF-α inducible neutrophil apoptosis measured by cell viability over a 24 h time course. F-G show means and s.d. (n = 3 per group). Multiple unpaired t tests with Holm-Sidak correction. No significance (p < 0.05) detected.
Figure 3:
Figure 3:. Efferocytosis is impaired in the elderly
Scatter plots for A) young (n = 21) and B) aged (n = 17) donor neutrophil clearance (expressed as 24 h – 72 h PMN numbers per blister) against 24 h MP infiltrates. Pearson correlations were carried out and a best-fit line with 95% confidence interval is given. C) Representative ImageStreamX images from an ex vivo efferocytosis assay using blister MPs (stained with CD14, red) and autologous, blood-derived apoptotic ACs (green) at a ratio of 5:1 ACs:MPs. Shown are images of a CFSE-stained apoptotic cell (AC), an AC-negative MP (MP), and MPs that have bound to an AC (<0) or that have ingested an AC (>0). Summary data of D) MPs that have associated with ACs (internal and external), E) the proportion of AC+ MPs that have ingested their targets, F) the proportion of AC+ MPs with bound-only ACs, and G) the overall proportion of MPs that have internalised ACs (n = 6 young, n = 5 aged). H) MPs were given ACs from young (Y AC) or aged (aged AC) donors and the overall efferocytic capacity was evaluated (n = 6). I) MP phagocytosis of ACs, opsonised latex beads (OLB) and naïve latex beads (LB) was compared using young and aged MPs. Phagocytosis of each target by young MPs was set to 100% (n = 3 young, n = 6 aged). D-H) Unpaired Student’s t tests with Welch’s correction. I) Two-way ANOVA with Sidak’s multiple comparisons post-correction. * p < 0.05, ** p < 0.01, *** p < 0.001, **** p < 0.0001. # denotes significant differences within the aged cohort.
Figure 4:
Figure 4:. Reduced TIM-4 expression results in a failure to undergo resolution signalling in MPs from the elderly
Cell surface expression of A) MerTK and B) TIM-4 was determined by flow cytometry on MPs isolated from 24 h cantharidin blisters. For each marker, representative histograms are shown (grey: FMO control, black: young, red: aged). Summary data are shown on a logarithmic scale. Each symbol represents a single participant (n = 7 young, n = 11 aged). C) TIM-4 binding was inhibited using a polyclonal blocking antibody (5 μg/ml) and MP efferocytosis was compared between control and anti-TIM-4 (n = 3). Left y-axis shows overall AC+ events, right y-axis shows internalization score. Imaging cytometry was used to determine nuclear translocation of D) NFκB (p65 subunit) and E) P-STAT3. Bright Detail Similarity (BDS) scores were calculated and untreated (ctrl) samples for each respective age group were set to 1 (n = 8 young, n = 4 aged). F) Cell surface expression of CCR7 was determined by flow cytometry on cantharidin blister MPs (n = 20 young, n = 14 aged). G) TGF-β levels in cell-free cantharidin blister exudates were measured by ELISA (n = 8 young, n = 9 aged). H) Blood-derived, cultured MPs were pre-treated with 10 μg/ml polyclonal α-TIM-4 antibody or vehicle for 30 min before challenge with ACs (3:1) for 24 h. TGF-β levels were determined in cell-free culture supernatants (n = 3). A-C unpaired Student’s t test. D-E, H Two-way ANOVA with Sidak’s multiple comparisons post-correction. F-G Paired Student’s t tests within age groups. * p < 0.05, ** p < 0.01, *** p < 0.001, **** p < 0.0001, or actual p values.
Figure 5:
Figure 5:. TIM-4 expression is regulated by p38 and p300.
Expression of TIM-4 was measured in young (black) and aged (red) donors by A) polychromatic flow cytometry on peripheral blood samples, gated on CD14+CD16- monocytes, and B) qRT-PCR on isolated monocytes (n = 7 young, 4 old). C) Chromatin immunoprecipitation on isolated peripheral blood monocytes using antibodies against p300 and H3K27 acetylation marks. Two different sites, locations shown in the diagram, of the tim4 promoter were amplified (n = 2 per group). D) Phosflow analysis of P-p38 expression in 24h cantharidin blister MPs and PMNs (n = 8 per group). E) Immunofluorescence of frozen, OCT-fixed whole skin sections obtained by punch biopsy (5 mm diameter). Sections were stained with P-p38 (green), CD163 (red), and DAPI (blue). Enumeration of F) total CD163+ macrophages in naïve skin and G) the proportion of P-p38+ macrophages (n = 9 young, 8 old). H) TIM-4 expression was assessed by flow cytometry on MPs cultured with 10 μg/ml LPS with and without 3 μM losmapimod over time (n = 3). I) Efferocytosis assay on MPs cultured for 72 h with or without losmapimod treatment (n = 7). J-K) MPs were treated with 10 μg/ml LPS with/without 3 μM losmapimod and the p300 inhibitors C646 and SGC-CBP30 (2.5 μM and 5 μM respectively). J) Chromatin immunoprecipitation using anti-H3K27Ac on cultured for 24 h (n = 2 pooled donors). K) Representative flow cytometry analysis of TIM-4 expression on MPs cultured for 72 h. Summary data of TIM-4, CD14 expression (left y-axis) and efferocytosis (right y-axis). Data were normalised to LPS alone for each donor (n = 5–8 per group). A-B, D-G) Unpaired Student’s t test. C) Two-way ANOVA with Tukey’s correction. H-I) Paired Student’s t test. K) One-way ANOVA with Sidak’s correction. Significance was tested with respect to LPS alone. * p < 0.05, ** p < 0.01.
Figure 6:
Figure 6:. Blocking p38-driven inflamm-ageing in elderly humans restores inflammatory resolution.
A) The effects of losmapimod (15mg BID/PO for 4 days) on inflammation induced by topical application of cantharidin (0.1% w/v) to the skin were investigated in healthy old subjects (>65 years old, n=11, 6 female, 5 male). Levels of TNF-α in B) serum collected pre- and post-losmapimod treatment (n = 11), and C) 24 hour cell-free cantharidin blister exudates (n = 7) were measured by cytometric bead array. D) 24 hour cantharidin blister PMNs were enumerated by flow cytometry (n = 8). E) Representative dot plots for a cantharidin skin blister sample at 24h from an old subject without and with exposure to losmapimod gated on Lin-HLA-DR- cells, showing CD16 expression and Annexin V binding; summary data are shown in the right-hand panel (n = 8). F) LDH activity levels in cell-free cantharidin blister exudates were measured by colorimetric assay (n = 9–34 per group, two-way ANOVA relative to the aged cohort. Holm-Sidak correction). Cell surface expression of G) TIM-4 and H) MerTK was determined by flow cytometry on MPs isolated from cantharidin blisters in the same subjects. (n=5). I) Scatter plots for young (n = 5, black), untreated aged (n = 9, red) and losmapimod-treated aged (n = 11, blue) donor neutrophil clearance (expressed as 24 h – 72 h PMN numbers per blister) against 24 h MP infiltrates. Pearson correlations were carried out and a best-fit line is given. J) Cell surface expression of CCR7 was determined by flow cytometry on cantharidin blister MPs from the same subjects exposed to cantharidin twice, once with and once without losmapimod (n=5). K) 72 h cell-free blister exudate levels of TGF-β were measured by ELISA (n = 5 per group). All plots show young in black, aged in red and aged+losmapimod in blue. B-D, G-H, J-K) Two-tailed Student’s t tests. E) Wilcoxon test. * p < 0.05, ** p < 0.01, *** p < 0.001 or calculated p values.

References

    1. Partridge L, Deelen J & Slagboom EP Facing up to the global challenges of ageing. Nature 561, 45–56 (2018). - PubMed
    1. Thompson WW et al. Mortality Associated With Influenza and Respiratory Syncytial Virus in the United States. Jama 289, 179–186 (2003). - PubMed
    1. Goodwin K, Viboud C & Simonsen L Antibody response to influenza vaccination in the elderly: A quantitative review. Vaccine 24, 1159–1169 (2006). - PubMed
    1. Shaw AC, Goldstein DR & Montgomery RR Age-dependent dysregulation of innate immunity. Nature reviews. Immunology 13, 875–87 (2013). - PMC - PubMed
    1. Franceschi C et al. Inflamm-aging. An evolutionary perspective on immunosenescence. Annals of the New York Academy of Sciences 908, 244–54 (2000). - PubMed

Publication types

MeSH terms