

The art of obtaining a high yield of cell-free DNA from urine
- PMID: 32251424
- PMCID: PMC7135229
- DOI: 10.1371/journal.pone.0231058
The art of obtaining a high yield of cell-free DNA from urine
Abstract
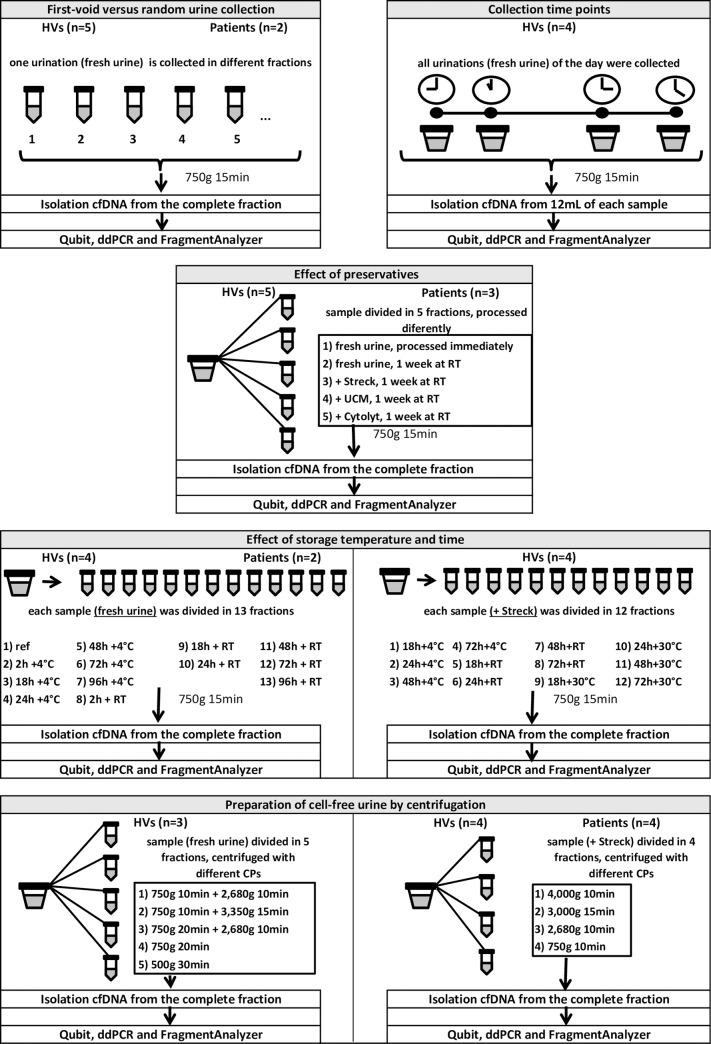
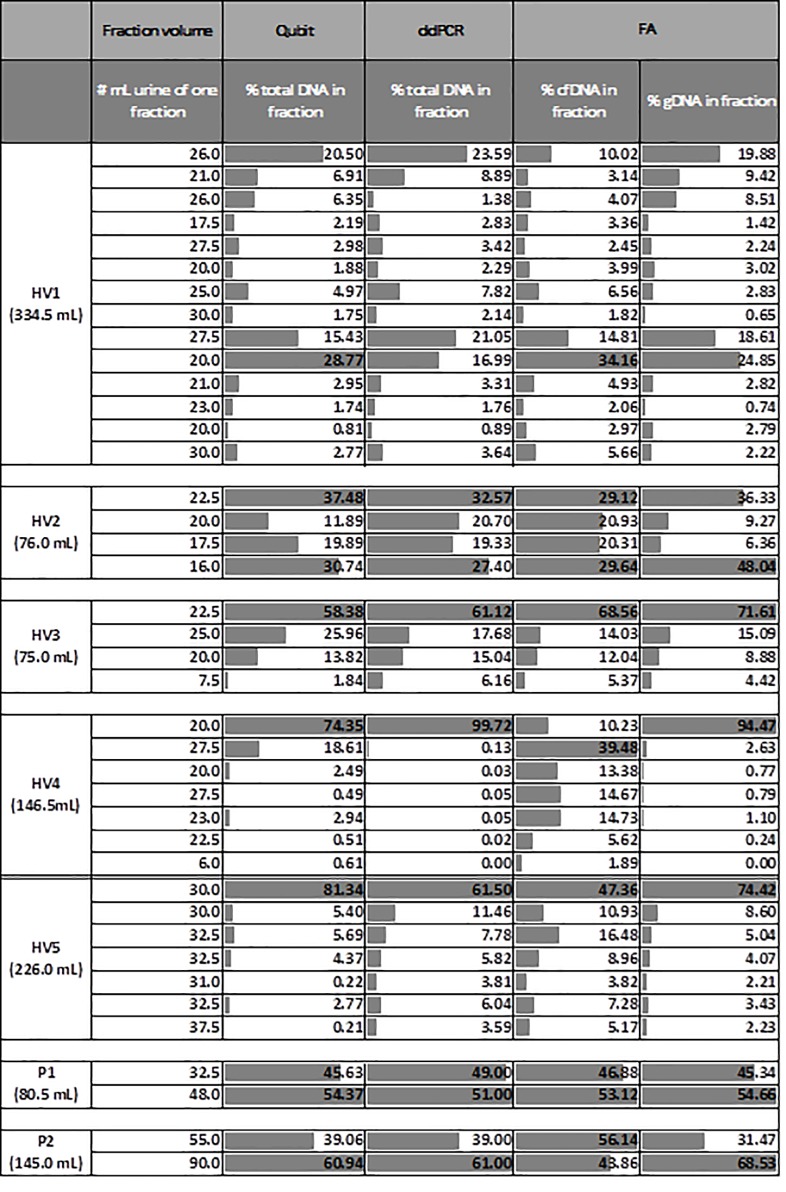
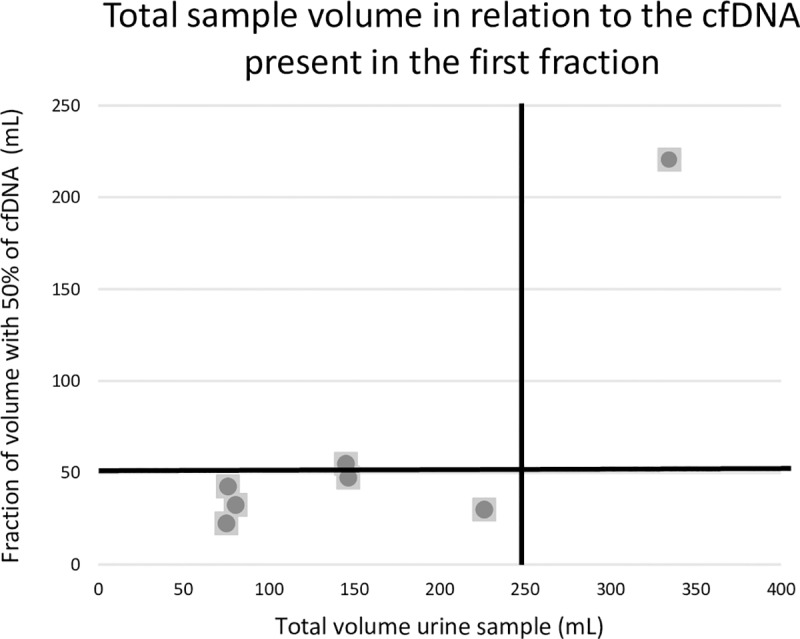
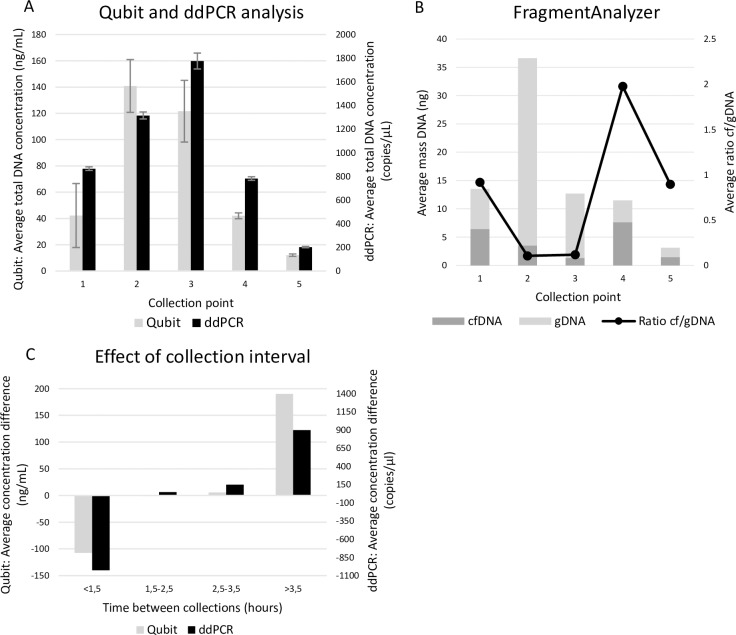
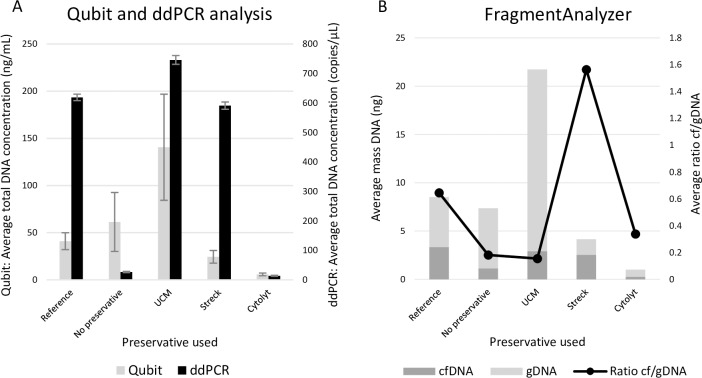
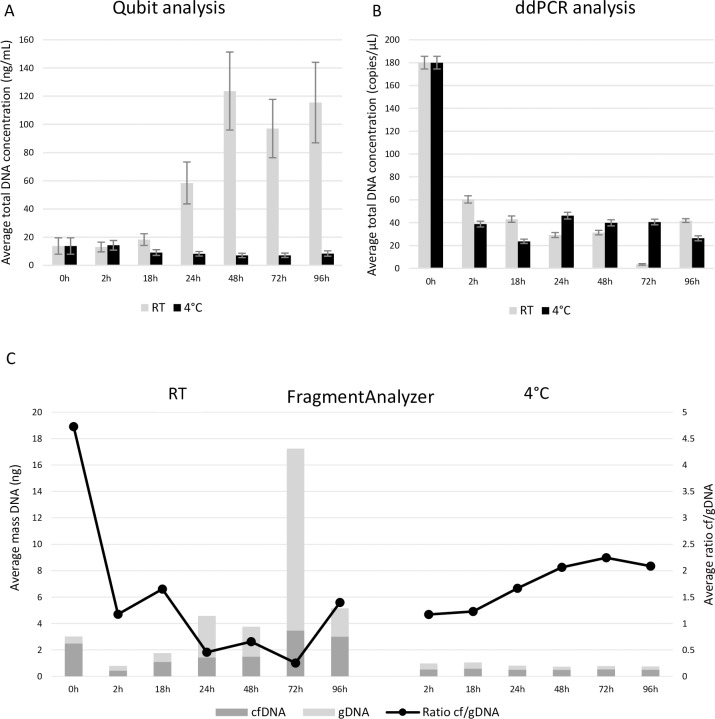
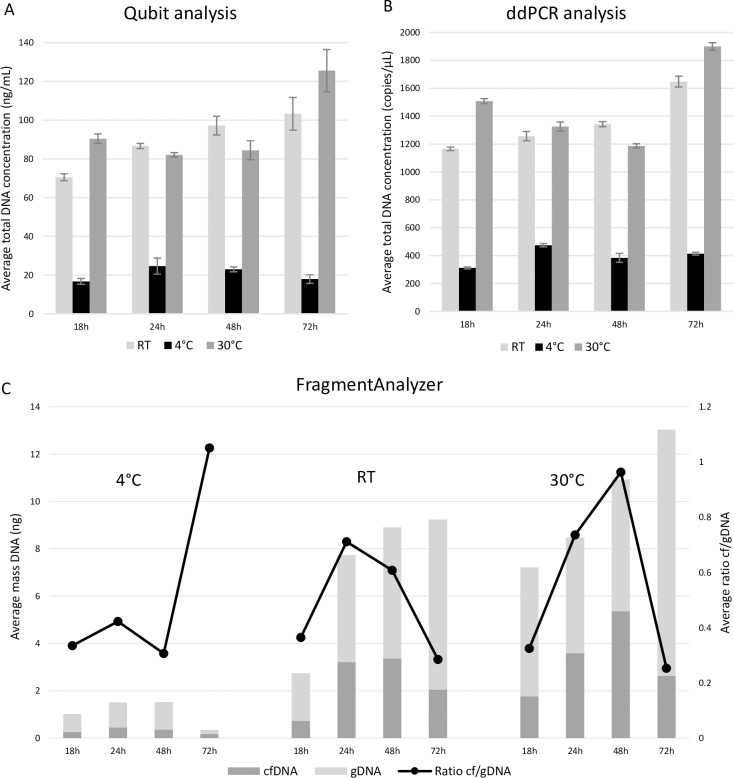
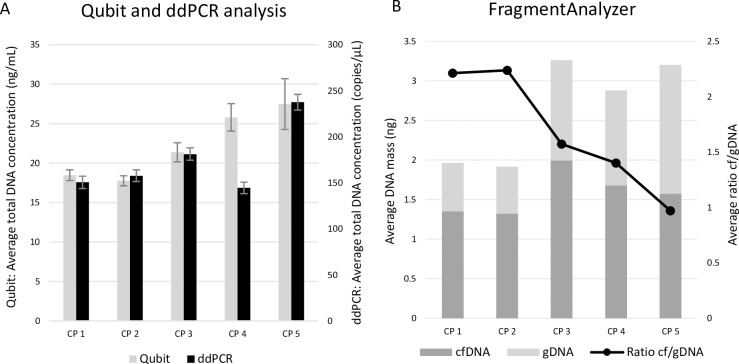
Although liquid biopsies offer many advantages over tissue biopsies, they are not yet standard practice. An important reason for the lack of implementation is the unavailability of well standardized techniques and guidelines, especially for pre-analytical conditions which are an important factor causing the current sensitivity issues. To overcome these limitations, we investigated the effect of several pre-analytical conditions on the concentration of cell-free DNA (cfDNA) and cellular genomic DNA (gDNA) contamination. Urine samples from healthy volunteers (HVs) and cancer patients were collected and processed according to specific pre-analytical conditions. Our results show that in samples with a relatively small volume more than 50% of the cfDNA can be found in the first 50 mL of the urine sample. The total DNA concentration increased again when samples were collected more than 3.5 hours apart. Adding preservative to urine samples is recommended to obtain high concentrations of cfDNA. To remove the cellular content, high speed centrifugation protocols as 4,000g 10min or 3,000g 15min are ideal for urine collected in cfDNA Urine Preserve (Streck). Although this study was a pilot study and needs to be confirmed in a larger study population, clear trends in the effect of several pre-analytical conditions were observed.
Conflict of interest statement
The authors have declared that no competing interests exist.
Figures
Similar articles
-
Investigation of Preanalytical Variables Impacting Pathogen Cell-Free DNA in Blood and Urine.J Clin Microbiol. 2019 Oct 23;57(11):e00782-19. doi: 10.1128/JCM.00782-19. Print 2019 Nov. J Clin Microbiol. 2019. PMID: 31511335 Free PMC article.
-
Quantification of circulating cell-free DNA (cfDNA) in urine using a newborn piglet model of asphyxia.PLoS One. 2019 Dec 31;14(12):e0227066. doi: 10.1371/journal.pone.0227066. eCollection 2019. PLoS One. 2019. PMID: 31891615 Free PMC article.
-
Ultrasensitive hybridization capture: Reliable detection of <1 copy/mL short cell-free DNA from large-volume urine samples.PLoS One. 2021 Feb 26;16(2):e0247851. doi: 10.1371/journal.pone.0247851. eCollection 2021. PLoS One. 2021. PMID: 33635932 Free PMC article.
-
Non-blood sources of cell-free DNA for cancer molecular profiling in clinical pathology and oncology.Crit Rev Oncol Hematol. 2019 Sep;141:36-42. doi: 10.1016/j.critrevonc.2019.06.005. Epub 2019 Jun 7. Crit Rev Oncol Hematol. 2019. PMID: 31212145 Review.
-
Dipstick analysis of urine chemistry: benefits and limitations of dry chemistry-based assays.Postgrad Med. 2020 Apr;132(3):225-233. doi: 10.1080/00325481.2019.1679540. Epub 2019 Oct 19. Postgrad Med. 2020. PMID: 31609156 Review.
Cited by
-
Deep sequencing of DNA from urine of kidney allograft recipients to estimate donor/recipient-specific DNA fractions.PLoS One. 2021 Apr 15;16(4):e0249930. doi: 10.1371/journal.pone.0249930. eCollection 2021. PLoS One. 2021. PMID: 33857204 Free PMC article.
-
Serial profiling of cell-free DNA and nucleosome histone modifications in cell cultures.Sci Rep. 2021 May 4;11(1):9460. doi: 10.1038/s41598-021-88866-5. Sci Rep. 2021. PMID: 33947882 Free PMC article.
-
New Perspectives on the Importance of Cell-Free DNA Biology.Diagnostics (Basel). 2022 Sep 3;12(9):2147. doi: 10.3390/diagnostics12092147. Diagnostics (Basel). 2022. PMID: 36140548 Free PMC article. Review.
-
Stability, enrichment, and quantification of total and HPV16-specific IgG present in first-void urine.Sci Rep. 2024 Jun 23;14(1):14441. doi: 10.1038/s41598-024-65257-0. Sci Rep. 2024. PMID: 38910149 Free PMC article.
-
Unlocking the potential of tumor-derived DNA in urine for cancer detection: methodological challenges and opportunities.Mol Oncol. 2025 Jul;19(7):1918-1934. doi: 10.1002/1878-0261.13628. Epub 2024 Mar 10. Mol Oncol. 2025. PMID: 38462745 Free PMC article. Review.
References
-
- Lindeman NI, Cagle PT, Aisner DL, Arcila ME, Beasley MB, Bernicker EH, et al. Updated Molecular Testing Guideline for the Selection of Lung Cancer Patients for Treatment With Targeted Tyrosine Kinase Inhibitors: Guideline From the College of American Pathologists, the International Association for the Study of Lung Cancer, and the Association for Molecular Pathology. J Mol Diagn 2018, 20:129–159. 10.1016/j.jmoldx.2017.11.004 - DOI - PubMed
-
- Kalemkerian GP, Narula N, Kennedy EB, Biermann WA, Donington J, Leighl NB, et al. Molecular Testing Guideline for the Selection of Patients With Lung Cancer for Treatment With Targeted Tyrosine Kinase Inhibitors: American Society of Clinical Oncology Endorsement of the College of American Pathologists/International Association for the Study of Lung Cancer/Association for Molecular Pathology Clinical Practice Guideline Update. J Clin Oncol 2018, 36:911–919. 10.1200/JCO.2017.76.7293 - DOI - PubMed
-
- Sepulveda AR, Hamilton SR, Allegra CJ, Grody W, Cushman-Vokoun AM, Funkhouser WK, et al. Molecular Biomarkers for the Evaluation of Colorectal Cancer: Guideline From the American Society for Clinical Pathology, College of American Pathologists, Association for Molecular Pathology, and the American Society of Clinical Oncology. J Clin Oncol 2017, 35:1453–1486. 10.1200/JCO.2016.71.9807 - DOI - PubMed
Publication types
MeSH terms
Substances
LinkOut - more resources
Full Text Sources
Other Literature Sources
Medical
Miscellaneous
