. 2020 Apr 6;16(4):e1008477.
doi: 10.1371/journal.ppat.1008477. eCollection 2020 Apr.

Immunosuppressive FK506 treatment leads to more frequent EBV-associated lymphoproliferative disease in humanized mice

Affiliations

Immunosuppressive FK506 treatment leads to more frequent EBV-associated lymphoproliferative disease in humanized mice

Nicole Caduff et al. PLoS Pathog. .

Erratum in

Abstract

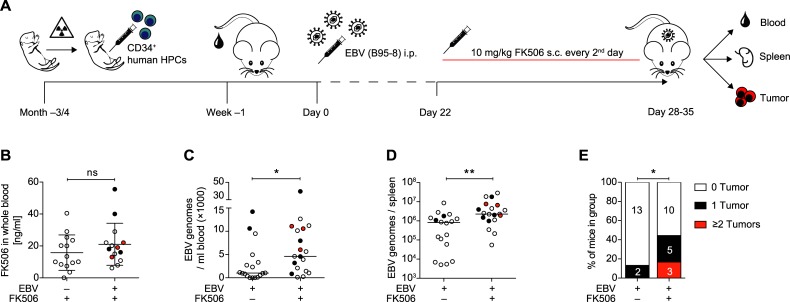
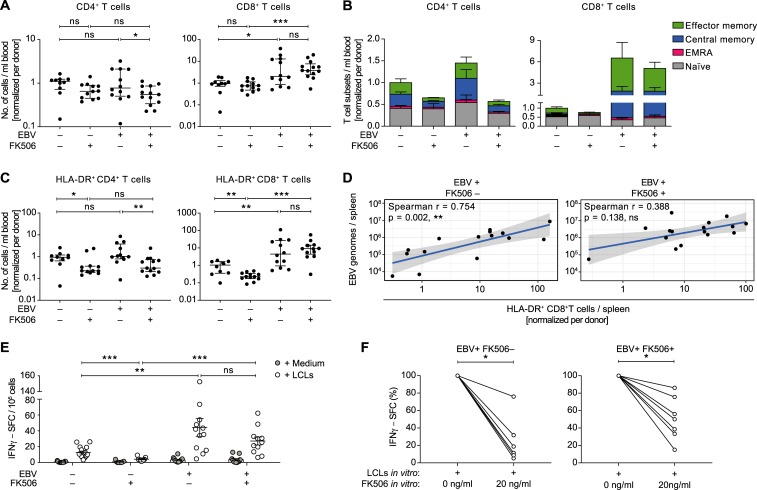
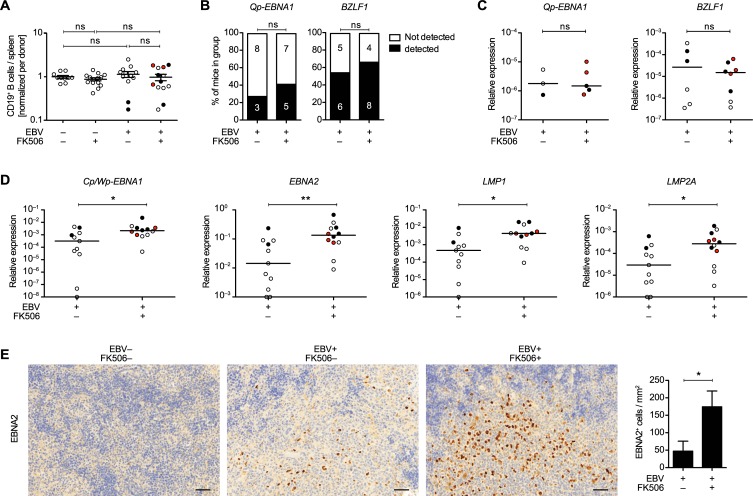
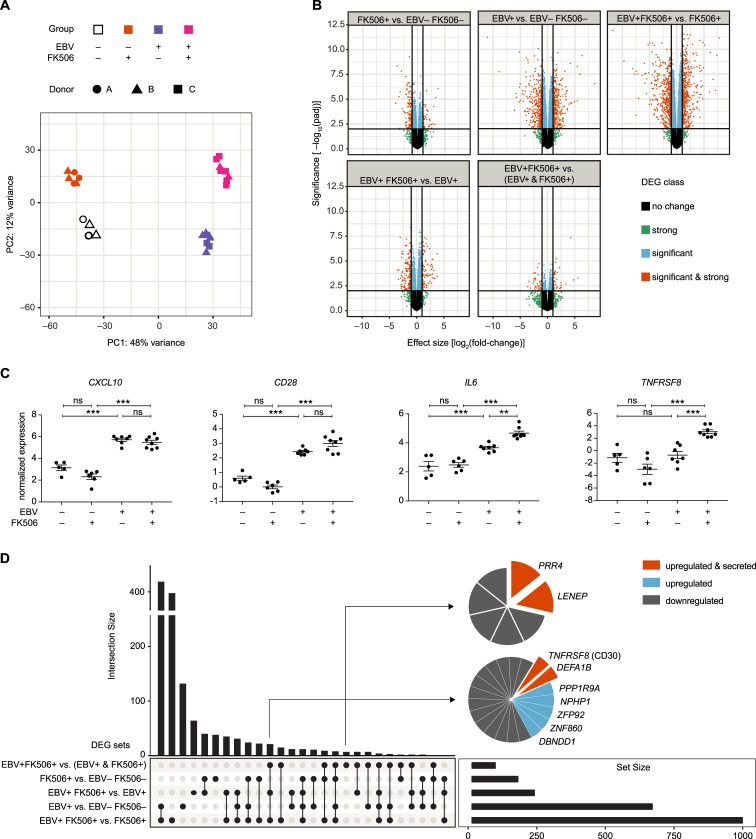
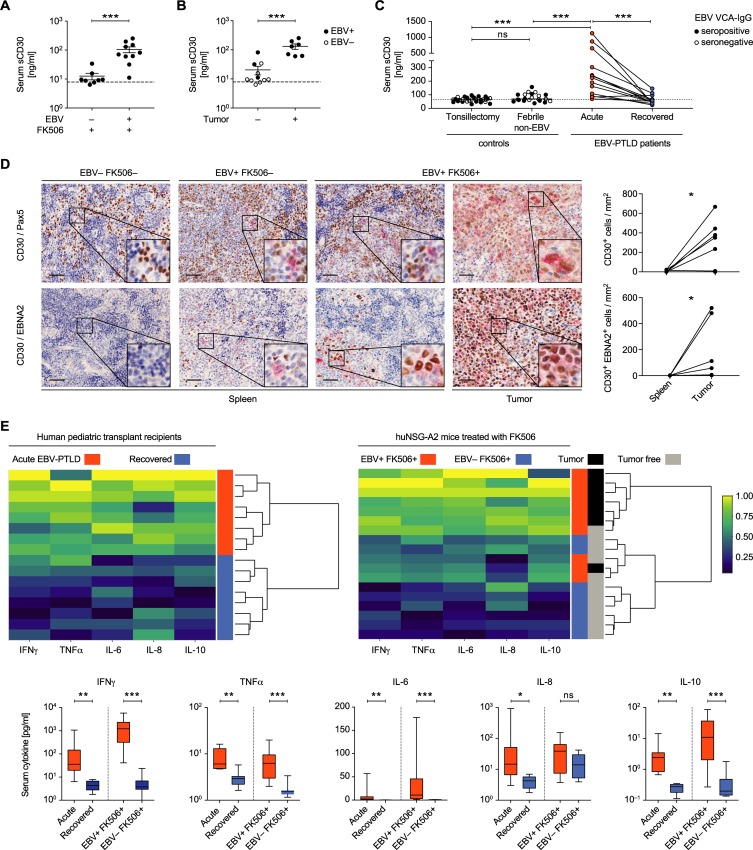
Post-transplant lymphoproliferative disorder (PTLD) is a potentially fatal complication after organ transplantation frequently associated with the Epstein-Barr virus (EBV). Immunosuppressive treatment is thought to allow the expansion of EBV-infected B cells, which often express all eight oncogenic EBV latent proteins. Here, we assessed whether HLA-A2 transgenic humanized NSG mice treated with the immunosuppressant FK506 could be used to model EBV-PTLD. We found that FK506 treatment of EBV-infected mice led to an elevated viral burden, more frequent tumor formation and diminished EBV-induced T cell responses, indicative of reduced EBV-specific immune control. EBV latency III and lymphoproliferation-associated cellular transcripts were up-regulated in B cells from immunosuppressed animals, akin to the viral and host gene expression pattern found in EBV-PTLD. Utilizing an unbiased gene expression profiling approach, we identified genes differentially expressed in B cells of EBV-infected animals with and without FK506 treatment. Upon investigating the most promising candidates, we validated sCD30 as a marker of uncontrolled EBV proliferation in both humanized mice and in pediatric patients with EBV-PTLD. High levels of sCD30 have been previously associated with EBV-PTLD in patients. As such, we believe that humanized mice can indeed model aspects of EBV-PTLD development and may prove useful for the safety assessment of immunomodulatory therapies.


Conflict of interest statement

The authors have declared that no competing interests exist.

Figures

Fig 1
Fig 1. FK506 treatment of EBV-infected huNSG-A2 mice leads to a higher viral burden and more frequent tumor formation.
A) Experimental set up of huNSG-A2 generation, infection and FK506 treatment. Upon irradiation, NSG-A2 mice received an intrahepatic injection of human CD34+ hematopoietic progenitor cells (HPCs). Reconstitution of human immune system components was assessed in peripheral blood three to four months later. Animals were then injected i.p. with 105 Raji infecting units (RIU) or PBS on day 0. Starting on day 22, animals were treated with FK506 (10mg/kg body weight) or PBS every second day until termination of the experiment. B) FK506 concentration was measured 24h after subcutaneous (s.c.) administration of the compound mixture and after a minimum of three applications as described in A). Concentration in whole blood (ng/ml) from individual mice from three independent experiments is depicted. Mean ± SD, p = 0.335 (Mann-Whitney test = MWT). C) Quantitative analysis of EBV DNA was performed by qPCR in duplicates for the amplification of BamHI W fragment of EBV in whole blood and D) in the spleen of mice that survived at least until day 28. DNA levels were measured at the day of sacrifice and are depicted from five pooled experiments (median, MWT). E) Percent of all mice per group with macroscopically visible, EBV-associated tumors, as confirmed via EBNA2 immunohistochemistry (IHC), from four independent experiments. Absolute numbers of mice are indicated per group (tumor score, MWT). B-D) Tumor presence in individual mice is indicated by symbol color: clear = no tumors, black = 1 tumor, red = 2 or more tumors. *: p<0.05, **: p<0.01. See also S1 Fig.
Fig 2
Fig 2. The EBV-induced T cell response is attenuated upon FK506 treatment.
A) Total peripheral blood CD4+ or CD8+ T cell counts at the end of the experiment from individual mice (n = 10–13 animals per group) are shown relative to the mean of the EBVFK506 group of each HPC donor. Median (IQR), t test and MWT, respectively. B) Differentiation status of T cells in the blood at the day of sacrifice is represented as stacked bar graphs (n = 7–10 animals per group). Naïve: CD62L+ CD45RA+, central memory: CD62L+ CD45RA, effector memory: CD62L CD45RA, effector memory RA+ (EMRA): CD62L CD45RA+. C) Relative numbers of activated CD4+ or CD8+ T cells in peripheral blood were determined by HLA-DR+ surface staining and are depicted for individual mice (n = 10–14 animals per group). Median (IQR), MWT. D) Correlations between the splenic EBV DNA load and the relative number of splenic HLA-DR+ CD8+ T cells are depicted for FK506-treated and non-treated EBV-infected mice. r, spearman correlation. Solid lines represent trend lines obtained by linear regression and shaded areas indicate 95% CI of each trend line. E) Number of EBV-reactive T cells was assessed for individual mice by Elispot assays whereby IFNγ spot-forming cells (SFC) were counted upon co-culture of CD19 MACS-depleted splenocytes or bone-marrow cells with autologous LCLs or medium. Mean ± SEM, MWT. F) Reduction in IFNγ–SFC (%) upon in vitro supplementation of 20ng/ml FK506 to CD19 MACS-depleted splenocytes during the co-culture with autologous LCLs. Depicted for EBV-infected mice with (n = 7) and without (n = 6) in vivo FK506-treatment. Wilcoxon matched-pairs test on raw IFNγ–SFC counts. Composite data from two (B), three (A, C) or four (D, E) independent experiments. See also S2 Fig. *: p<0.05, **: p<0.01, ***: p<0.001.
Fig 3
Fig 3. FK506 treatment enhances the expression of EBV latency II/III transcripts in B cells in vivo.
A) Total splenic CD19+ cell counts are depicted for individual mice from three independent experiments relative to the mean of the EBVFK506 group. Mean ± SEM, unpaired t test with Welch's correction. B-D) Composite data from three independent experiments with EBV+ FK506 (n = 11) and EBV+ FK506+ (n = 12). B) EBV mRNA in CD19+ MAC-sorted splenocytes was quantified in triplicates for each mouse by RT-qPCR. Data is depicted as percent of mice per group with transcript levels above the detection threshold. P-values were calculated with Fisher’s exact test. C-D) Transcript expression is displayed relative to the two reference genes (geometric mean of GAPDH and SDHA). EBNA, EBV nuclear antigen; LMP, latent membrane protein; Cp, Wp and Qp are latency-specific EBV promoters. Transcript values below the reliable quantification level are plotted on the X-axis. E) Representative IHC stainings and quantification of EBV nuclear antigen 2 (EBNA2) in splenic sections from EBVFK506, EBV-infected (n = 7) and EBV-infected, FK506-treated (n = 10) huNSG-A2 mice from two independent experiments. Scale bar: 50μm. P-values were calculated with MWT, *: p<0.05, **: p<0.01. See also S3 Fig.
Fig 4
Fig 4. Host transcriptome profiling reveals differential gene expression in B cells of EBV-infected huNSG-A2 mice treated with FK506.
A) RNA expression profiling of the human B cell transcriptome of mice from three independent experiments with EBVFK506 (n = 5, clear), EBVFK506+ (n = 6, orange), EBV+ FK506 (n = 7, purple) and EBV+ FK506+ (n = 8, magenta). Principal component plot: Sample similarity in a 2D projection by multi-dimensional scaling. Spurious batch effects of unknown origin and HFL donor-specific effects were corrected by surrogate variable analysis. The two principal components represent 60% of the total variance in the data set. B) Volcano plots: The horizontal line corresponds to FDR = 0.01 and genes below this line are labeled ‘not significant’. The two vertical lines correspond to a 2-fold change in expression and genes outside this range are labelled ‘strong’. The legend refers to ‘not’—not significant and weak effect; ‘signif & strong’—significant and strong effect; ‘signif’—significant but weak effect; ‘strong’—not significant but strong effect. C) Normalized AmpliSeq expression levels of CXCL10, CD28, IL6 and TNFRSF8 (CD30) are depicted for individual mice with mean ± SEM and FDR-corrected p-value summaries (*: FDR-p<0.05, **: FDR-p<0.01, ***: FDR-p<0.001.) D) Upset plot identifies private, shared and promiscuous DEGs among groups. The vertical bar chart indicates the intersection size of transcripts shared between certain groups defined by solid points below the chart. The total number of DEGs for each condition is depicted in the horizontal bar chart. See also S4–S6 Figs and S1 and S2 Tables.
Fig 5
Fig 5. High serum levels of sCD30 are associated with EBV-driven tumor presence in huNSG-A2 mice and in human PTLD patients.
A-C) Protein concentration of sCD30 was measured in serum samples with ELISA. A) Serum was obtained at the day of sacrifice from animals from two independent experiments. B) Post hoc stratification of FK506-treated mice with or without macroscopically visible tumors with EBV-infection status indicated by black (EBV+) or clear (EBV) symbols. A-B) Mean ± SEM, MWT. Dashed lines indicate quantification thresholds. C) sCD30 was measured in the sera of 31 healthy children undergoing elective tonsillectomy, 21 children that presented with non-EBV associated fever (Febrile non-EBV, EBV VCA-IgM negative) and 13 pediatric PTLD patients around diagnosis (PTLD Acute) and again at least 36 months later (PTLD Recovered) (See S3 and S4 Tables). Dashed line represents the median of the healthy controls. MWT and Wilcoxon matched-pairs test. D) Representative immunohistochemistry staining of CD30 (red) and PAX5 (brown), or CD30 (red) and EBNA2 (brown), in splenic sections or tumor tissue of huNSG-A2 mice. Scale bars: 50μm. Quantification of CD30+ (n = 7) and CD30+ EBNA2+ cells (n = 6) per mm2 in tumor sections and non-tumorous spleen tissue of EBV-infected mice is depicted for two independent experiments. E) Cytokine concentration was measured in the serum of EBV-PTLD patients (n = 8) at diagnosis (acute) and again at recovery time point at least 36m post-diagnosis and in FK506-treated EBV(n = 8) and EBV+ (n = 10) experimental mice, composite data from two independent experiments. Upper panel: Heatmaps and hierarchical clustering of pediatric patients or huNSG-A2 mice based on serum cytokine levels (IFNγ, TNFα, IL-6, IL-8 and IL-10) at diagnosis (red) and recovery (blue) for PTLD (left) and on the day of sacrifice for huNSG-A2 mice (right) treated with FK506 (blue) and additionally EBV-infected (red). Tumor presence versus absence in huNSG-A2 mice is indicated in black and grey respectively. Lower panel: Cytokine concentration (median (IQR) with min and max range as whiskers) in the serum of EBV-PTLD patients and in FK506-treated EBVand EBV+ experimental mice. Wilcoxon matched-pairs test and MWT respectively. *P < 0.05, **P < 0.01, ***P < 0.001. See also S7 Fig and S3 and S4 Tables.

Similar articles

Cited by

References

    1. Cesarman E. Gammaherpesviruses and lymphoproliferative disorders. Annu Rev Pathol. 2014;9:349–72. 10.1146/annurev-pathol-012513-104656 - DOI - PubMed
    1. Cohen JI. Primary Immunodeficiencies Associated with EBV Disease. Curr Top Microbiol Immunol. 2015;390(Pt 1):241–65. 10.1007/978-3-319-22822-8_10 - DOI - PMC - PubMed
    1. Joseph AM, Babcock GJ, Thorley-Lawson DA. Cells expressing the Epstein-Barr virus growth program are present in and restricted to the naive B-cell subset of healthy tonsils. J Virol. 2000;74(21):9964–71. 10.1128/jvi.74.21.9964-9971.2000 - DOI - PMC - PubMed
    1. Babcock JG, Hochberg D, Thorley-Lawson AD. The expression pattern of Epstein-Barr virus latent genes in vivo is dependent upon the differentiation stage of the infected B cell. Immunity. 2000;13(4):497–506. 10.1016/s1074-7613(00)00049-2 - DOI - PubMed
    1. Bollard CM, Rooney CM, Heslop HE. T-cell therapy in the treatment of post-transplant lymphoproliferative disease. Nat Rev Clin Oncol. 2012;9(9):510–9. 10.1038/nrclinonc.2012.111 - DOI - PMC - PubMed

Publication types

MeSH terms