. 2020 Apr 21;118(8):1921-1929.
doi: 10.1016/j.bpj.2020.03.007. Epub 2020 Mar 19.

Extraction of Thick Filaments in Individual Sarcomeres Affects Force Production by Single Myofibrils

Affiliations

Extraction of Thick Filaments in Individual Sarcomeres Affects Force Production by Single Myofibrils

Andrea C Mendoza et al. Biophys J. .

Abstract

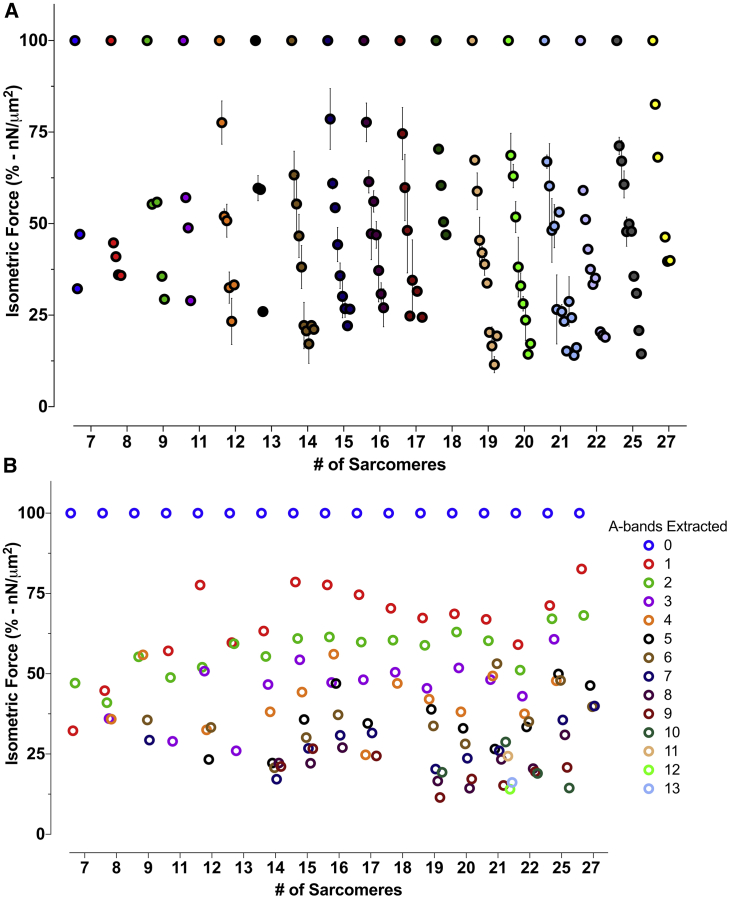
It has been accepted that the force produced by a skeletal muscle myofibril depends on its cross-sectional area but not on the number of active sarcomeres because they are arranged in series. However, a previous study performed by our group showed that blocking actomyosin interactions within an activated myofibril and depleting the thick filaments in one sarcomere unexpectedly reduced force production. In this study, we examined in detail how consecutive depletion of thick filaments in individual sarcomeres within a myofibril affects force production. Myofibrils isolated from rabbit psoas were activated and relaxed using a perfusion system. An extra microperfusion needle filled with a high-ionic strength solution was used to erase thick filaments in individual sarcomeres in real time before myofibril activation. The isometric forces were measured upon activation. The force produced by myofibrils with intact sarcomeres was significantly higher than the force produced by myofibrils with one or more sarcomeres lacking thick filaments (p < 0.0001) irrespective of the number of contractions imposed on the myofibrils and their initial sarcomere length. Our results suggest that the myofibril force is affected by intersarcomere dynamics and the number of active sarcomeres in series.


Figures

Figure 1
Figure 1
(Top) Three-dimensional (3D) schematic representation of the experimental system. The myofibril is held between two precalibrated needles (in gray holding the fiber) that allow force measurement upon activation. Activation is triggered by rapid changes in solution from the double-barreled perfusion (large gray structure in the back). Extraction of individual myosin A-bands is done with the microperfusion pipette (blue), which is controlled by a pressure system. (Middle) One myofibril attached between two needles is held at a mean SLi = 2.9 μm, surrounded by a large perfusion (not visible). The six different frames show the myofibril at different time points during the experiment. (1) Myofibril is shown attached to the needles before the A-band extraction and activation. (2) The microperfusion is placed close to a sarcomere in the center of the myofibril. (3) The release of the HIS in the microperfusion causes the extraction of the A-band. (4) Microperfusion is pulled away. (5) Myofibril activation is shown here. (6) Myofibril relaxation is shown here. In (4)–(6), the asterisk indicates the position of the extracted A-band. (Bottom) A magnified picture of a myofibril shows the SL measurements. Double-headed arrows point to the Z-disks on the myofibril and the corresponding point on the gray intensity profile of the long axis. The profile represents different areas of the striated pattern of the myofibril: the high peaks represent the I-bands, the small valleys in-between represent the Z-disks, the big valleys represent the A-bands, and the small peaks in-between represent the M-line.
Figure 2
Figure 2
Force traces of a representative control myofibril during six activation and relaxation cycles.
Figure 3
Figure 3
(A and B) Force traces of a representative myofibril activated at 2.6 and 3.12 μm, respectively. The traces in both graphs show force development during five contractions after the extraction of myosin A-bands, as specified in the legend.
Figure 4
Figure 4
Normalized, maximal force obtained in different myofibrils as they are consecutively activated and relaxed. (A) In the control group, the force decreases as each myofibril is exposed to more contractions; however, the force remains relatively high for the first few contractions and does not decrease as rapidly as in myofibrils with extracted sarcomeres. The sample sizes are as follows: 1 (n = 29), 2 (n = 29), 3 (n = 24), 4 (n = 19), 5 (n = 12), 6 (n = 8), 7 (n = 7), 8 (n = 5), 9 (n = 3), 10 (n = 1), 11 (n = 1), and 12 (n = 1). (B) In the A-band extraction group, the force decreases significantly (p < 0.0001) as each myofibril is exposed to a contraction after each extraction. The sample sizes are as follows: 0 (n = 46), 1 (n = 33), 2 (n = 40), 3 (n = 32), 4 (n = 30), 5 (n = 26), 6 (n = 18), 7 (n = 19), 8 (n = 10), 9 (n = 10), 10 (n = 5), 11 (n = 1), 12 (n = 1), and 13 (n = 1).
Figure 5
Figure 5
(A) Data points show the mean ± SE of the maximal force obtained during the plateau in control myofibrils with different numbers of sarcomeres as they are exposed to successive contractions. The force decreases as each myofibril is exposed to more contractions (p < 0.0001). (B) shows the same data as (A), highlighting only the mean for the specific number of contractions at each point. The sample sizes are as follows: 7 (n = 1), 9 (n = 1), 12 (n = 3), 13 (n = 3), 14 (n = 3), 15 (n = 4), 16 (n = 1), 17 (n = 3), 18 (n = 1), 19 (n = 2), 20 (n = 1), 21 (n = 1), 22 (n = 1), 25 (n = 2), 28 (n = 1), and 30 (n = 1).
Figure 6
Figure 6
(A) Data points show the change (mean ± SE) in force for myofibrils of different lengths as individual A-bands are successively extracted. (B) shows the same data from (A), distinguishing the mean for the specific number of extractions at each point. The sample sizes are as follows: 7 (n = 1), 8 (n = 1), 9 (n = 1), 11 (n = 1), 12 (n = 6), 13 (n = 2), 14 (n = 4), 15 (n = 4), 16 (n = 4), 17 (n = 5), 18 (n = 1), 19 (n = 3), 20 (n = 4), 21 (n = 4), 22 (n = 1), 25 (n = 3), and 27 (n = 1).
Figure 7
Figure 7
Effect of the number of extractions for different number of contractions performed. For a particular contraction, myofibrils lacking a greater number of A-bands produced less force. The sample sizes are as follows: contraction no. (no. of extractions (n)) = second (0 (29), 1 (30), 2 (7), 4 (1)); third (0 (24), 1 (1), 2 (29), 3 (7), 4 (1), 5 (1)); fourth (0 (19), 1 (2), 2 (2), 3 (25), 4 (5), 5 (2), 7 (2)); fifth (0 (12), 2 (2), 4 (22), 5 (7), 6 (2), 7 (1), 9 (1)); sixth (0 (8), 3 (1), 4 (1), 5 (15), 6 (4), 7 (3), 9 (1)); seventh (0 (7), 6 (12), 7 (4), 8 (2), 10 (1)); eighth (0 (5), 7 (8), 8 (4), 9 (2)); ninth (0 (3), 8 (4), 9 (4), 10 (1)); and 10th (0 (1), 9 (2), 10 (1)).
Figure 8
Figure 8
Mean isometric force (%) produced by myofibrils in two different experimental conditions: SLi = 2.7 μm and SLi = 3.1 μm during successive control contractions. The dotted line represents the normalized isometric force of the first contraction. The two conditions were significantly different (p = 0.03). The sample sizes for SLi = 2.7 μm are as follows: 1 (n = 19), 2 (n = 19), 3 (n = 16), 4 (n = 12), 5 (n = 8), 6 (n = 5), 7 (n = 4), 8 (n = 3), 9 (n = 2), 10 (n = 1), 11 (n = 1), and 12 (n = 1). The sample sizes for SLi = 3.1 μm are as follows: 1 (n = 10), 2 (n = 10), 3 (n = 8), 4 (n = 7), 5 (n = 4), 6 (n = 3), 7 (n = 3), 8 (n = 2), and 9 (n = 1).
Figure 9
Figure 9
Mean isometric force (%) produced by myofibrils in two different experimental conditions: SLi = 2.7 μm and SLi = 3.1 μm after successive extractions of myosin A-bands. The dotted line represents the normalized isometric force before A-band extraction. The two conditions were not significantly different (p = 0.27). The sample sizes for SLi = 2.7 μm are as follows: 0 (n = 29), 1 (n = 17), 2 (n = 26), 3 (n = 19), 4 (n = 18), 5 (n = 15), 6 (n = 10), 7 (n = 12), 8 (n = 6), 9 (n = 6), 10 (n = 4), 11 (n = 1), 12 (n = 1), and 13 (n = 1). The sample sizes for SLi = 3.1 μm are as follows: 0 (n = 17), 1 (n = 16), 2 (n = 14), 3 (n = 13), 4 (n = 12), 5 (n = 11), 6 (n = 8), 7 (n = 7), 8 (n = 4), 9 (n = 4), and 10 (n = 1).

References

    1. Telley I.A., Denoth J., Stehle R. Half-sarcomere dynamics in myofibrils during activation and relaxation studied by tracking fluorescent markers. Biophys. J. 2006;90:514–530. - PMC - PubMed
    1. Huxley A.F., Niedergerke R. Structural changes in muscle during contraction; interference microscopy of living muscle fibres. Nature. 1954;173:971–973. - PubMed
    1. Huxley H.E. The double array of filaments in cross-striated muscle. J. Biophys. Biochem. Cytol. 1957;3:631–648. - PMC - PubMed
    1. Gordon A.M., Huxley A.F., Julian F.J. The variation in isometric tension with sarcomere length in vertebrate muscle fibres. J. Physiol. 1966;184:170–192. - PMC - PubMed
    1. Maruyama K., Natori R., Nonomura Y. New elastic protein from muscle. Nature. 1976;262:58–60. - PubMed

Publication types

LinkOut - more resources