. 2020 Apr 24;23(4):101004.
doi: 10.1016/j.isci.2020.101004. Epub 2020 Mar 21.

The Symbiotic Relationship between the Neural Retina and Retinal Pigment Epithelium Is Supported by Utilizing Differential Metabolic Pathways

Affiliations

The Symbiotic Relationship between the Neural Retina and Retinal Pigment Epithelium Is Supported by Utilizing Differential Metabolic Pathways

Tirthankar Sinha et al. iScience. .

Abstract

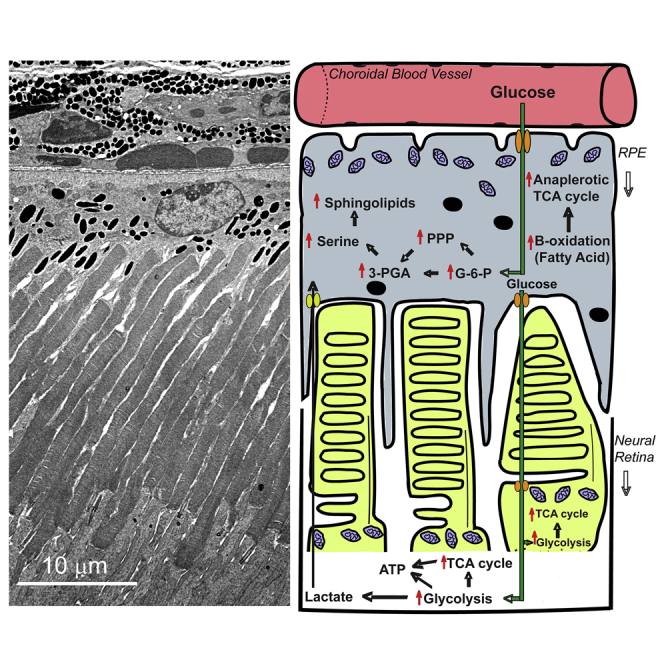
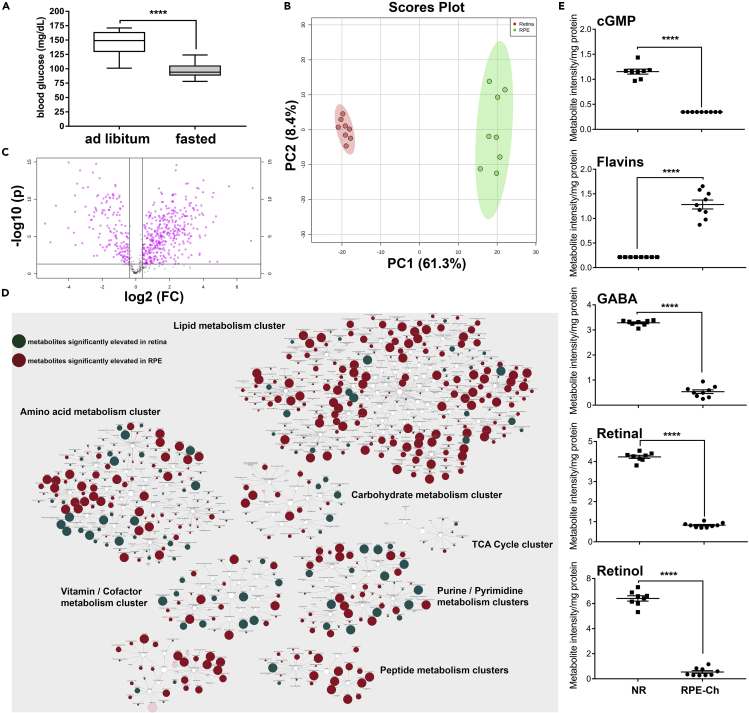
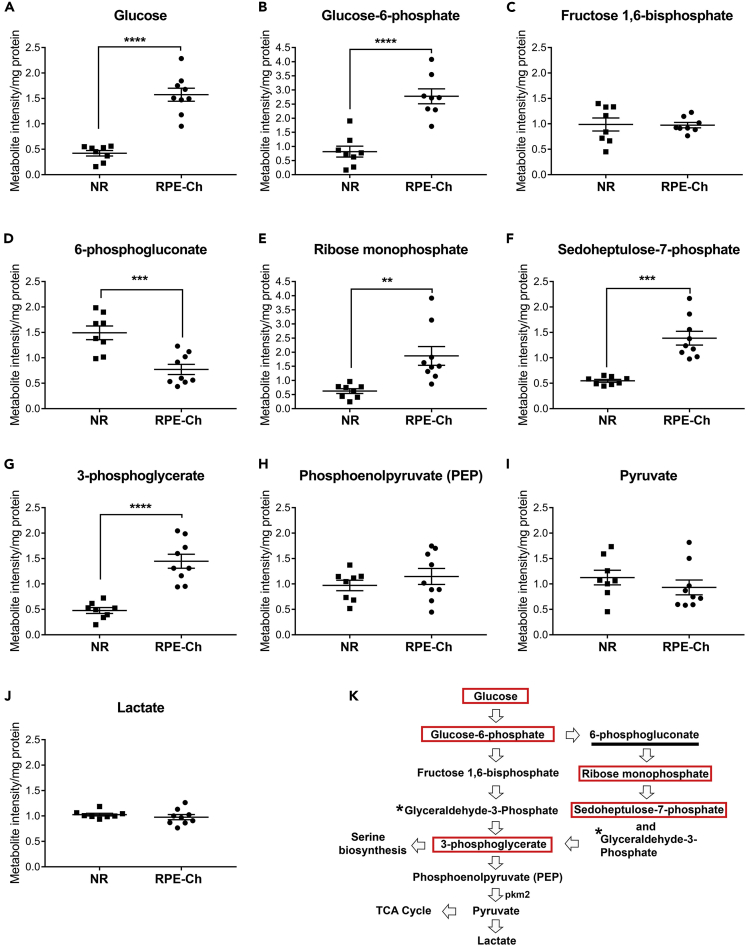
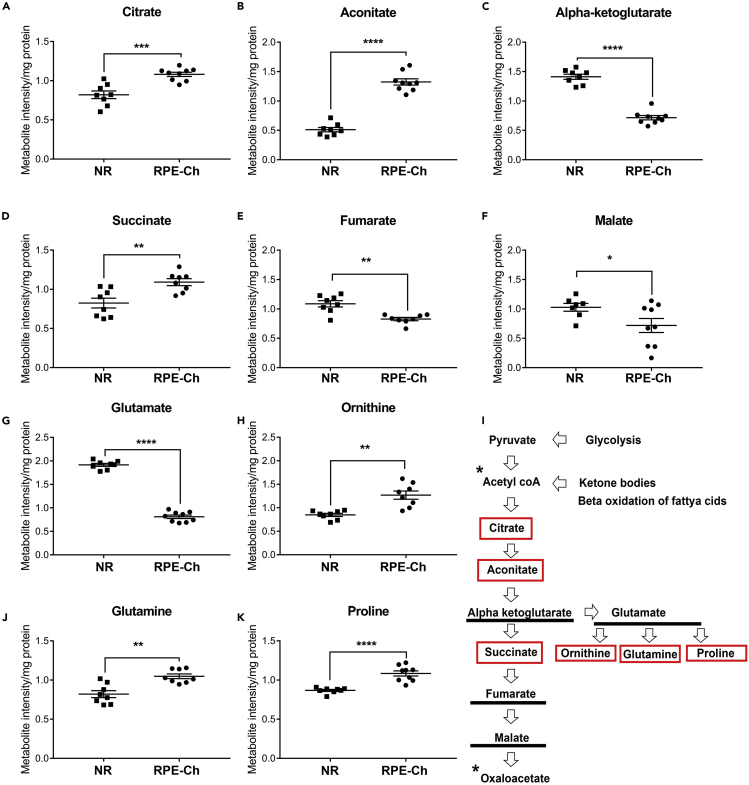
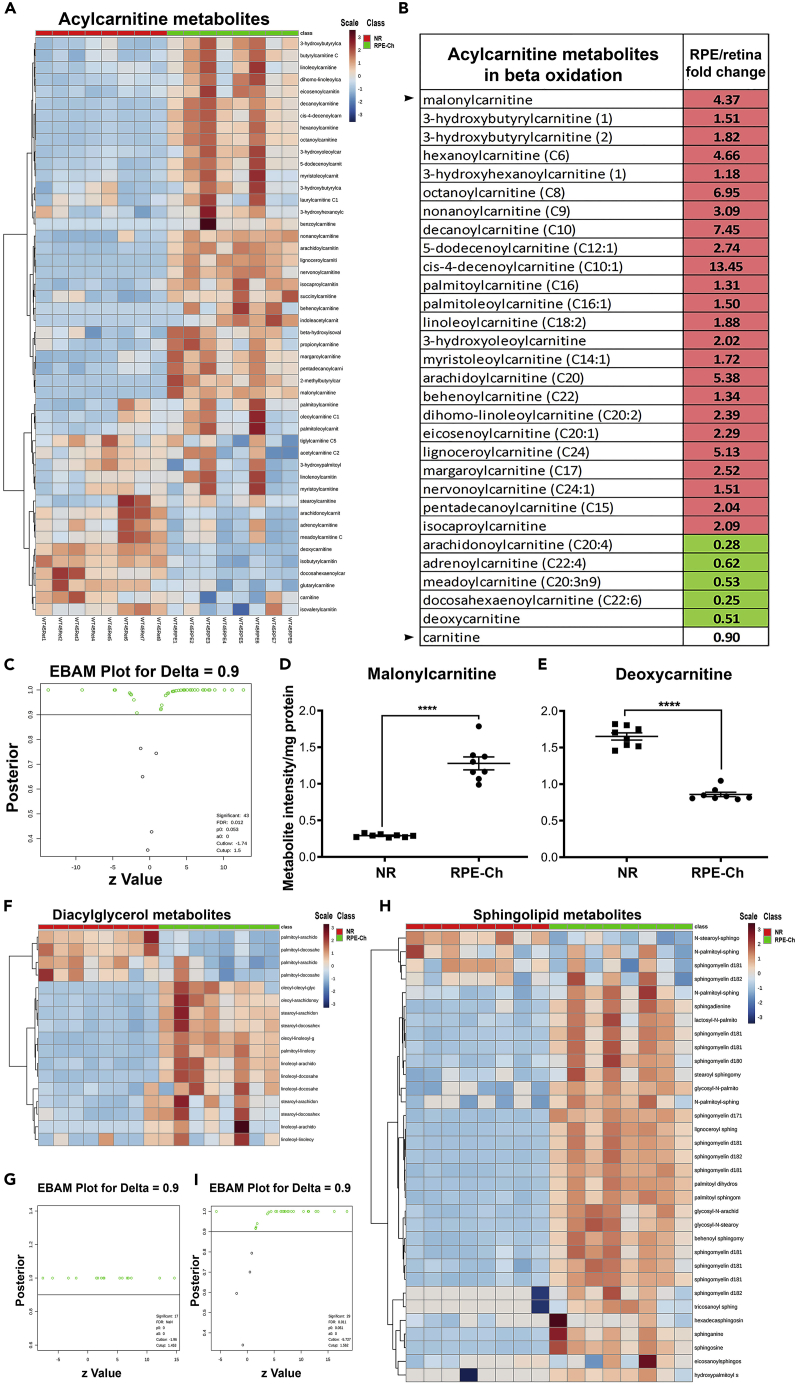
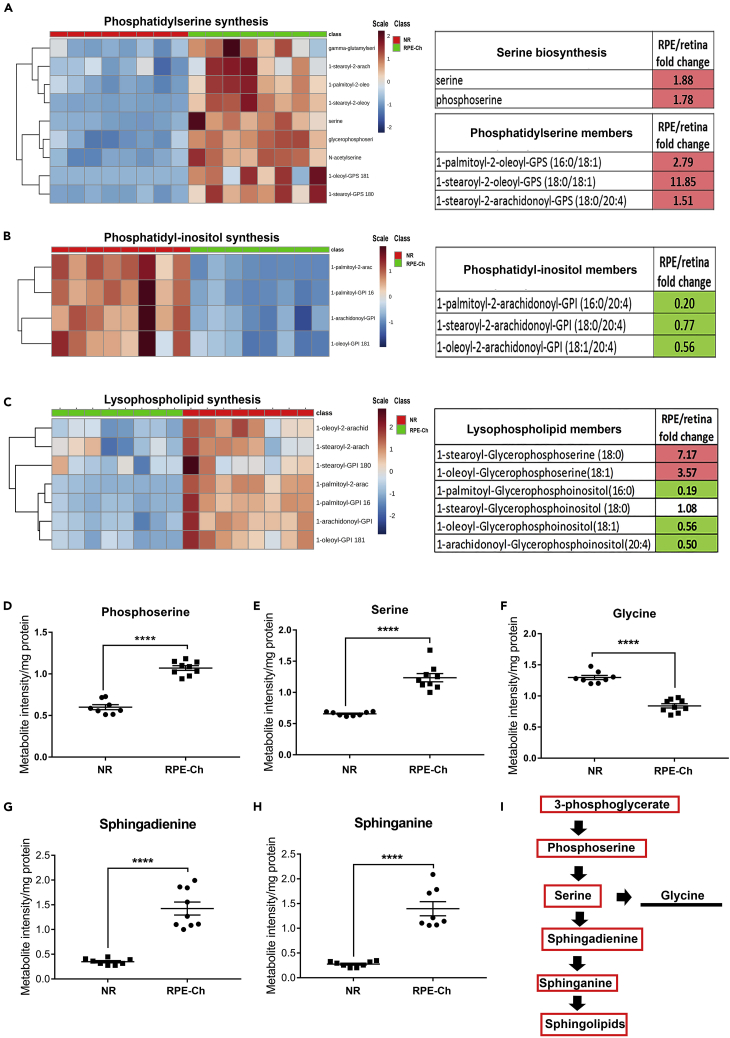
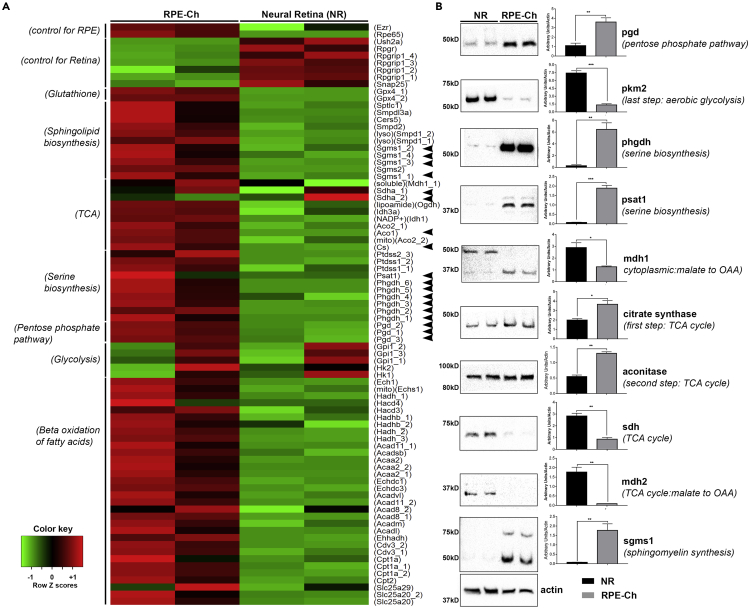
The neural retina and retinal pigment epithelium (RPE) maintain a symbiotic metabolic relationship, disruption of which leads to debilitating vision loss. The current study was undertaken to identify the differences in the steady-state metabolite levels and the pathways functioning between bona fide neural retina and RPE. Global metabolomics and cluster analyses identified 650 metabolites differentially modulated between the murine neural retina and RPE. Of these, 387 and 163 were higher in the RPE and the neural retina, respectively. Further analysis coupled with transcript and protein level investigations revealed that under normal physiological conditions, the RPE utilizes the pentose phosphate (>3-fold in RPE), serine (>10-fold in RPE), and sphingomyelin biosynthesis (>5-fold in RPE) pathways. Conversely, the neural retina relied mostly on glycolysis. These results show how the RPE and the neural retina have acquired an efficient, complementary and metabolically diverse symbiotic niche to support each other's distinct functions.

Keywords: Metabolomics; Omics; Specialized Functions of Cells.


Conflict of interest statement

Declaration of Interests The authors declare no competing interests.

Figures

None
Graphical abstract
Figure 1
Figure 1
Metabolic Clustering in the RPE and Retina (A) Blood glucose levels in fasted and unfasted animals before tissue collection for metabolomics analyses shown as min-max whisker plot with error bars reflecting mean ± SEM. (B) Principal-component analysis of all samples reveal significantly discrete separation for both groups (neural retina in red, RPE-choroid in green), with contribution of each principal component showed in % along the axes. (C) Volcano plot on all samples shows significantly different metabolites (shown in pink) across RPE-choroid and neural retina with a cutoff of p < 0.05 (t test). (D) Pathway enrichment using respective HMDB and KEGG ID segregates these metabolites in distinct metabolic pathway as clusters, with each reflecting RPE-choroid to neural retina ratio as elevation in red circle and reduction in green circle. The degree of impact of each change to the respective metabolic pathway is reflected by the size of the circles. (E) Scattered plots of the metabolites whose comparative levels have been previously published are shown here to corroborate with our analysis. Student's two-tailed t test was done for statistical test with ∗∗∗∗p < 0.0001. (NR, neural retina; RPE-Ch, RPE-choroid).
Figure 2
Figure 2
Upregulation of Specific Glycolytic Intermediates (A–K) Various metabolites involved in the glycolysis and pentose phosphate pathway were analyzed from neural retina and RPE-choroid. The levels of these metabolites for both neural retina and RPE-choroid are shown (A–J) along with a graphical representation of glycolysis (K), with the significantly elevated metabolites in RPE-choroid boxed in red, those elevated in neural retina marked by an underline, and those not measured marked by an asterisk. Each group has a sample size of n = 8 for neural retina and n = 9 for RPE-choroid. The metabolites having significant differences between neural retina and RPE-choroid are shown (A–G) with ∗∗p<0.001, ∗∗∗p<0.0001, and ∗∗∗∗p<0.00001. Data presented as mean ± SEM. (NR, neural retina; RPE-Ch, RPE-choroid).
Figure 3
Figure 3
Differential Anaplerotic Shunt in the RPE and Retina (A–K) Metabolites involved in the TCA cycle were analyzed from neural retina and RPE-choroid. The levels of these metabolites for both neural retina and RPE-choroid are shown (A–H, J, and K) along with a graphical representation of TCA cycle (I), with the significantly elevated metabolites in RPE-choroid boxed in red, those elevated in neural retina marked by underline, and those not measured marked by an asterisk. Each group has a sample size of n = 8 for neural retina and n = 9 for RPE-choroid. The metabolites having significant differences between neural retina and RPE-choroid are shown (A–E) with ∗p < 0.05, ∗∗p < 0.001, ∗∗∗p < 0.0001, and ∗∗∗∗p < 0.00001. Data represented as mean ± SEM. (NR, neural retina; RPE-Ch, RPE-choroid).
Figure 4
Figure 4
Fatty Acid Metabolites and Sphingolipids Are Higher in RPE (A–G) Metabolites involved in β-oxidation of fatty acids and sphingolipids (H and I) were analyzed in neural retina and RPE-choroid. The levels of these metabolites as a ratio of RPE-choroid over neural retina are shown, with only significantly elevated metabolites being marked inside red box and the significantly lower metabolites being marked inside green boxes. Each group has a sample size of n = 8 for neural retina and n = 8 for RPE-choroid. (A) Heatmap and dendrogram clustering for acylcarnitine metabolites in neural retina and RPE-choroid samples reflects distinct clustering between the two groups and clear elevation for most metabolites in the RPE-choroid. (B) Acylcarnitine metabolites involved in β-oxidation of fatty acids and having significant change (t test with p < 0.05) shown as fold change of RPE-choroid to neural retina from among the features identified in (C). (C) EBAM plot for the metabolites involved in acylcarnitine metabolism with a cutoff of 0.9 for delta identifies 43 significant metabolites (features) shown in empty green circles. (D) Malonylcarnitine levels shown in neural retina and RPE-choroid samples as a scatterplot (mean ± SEM) with t test for significance (∗∗∗∗p<0.00001). (E) Deoxycarnitine levels shown in neural retina and RPE-choroid samples as scatterplot (mean ± SEM) with t test of significance (∗∗∗∗p<0.00001). (F) Heatmap and dendrogram clustering for diacylglycerol metabolites across all neural retina and RPE-choroid samples reflects distinct clustering between the two groups and clear elevation for most metabolites in the RPE-choroid. (G) EBAM plot for the diacylglycerol metabolites with a cutoff of 0.9 for delta identifies 17 significant metabolites (features) shown in empty green circles. (H) Heatmap and dendrogram clustering for sphingolipid metabolites across all neural retina and RPE-choroid samples reflects distinct clustering between the two groups and clear elevation for most metabolites in the RPE-choroid. (I) EBAM plot for the metabolites involved in sphingolipid metabolism with a cutoff of 0.9 for delta identifies 29 significant metabolites (features) shown in empty green circles. (NR, neural retina; RPE-Ch, RPE-choroid).
Figure 5
Figure 5
Phosphatidylserine Synthesis is Elevated Over Other Phospholipids (A–C) Metabolites involved in phospholipid synthesis were analyzed in neural retina and RPE-choroid. Each group has a sample size of n = 8 for neural retina and n = 8 for RPE-choroid, with only significantly elevated metabolites being marked inside red box and the significantly lower metabolites being marked inside green box in the tables for respective pathway. (A) Heatmap with dendrogram clustering of metabolites involved in phosphatidylserine synthesis across neural retina and RPE-choroid samples reflects clear elevated levels in the RPE-choroid samples and distinct clustering between the two groups. EBAM plot for the metabolites involved in phosphatidylserine biosynthesis with a cutoff of 0.9 for delta identifies the significant metabolites (features) shown in empty green circles shown in Figure S2. Fold change of RPE-choroid to neural retina is shown for five of these metabolites here, with the precursors of phosphatidylserine biosynthesis in the upper table and the products in the lower table. (B) Heatmap and dendogram clustering of metabolites involved in phosphatidylinositol synthesis across neural retina and RPE-choroid samples reflects clear reduced levels in the RPE-choroid and distinct clustering between the two groups. EBAM plot for the metabolites involved in phosphatidylinositol synthesis with a cutoff of 0.9 for delta identifies the significant metabolites (features) shown in empty green circles shown in Figure S2. Three of these metabolites are shown here in the table as fold change of RPE-choroid to neural retina and reflects the highly reduced levels in RPE-choroid. (C) Heatmap and dendogram clustering of metabolites involved in lysophospholipid synthesis across neural retina and RPE-choroid samples reflects distinct clustering between the two groups. EBAM plot for the metabolites involved in lysophospholipid synthesis with a cutoff of 0.9 for delta identifies the significant metabolites (features) shown in empty green circles shown in Figure S2. Six of these metabolites having significance are shown in the tables as fold change of RPE-choroid to neural retina and reflect highly reduced levels in RPE-choroid for the lysophospholipids with inositol, whereas the ones with serine being higher. (D–I) (D and E) Serine biosynthesis metabolites and their utilization in glycine (F) and sphingolipid metabolism (G and H) are shown as scatterplots to supplement to their heatmap as in Figures 4 and 5, along with a representation of the pathway (I) with the significantly elevated metabolites in RPE-choroid boxed in red, those elevated in neural retina marked by underline, and those not measured marked by an asterisk. Student's two-tailed t test was done for statistical test with ∗∗∗∗p < 0.0001. (NR, neural retina; RPE-Ch, RPE-choroid).
Figure 6
Figure 6
Transcript and Protein Levels of Metabolic Enzymes (A) Microarray expression data from GSE10246 shows relative enrichment of the RPE-choroid in multiple enzymes involved in various metabolic pathways. The enzyme names are shown on the right, and the ones further analyzed at protein level in (B) have been marked with black arrowheads. The pathways the enzymes are involved in are shown on the left side of the heatmap. (B) Steady-state protein levels of some of the metabolic enzymes as in (A) for both RPE-choroid and neural retina further show elevated levels in the RPE-choroid. Each blot was performed twice, and a single representative image is shown here. Graphical representation of the quantitation performed on the immunoblots is shown next to the respective blot. Each group had n = 4, and each experiment was performed twice with five pooled retina and RPE-choroid in each sample. (NR, neural retina; RPE-Ch, RPE-choroid).

Similar articles

Cited by

References

    1. Acharya U., Patel S., Koundakjian E., Nagashima K., Han X., Acharya J.K. Modulating sphingolipid biosynthetic pathway rescues photoreceptor degeneration. Science. 2003;299:1740–1743. - PubMed
    1. Adijanto J., Du J., Moffat C., Seifert E.L., Hurle J.B., Philp N.J. The retinal pigment epithelium utilizes fatty acids for ketogenesis. J. Biol. Chem. 2014;289:20570–20582. - PMC - PubMed
    1. Adijanto J., Philp N.J. Cultured primary human fetal retinal pigment epithelium (hfRPE) as a model for evaluating RPE metabolism. Exp. Eye Res. 2014;126:77–84. - PMC - PubMed
    1. Akram M. Citric acid cycle and role of its intermediates in metabolism. Cell Biochem. Biophys. 2014;68:475–478. - PubMed
    1. Ames A., 3rd, Li Y.Y., Heher E.C., Kimble C.R. Energy metabolism of rabbit retina as related to function: high cost of Na+ transport. J. Neurosci. 1992;12:840–853. - PMC - PubMed

LinkOut - more resources