. 2020 Mar;17(1):42-59.
doi: 10.14245/ns.2040052.026. Epub 2020 Mar 31.

Direct and Intervertebral Disc-Mediated Sensitization of Dorsal Root Ganglion Neurons by Hypoxia and Low pH

Affiliations

Direct and Intervertebral Disc-Mediated Sensitization of Dorsal Root Ganglion Neurons by Hypoxia and Low pH

Junxuan Ma et al. Neurospine. 2020 Mar.

Abstract

Objective: Ischemia-related risk factors are consistently correlated with discogenic pain, but it remains unclear how the ischemia-associated hypoxia and acidosis influence the peripheral sensory nervous system, namely the dorsal root ganglion (DRG), either directly or indirectly via intervertebral disc (IVD) mediation.

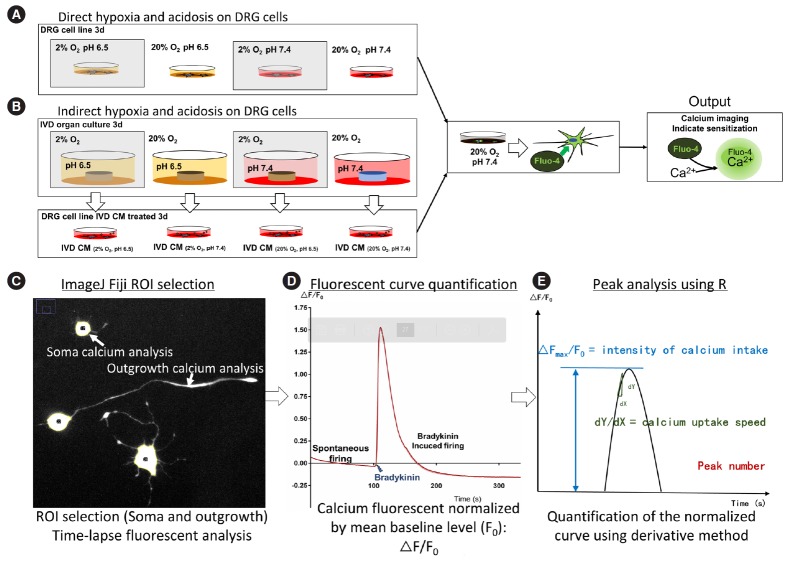
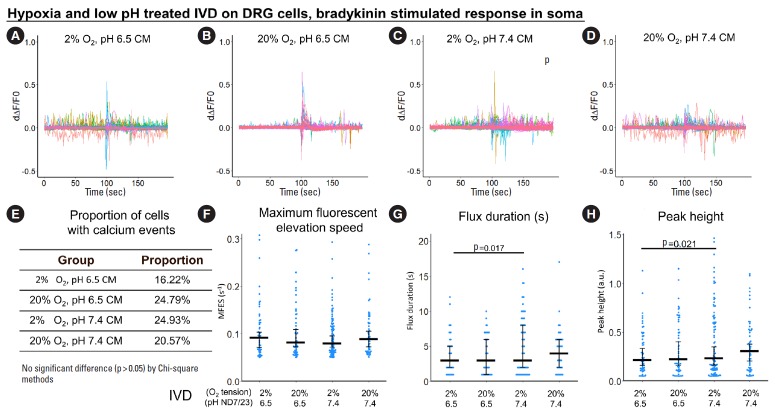
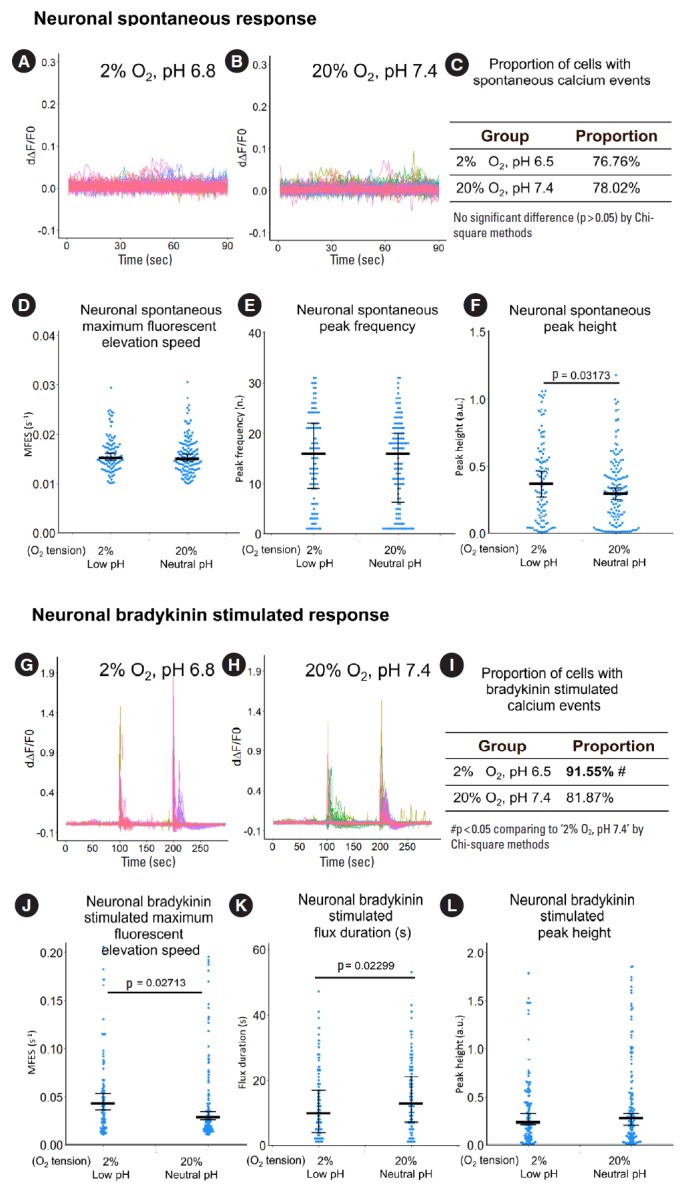
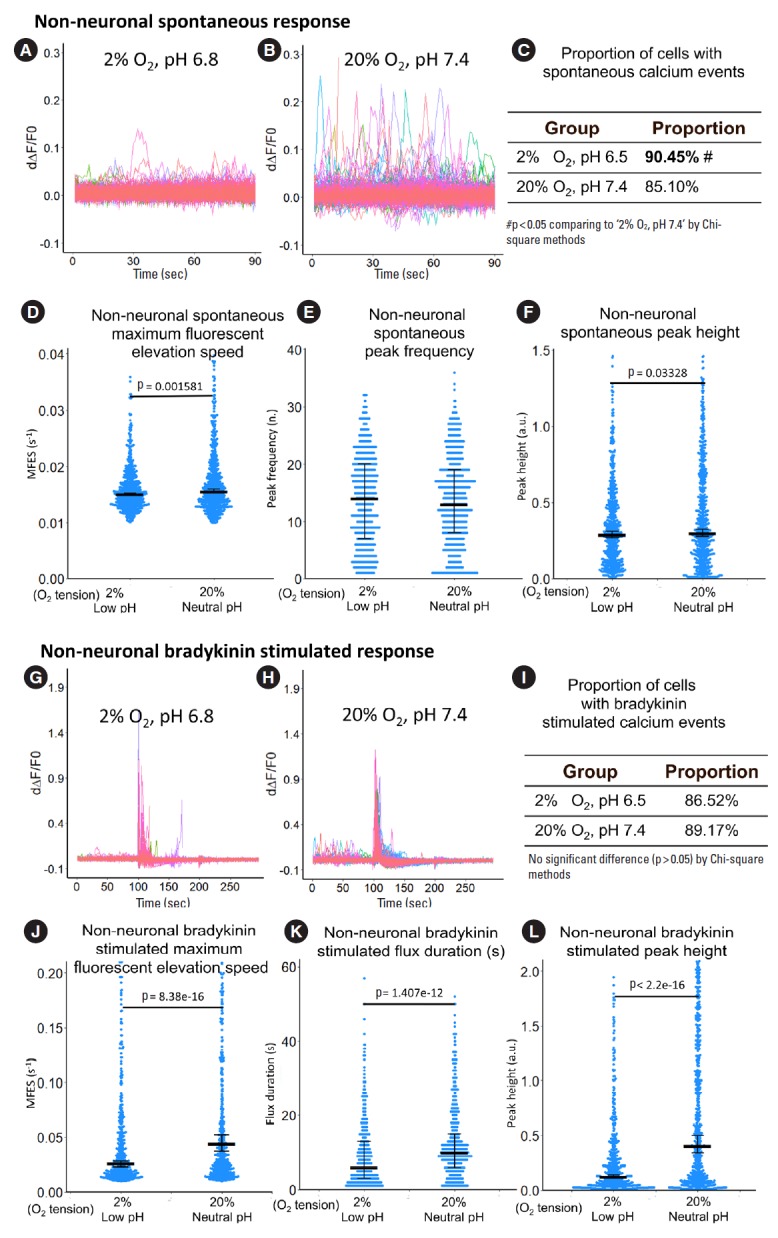
Methods: Bovine tail IVD organ cultures were preconditioned in different hypoxic and/or acidic conditions for 3 days to collect the conditioned medium (CM). The DRG-derived ND7/23 cells were either treated by the IVD CM or directly stimulated by hypoxic and/or acidic conditions. Neuronal sensitization was evaluated using calcium imaging (Fluo-4) after 3 days.

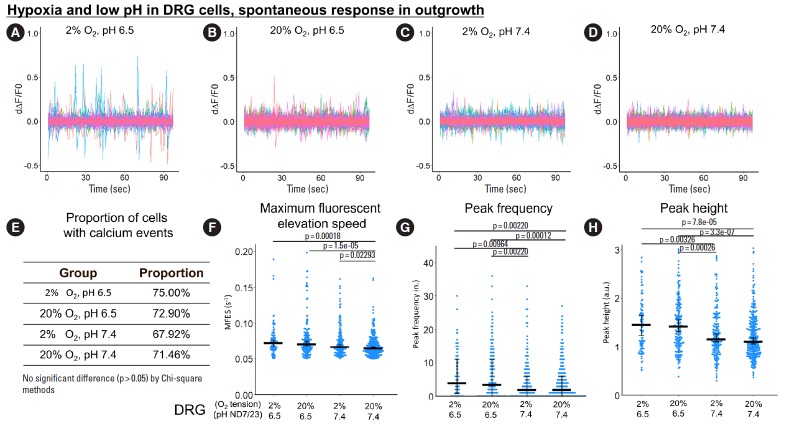
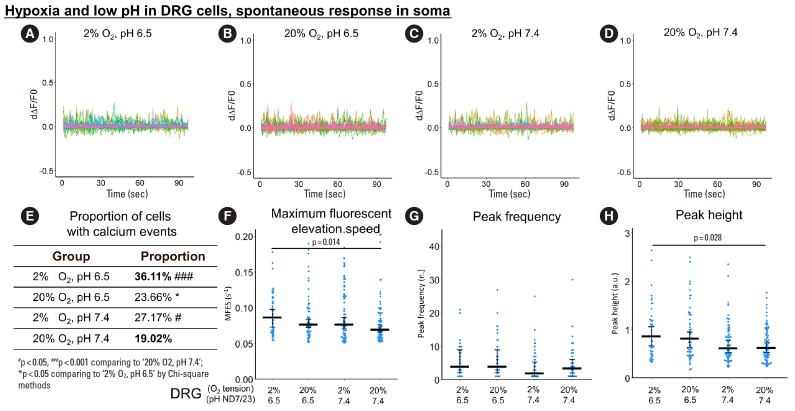
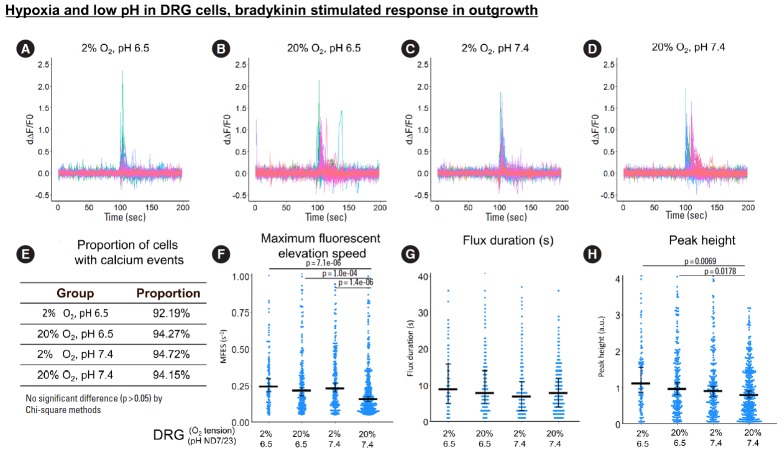
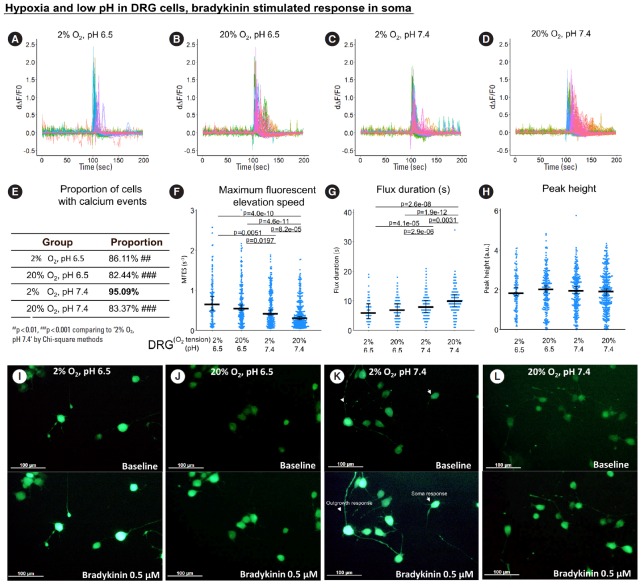
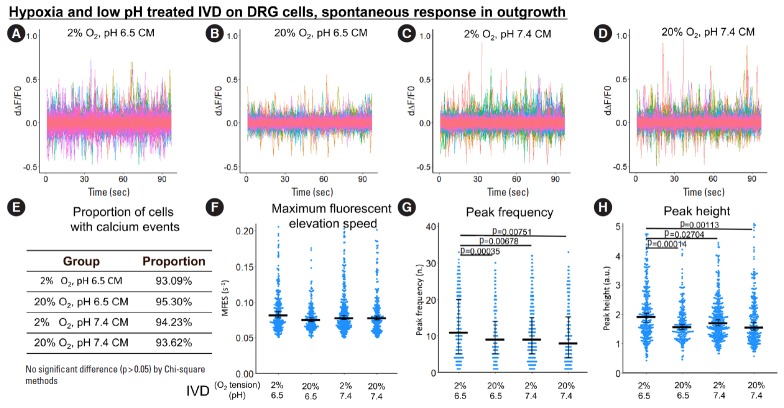
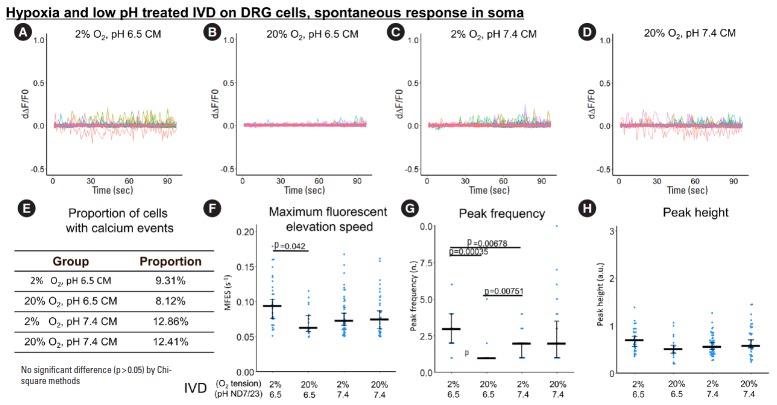
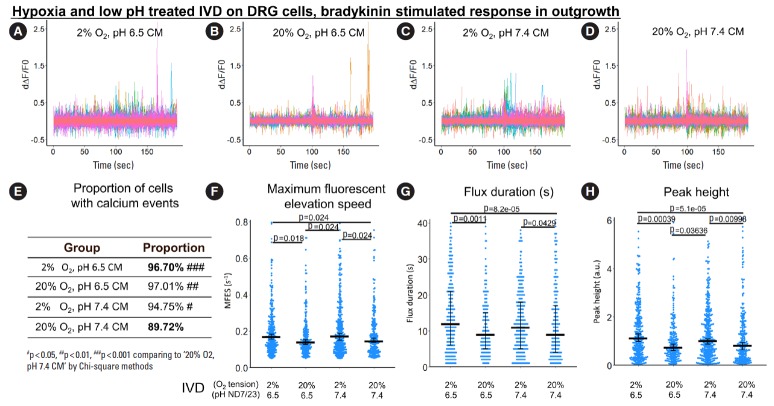
Results: We found that direct exposure of DRG cell line to hypoxia and acidosis increased both spontaneous and bradykinin-stimulated calcium response compared to normoxia-neutral pH cultures. Hypoxia and low pH in combination showed stronger effect than either parameter on its own. Indirect exposure of DRG to hypoxia-acidosis-stressed IVD CM also increased spontaneous and bradykinin-stimulated response, but to a lower extent than direct exposure. The impact of direct hypoxia and acidosis on DRG was validated in a primary sheep DRG cell culture, showing the same trend.

Conclusion: Our data suggest that targeting hypoxia and acidosis stresses both in IVD and DRG could be a relevant objective in discogenic pain treatment.

Keywords: Acidosis; Calcium Imaging; Dorsal root ganglion; Hypoxia; Intervertebral disc; Low back pain.


Conflict of interest statement

The authors have nothing to disclose.

Figures

Fig. 1.
Fig. 1.
Experimental setting of ND7/23 cells stimulated either directly by hypoxia and/or low pH stress (A) or indirectly by the conditioned medium from bovine IVDs preconditioned by hypoxia and/or low pH (B). (C-E) Workflow of calcium imaging data analysis. DRG, dorsal root ganglion; IVD, intervertebral disc; CM, conditioned medium; ROI, region of interest.
Fig. 2.
Fig. 2.
The influence of hypoxia and low pH on spontaneous response (from 0 to 100 seconds) in ND7/23 outgrowth. (A-D) First derivative of the normalized fluorescence (ratio of F-F0 and F0), which indicates intracellular calcium concentration fluctuation. Each colored curve represents one neurite outgrowth from each cell. Peaks in the curve are regarded as calcium events which indicate neuronal discharge. Around 120 to 450 cells per group were included for this study. (E) Proportion of cells with calcium events. The definition of calcium event is the peak in the derivative curve larger than 0.05/sec. Chi-square method was used for statistics. (F-H) Maximum fluorescent elevation speed, peak frequency, and peak height were calculated based on the derivative curve. Blue spots in the plots show data distribution; black bar represents median; error bars in panels F and H show 95% confident interval of median (calculated using bootstrapping method); while error bar in panel G shows 25% and 75% quantile. A p-value was calculated using pairwise comparisons of Wilcoxon rank sum test. A value of p<0.05 was regarded as significant and those values were shown in the plots. DRG, dorsal root ganglion.
Fig. 3.
Fig. 3.
The influence of hypoxia and low pH on spontaneous response (from 0 to 100 seconds) in ND7/23 soma. (A-D) First derivative of the normalized fluorescence (ratio of F-F0 and F0), which indicates intracellular calcium concentration fluctuation. Each colored curve represents one soma from each cell. Peaks in the curve are regarded as calcium events which indicate neuronal discharge. Around 120 to 450 cells per group were included for this study. (E) Proportion of cells with calcium events. The definition of calcium event is the peak in the derivative curve larger than 0.05/sec. Chi-square method was used for statistics. (F-H) Maximum fluorescent elevation speed, peak frequency, and peak height were calculated based on the derivative curve. Blue spots in the plots show data distribution; black bar represents median; error bars in panels F and H show 95% confident interval of median (calculated using bootstrapping method); while error bar in panel G shows 25% and 75% quantile. A p-value was calculated using pairwise comparisons of Wilcoxon rank sum test. A value of p<0.05 was regarded as significant and those values were shown in the plots. DRG, dorsal root ganglion.
Fig. 4.
Fig. 4.
The influence of hypoxia and low pH on bradykinin-stimulated response (from 0 to 100 seconds) in ND7/23 outgrowth. (A-D) First derivative of the normalized fluorescence (ratio of F-F0 and F0), which indicates intracellular calcium concentration fluctuation. Each colored curve represents one neurite outgrowth from each cell. Peaks in the curve are regarded as calcium events which indicate neuronal discharge. Around 120 to 450 cells per group were included for this study. (E) Proportion of cells with calcium events. The definition of calcium event is the peak in the derivative curve larger than 0.05/sec. Chi-square method was used for statistics. (F-H) Maximum fluorescent elevation speed, peak frequency, and peak height were calculated based on the derivative curve. Blue spots in the plots show data distribution; black bar represents median; error bars in panels F and H show 95% confident interval of median (calculated using bootstrapping method); while error bar in panel G shows 25% and 75% quantile. A p-value was calculated using pairwise comparisons of Wilcoxon rank sum test. A value of p<0.05 was regarded as significant and those values were shown in the plots. DRG, dorsal root ganglion.
Fig. 5.
Fig. 5.
The influence of hypoxia and low pH on bradykinin-stimulated response (from 0 second to 100 seconds) in ND7/23 soma. (A-D) First derivative of the normalized fluorescence (ratio of F-F0 and F0), which indicates intracellular calcium concentration fluctuation. Each colored curve represents one soma from each cell. Peaks in the curve are regarded as calcium events which indicate neuronal discharge. Around 120 to 450 cells per group were included for this study. (E) Proportion of cells with calcium events. The definition of calcium event is the peak in the derivative curve larger than 0.05/sec. Chi-square method was used for statistics. (F-H) Maximum fluorescent elevation speed, peak frequency, and peak height were calculated based on the derivative curve. Blue spots in the plots show data distribution; black bar represents median; error bars in panels F and H show 95% confident interval of median (calculated using bootstrapping method); while error bar in panel G shows 25% and 75% quantile. A p-value was calculated using pairwise comparisons of Wilcoxon rank sum test. A value of p<0.05 was regarded as significant and those values were shown in the plots. (I-L) Examples of images before (baseline) and at 0.5 μM bradykinin stimulation in the calcium imaging time-lapse sequence. Arrows in panel K indicate soma calcium response, while arrow heads in panel K indicate outgrowth calcium signal responding to bradykinin. Scale bars equal to 100 μm. DRG, dorsal root ganglion.
Fig. 6.
Fig. 6.
The influence of hypoxia-acidosis-stressed IVD CM on spontaneous response (from 0 to 100 seconds) in ND7/23 outgrowth. (A-D) First derivative of the normalized fluorescence (ratio of F-F0 and F0), which indicates intracellular calcium concentration fluctuation. Each colored curve represents one neurite outgrowth from each cell. Peaks in the curve are regarded as calcium events which indicate neuronal discharge. Around 120 to 450 cells per group were included for this study. (E) Proportion of cells with calcium events. The definition of calcium event is the peak in the derivative curve larger than 0.05/sec. Chi-square method was used for statistics. (F-H) Maximum fluorescent elevation speed, peak frequency, and peak height were calculated based on the derivative curve. Blue spots in the plots show data distribution; black bar represents median; error bars in panels F and H show 95% confident interval of median (calculated using bootstrapping method); while error bar in panel G shows 25% and 75% quantile. A p-value was calculated using pairwise comparisons of Wilcoxon rank sum test. A value of p<0.05 was regarded as significant and those values were shown in the plots. IVD, indirectly via intervertebral disc; CM, conditioned medium; DRG, dorsal root ganglion.
Fig. 7.
Fig. 7.
The influence of hypoxia-acidosis-stressed IVD CM on spontaneous response (from 0 to 100 seconds) in ND7/23 soma. (A-D) First derivative of the normalized fluorescence (ratio of F-F0 and F0), which indicates intracellular calcium concentration fluctuation. Each colored curve represents one soma from each cell. Peaks in the curve are regarded as calcium events which indicate neuronal discharge. Around 120 to 450 cells per group were included for this study. (E) Proportion of cells with calcium events. The definition of calcium event is the peak in the derivative curve larger than 0.05/sec. Chi-square method was used for statistical analysis. (F-H) Maximum fluorescent elevation speed, peak frequency, and peak height were calculated based on the derivative curve. Blue spots in the plots show data distribution; black bar represents median; error bars in panels F and H show 95% confident interval of median (calculated using bootstrapping method); while error bar in panel G shows 25% and 75% quantile. A p-value was calculated using pairwise comparisons of Wilcoxon rank sum test. A value of p<0.05 was regarded as significant and the values are shown in the plots. IVD, indirectly via intervertebral disc; CM, conditioned medium; DRG, dorsal root ganglion.
Fig. 8.
Fig. 8.
The influence of hypoxia-acidosis-stressed IVD CM on bradykinin-stimulated response (from 0 second to 100 seconds) in ND7/23 outgrowth. (A-D) First derivative of the normalized fluorescence (ratio of F-F0 and F0), which indicates intracellular calcium concentration fluctuation. Each colored curve represents one neurite outgrowth from each cell. Peaks in the curve are regarded as calcium events which indicate neuronal discharge. Around 120 to 450 cells per group were included for this study. (E) Proportion of cells with calcium events. The definition of calcium event is the peak in the derivative curve larger than 0.05/sec. Chi-square method was used for statistics. F-H Maximum fluorescent elevation speed, peak frequency, and peak height were calculated based on the derivative curve. Blue spots in the plots show data distribution; black bar represents median; error bars in panels F and H show 95% confident interval of median (calculated using bootstrapping method); while error bar in panel G shows 25% and 75% quantile. A p-value was calculated using pairwise comparisons of Wilcoxon rank sum test. A value of p<0.05 was regarded as significant and those values were shown in the plots. IVD, indirectly via intervertebral disc; CM, conditioned medium; DRG, dorsal root ganglion.
Fig. 9.
Fig. 9.
The influence of hypoxia-acidosis-stressed IVD CM on bradykinin-stimulated response (from 0 second to 100 seconds) in ND7/23 soma. (A-D) First derivative of the normalized fluorescence (ratio of F-F0 and F0), which indicates intracellular calcium concentration fluctuation. Each colored curve represents one soma from each cell. Peaks in the curve are regarded as calcium events which indicate neuronal discharge. Around 120 to 450 cells per group were included for this study. (E) Proportion of cells with calcium events. The definition of calcium event is the peak in the derivative curve larger than 0.05/sec. Chi-square method was used for statistics. (F-H) Maximum fluorescent elevation speed, peak frequency, and peak height were calculated based on the derivative curve. Blue spots in the plots show data distribution; black bar represents median; error bars in panels F and H show 95% confident interval of median (calculated using bootstrapping method); while error bar in panel G shows 25% and 75% quantile. A p-value was calculated using pairwise comparisons of Wilcoxon rank sum test. A value of p<0.05 was regarded as significant and those values were shown in the plots. IVD, indirectly via intervertebral disc; CM, conditioned medium; DRG, dorsal root ganglion.
Fig. 10.
Fig. 10.
The influence of hypoxia and low pH on calcium response of primary sheep DRG neuron. (A, B) Derivative fluorescent curve from 0 to 90 seconds which represent spontaneous response of the neurons. Each colored curve represents one neuronal structure. (C-F) Quantification of the spontaneous response using proportion of cells with calcium events, maximum fluorescent elevation speed, peak frequency, and peak height based on the derivative curve. (G, H) Derivative of fluorescent curve from 0 to 300 seconds. Bradykinin (0.5 μM) was added at the 100 seconds to evaluate the bradykinin-stimulated response while potassium chloride (50 mM) was added at the 200 seconds to differentiate neuronal structures from nonneuronal structures. Each curve represents one neuronal structure. (I-L) Quantification of the bradykinin-stimulated response using proportion of cells with calcium events, maximum fluorescent elevation speed, flux duration, and peak height based on the derivative curve. For panels A, B, G, H, peaks in the curve are regarded as calcium events which indicate neuronal discharge. The y-axis is the derivative level of normalized fluorescent (ratio of F-F0 and F0). Around n=140 to 180 neuronal structures per group were included for this study. For panels C, I, the definition of calcium event is the peak in the derivative curve larger than 0.05/sec. Chi-square method was used for statistics. For panels D, E, F, J, K, L, blue spots in the plots show data distribution; black bar represents median; error bars in panels D, F, J, and L show 95% confident interval of median (calculated using bootstrapping method); while error bar in panels E and K show 25% and 75% quantile. A p-value was calculated using pairwise comparisons of Wilcoxon rank sum test. A value of p<0.05 was regarded as significant and those values were shown in the plots. IVD, indirectly via intervertebral disc; CM, conditioned medium; DRG, dorsal root ganglion.
Fig. 11.
Fig. 11.
The influence of hypoxia and low pH on calcium response of primary sheep DRG nonneuronal structures. (A, B) Derivative of fluorescent curve from 0 to 90 seconds which represent spontaneous response of the nonneuronal structures. Each colored curve represents one nonneuronal structure. (C-F) Quantification of the spontaneous response using proportion of cells with calcium events, maximum fluorescent elevation speed, peak frequency, and peak height based on the derivative curve. (G, H) Derivative of fluorescent curve from 0 to 300 seconds. Bradykinin (0.5 μM) was added at the 100 seconds to evaluate the bradykinin-stimulated response while potassium chloride (50 mM) was added at the 200 seconds (Nonneurons do not have instant response to extracellular rise of potassium.). Each curve represents one nonneuronal structure. (I-L) Quantification of the bradykinin-stimulated response using proportion of cells with calcium events, maximum fluorescent elevation speed, peak frequency, and peak height based on the derivative curve. For panels A, B, G, H, peaks in the curve are regarded as calcium events which indicate event of intracellular calcium rise. The y-axis is the derivative level of normalized fluorescent (ratio of F-F0 and F0). Around n=660 to 785 nonneuronal structures per group were included for this study. For panels C, I, the definition of calcium event is the peak in the derivative curve larger than 0.05/sec. Chi-square method was used for statistics. For panels D, E, F, J, K, L, blue spots in the plots show data distribution; black bar represents median; error bars in panels D, F, J, and L show 95% confident interval of median (calculated using bootstrapping method); while error bars in panels E and K show 25% and 75% quantile. A value of p<0.05 was regarded as significant and those values were shown in the plots. DRG, dorsal root ganglion.

Similar articles

Cited by

References

    1. GBD 2016 Disease and Injury Incidence and Prevalence Collaborators Global, regional, and national incidence, prevalence, and years lived with disability for 328 diseases and injuries for 195 countries, 1990-2016: a systematic analysis for the Global Burden of Disease Study 2016. Lancet. 2017;390:1211–59. - PMC - PubMed
    1. DePalma MJ, Ketchum JM, Saullo T. What is the source of chronic low back pain and does age play a role? Pain Med. 2011;12:224–33. - PubMed
    1. Zhang YG, Guo TM, Guo X, et al. Clinical diagnosis for discogenic low back pain. Int J Biol Sci. 2009;5:647–58. - PMC - PubMed
    1. Hangai M, Kaneoka K, Kuno S, et al. Factors associated with lumbar intervertebral disc degeneration in the elderly. Spine J. 2008;8:732–40. - PubMed
    1. Kauppila LI. Atherosclerosis and disc degeneration/low-back pain--a systematic review. Eur J Vasc Endovasc Surg. 2009;37:661–70. - PubMed

LinkOut - more resources