

Glycomics Microarrays Reveal Differential In Situ Presentation of the Biofilm Polysaccharide Poly- N-acetylglucosamine on Acinetobacter baumannii and Staphylococcus aureus Cell Surfaces
- PMID: 32252300
- PMCID: PMC7177611
- DOI: 10.3390/ijms21072465
Glycomics Microarrays Reveal Differential In Situ Presentation of the Biofilm Polysaccharide Poly- N-acetylglucosamine on Acinetobacter baumannii and Staphylococcus aureus Cell Surfaces
Abstract
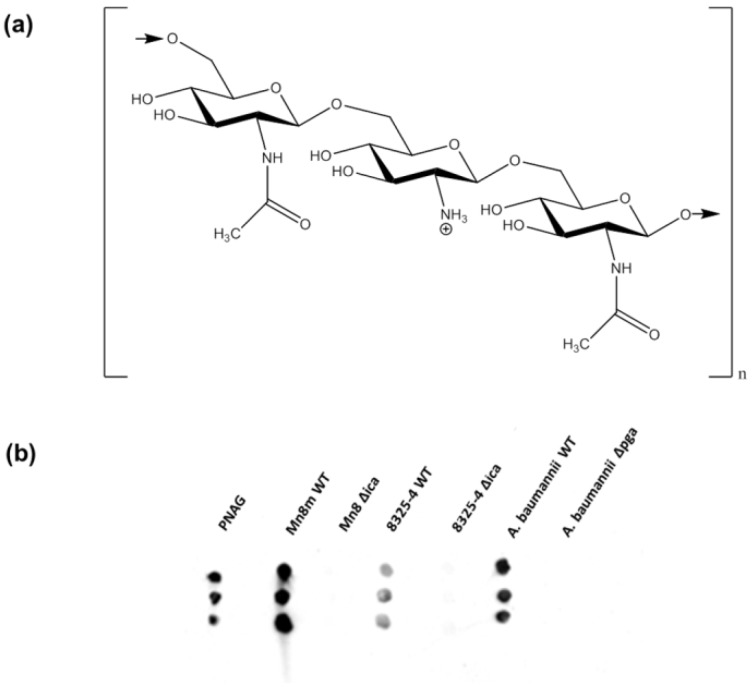
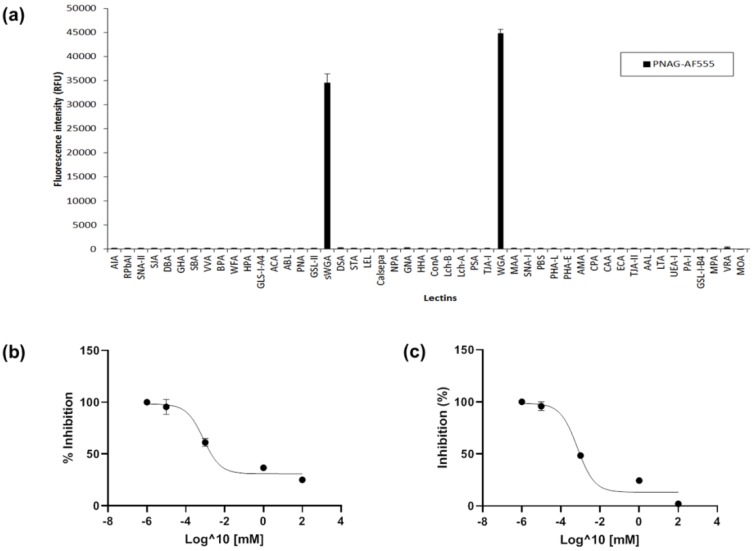
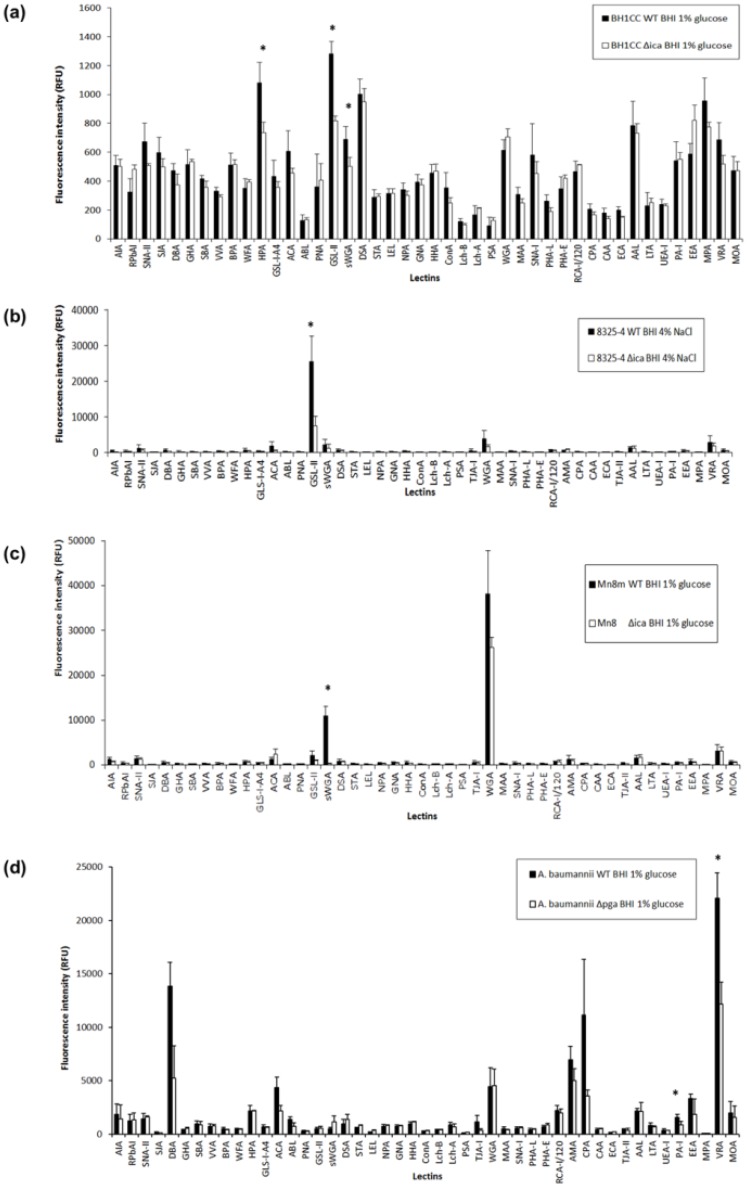
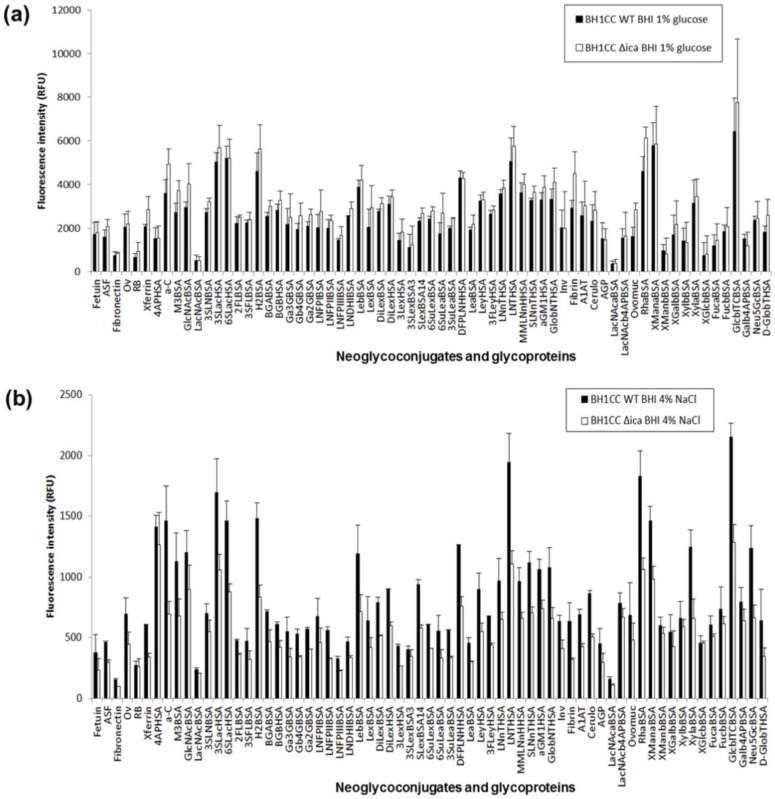
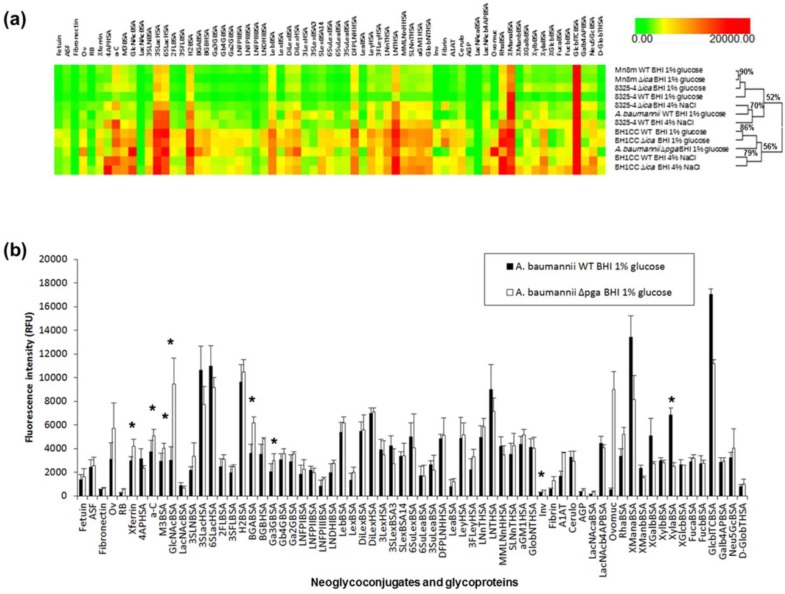
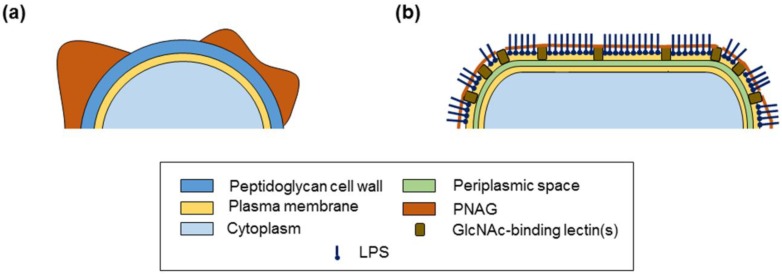
The biofilm component poly-N-acetylglucosamine (PNAG) is an important virulence determinant in medical-device-related infections caused by ESKAPE group pathogens including Gram-positive Staphylococcus aureus and Gram-negative Acinetobacter baumannii. PNAG presentation on bacterial cell surfaces and its accessibility for host interactions are not fully understood. We employed a lectin microarray to examine PNAG surface presentation and interactions on methicillin-sensitive (MSSA) and methicillin-resistant S. aureus (MRSA) and a clinical A. baumannii isolate. Purified PNAG bound to wheatgerm agglutinin (WGA) and succinylated WGA (sWGA) lectins only. PNAG was the main accessible surface component on MSSA but was relatively inaccessible on the A. baumannii surface, where it modulated the presentation of other surface molecules. Carbohydrate microarrays demonstrated similar specificities of S. aureus and A. baumannii for their most intensely binding carbohydrates, including 3' and 6'sialyllactose, but differences in moderately binding ligands, including blood groups A and B. An N-acetylglucosamine-binding lectin function which binds to PNAG identified on the A. baumannii cell surface may contribute to biofilm structure and PNAG surface presentation on A. baumannii. Overall, these data indicated differences in PNAG presentation and accessibility for interactions on Gram-positive and Gram-negative cell surfaces which may play an important role in biofilm-mediated pathogenesis.
Keywords: Acinetobacter baumannii; PNAG; Staphylococcus aureus; bacterial adhesins; biofilm; glycomics microarrays; lectin; poly-N-acetylglucosamine; polysaccharide.
Conflict of interest statement
Gerald B. Pier is an inventor of intellectual properties (human monoclonal antibody to PNAG and PNAG vaccines) that are licensed by Brigham and Women’s Hospital to Alopexx Vaccine, LLC, and Alopexx Pharmaceuticals, LLC, entities in which Gerald B. Pier also holds equity. As an inventor of intellectual properties, Gerald B. Pier also has the right to receive a share of licensing-related income (royalties, fees) through Brigham and Women’s Hospital from Alopexx Pharmaceuticals, LLC, and Alopexx Vaccine, LLC. Gerald B. Pier’s interests were reviewed and are managed by the Brigham and Women’s Hospital and Partners Healthcare in accordance with their conflict of interest policies. The other authors declare no competing financial interests. The funders had no role in the design of the study; in the collection, analyses, or interpretation of data; in the writing of the manuscript, or in the decision to publish the results.
Figures
Similar articles
-
The pgaABCD locus of Acinetobacter baumannii encodes the production of poly-beta-1-6-N-acetylglucosamine, which is critical for biofilm formation.J Bacteriol. 2009 Oct;191(19):5953-63. doi: 10.1128/JB.00647-09. Epub 2009 Jul 24. J Bacteriol. 2009. PMID: 19633088 Free PMC article.
-
σB Inhibits Poly-N-Acetylglucosamine Exopolysaccharide Synthesis and Biofilm Formation in Staphylococcus aureus.J Bacteriol. 2019 May 8;201(11):e00098-19. doi: 10.1128/JB.00098-19. Print 2019 Jun 1. J Bacteriol. 2019. PMID: 30858304 Free PMC article.
-
Differential roles of poly-N-acetylglucosamine surface polysaccharide and extracellular DNA in Staphylococcus aureus and Staphylococcus epidermidis biofilms.Appl Environ Microbiol. 2008 Jan;74(2):470-6. doi: 10.1128/AEM.02073-07. Epub 2007 Nov 26. Appl Environ Microbiol. 2008. PMID: 18039822 Free PMC article.
-
Polysaccharide intercellular adhesin in biofilm: structural and regulatory aspects.Front Cell Infect Microbiol. 2015 Feb 10;5:7. doi: 10.3389/fcimb.2015.00007. eCollection 2015. Front Cell Infect Microbiol. 2015. PMID: 25713785 Free PMC article. Review.
-
[Influence of poly-β-1-6-N-acetylglucosamine on biofilm formation and drug resistance of Acinetobacter baumannii].Zhonghua Shao Shang Za Zhi. 2015 Feb;31(1):45-7. Zhonghua Shao Shang Za Zhi. 2015. PMID: 25876639 Review. Chinese.
Cited by
-
Remodeling of the Enterococcal Cell Envelope during Surface Penetration Promotes Intrinsic Resistance to Stress.mBio. 2022 Dec 20;13(6):e0229422. doi: 10.1128/mbio.02294-22. Epub 2022 Nov 10. mBio. 2022. PMID: 36354750 Free PMC article.
-
Factors mediating Acinetobacter baumannii biofilm formation: Opportunities for developing therapeutics.Curr Res Microb Sci. 2022 Mar 28;3:100131. doi: 10.1016/j.crmicr.2022.100131. eCollection 2022. Curr Res Microb Sci. 2022. PMID: 35909621 Free PMC article. Review.
-
Uncovering virulence factors in Cronobacter sakazakii: insights from genetic screening and proteomic profiling.Appl Environ Microbiol. 2023 Oct 31;89(10):e0102823. doi: 10.1128/aem.01028-23. Epub 2023 Sep 26. Appl Environ Microbiol. 2023. PMID: 37750707 Free PMC article.
-
Virulence Potential and Treatment Options of Multidrug-Resistant (MDR) Acinetobacter baumannii.Microorganisms. 2021 Oct 6;9(10):2104. doi: 10.3390/microorganisms9102104. Microorganisms. 2021. PMID: 34683425 Free PMC article. Review.
-
The RNA Chaperone Hfq and Small Non-Coding RNAs Modulate the Biofilm Formation of the Fish Pathogen Yersinia ruckeri.Int J Mol Sci. 2025 May 15;26(10):4733. doi: 10.3390/ijms26104733. Int J Mol Sci. 2025. PMID: 40429875 Free PMC article.
References
-
- World Health Organisation . Report on the Burden of Endemic Health Care-Associated Infection Worldwide. World Health Organisation; Geneva, Switzerland: 2011.
MeSH terms
Substances
Grants and funding
LinkOut - more resources
Full Text Sources
Molecular Biology Databases
