. 2020 Apr 2;12(4):990.
doi: 10.3390/nu12040990.

Elevation of the Blood Glucose Level is Involved in an Increase in Expression of Sweet Taste Receptors in Taste Buds of Rat Circumvallate Papillae

Affiliations

Elevation of the Blood Glucose Level is Involved in an Increase in Expression of Sweet Taste Receptors in Taste Buds of Rat Circumvallate Papillae

Moemi Iwamura et al. Nutrients. .

Abstract

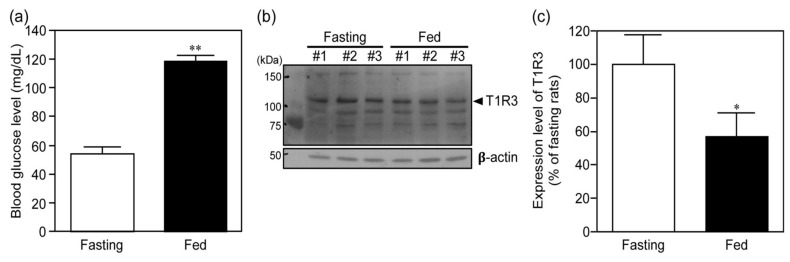
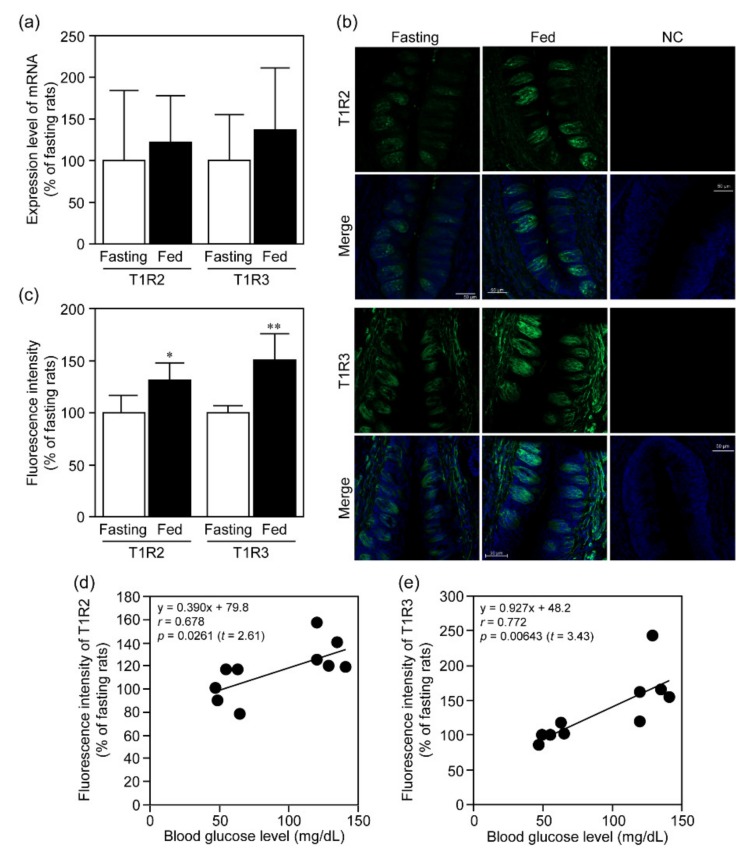
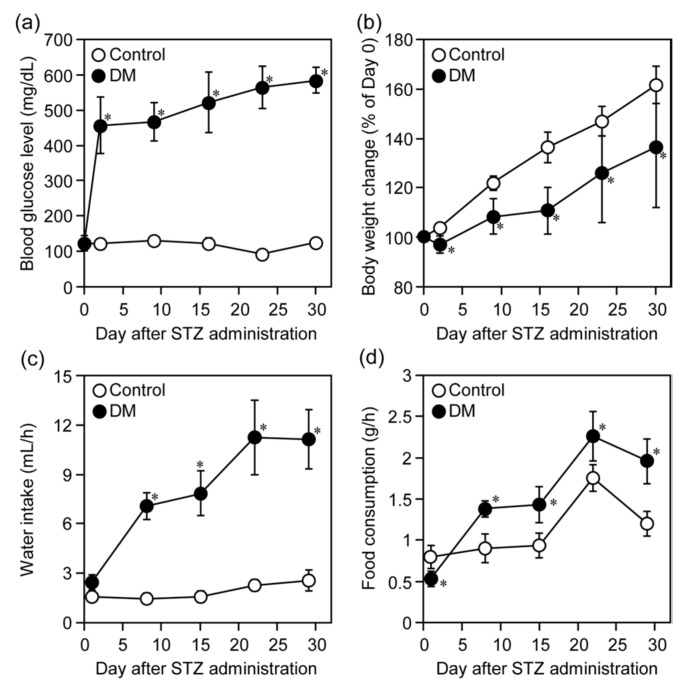
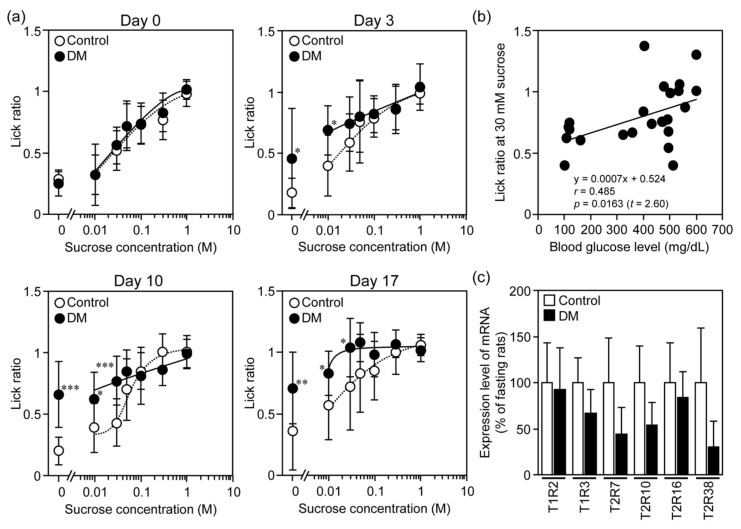
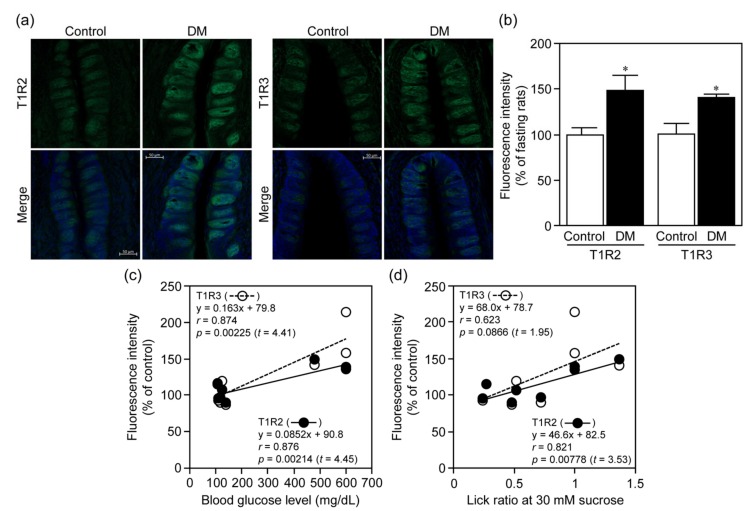
The gustation system for sweeteners is well-known to be regulated by nutritional and metabolic conditions, but there is no or little information on the underlying mechanism. Here, we examined whether elevation of the blood glucose level was involved in alteration of the expression of sweet taste receptors in circumvallate papillae (CP) and sweet taste sensitivity in male Sprague-Dawley rats. Rats under 4 h-fed conditions following 18 h-fasting exhibited elevated blood glucose levels and decreased pancreatic T1R3 expression, compared to rats after 18 h-fasting treatment, and they exhibited increased protein expression of sweet taste receptors T1R2 and T1R3 in CP. Under streptozotocin (STZ)-induced diabetes mellites (DM) conditions, the protein expression levels of T1R2 and T1R3 in CP were higher than those under control conditions, and these DM rats exhibited increased lick ratios in a low sucrose concentration range in a brief access test with a mixture of sucrose and quinine hydrochloride (QHCl). These findings indicate that the elevation of blood glucose level is a regulator for an increase in sweet taste receptor protein expression in rat CP, and such alteration in STZ-induced DM rats is involved in enhancement of their sweet taste sensitivity.

Keywords: blood glucose level; diabetes mellites; fasting and fed condition; gustation; sweet taste; taste bud.


Conflict of interest statement

The authors declare that they have no conflicts of interests.

Figures

Figure 1
Figure 1
Blood glucose levels and expression of T1R3 in the pancreas in rats under fasting and fed conditions. After 18 h-fasting with or without subsequent 4 h-fed treatment of rats, their blood glucose levels (a) and expression of T1R3 in the pancreas (b,c) were measured. The results shown in panel c were obtained based on the band density of T1R3 corrected for by that of ß-actin shown in panel b. In panel b, #1, #2 and #3 are the rat numbers. Each bar represents the mean ± SD for three rats. * p < 0.05 and ** p < 0.001 (vs. fasting).
Figure 2
Figure 2
Expression of T1R2 and T1R3 in rat CP under fasting and fed conditions. After 18 h-fasting with or without subsequent 4 h-fed treatment of rats, the expression levels of T1R2 and T1R3 in CP isolated from their tongues were determined by real-time PCR (a) and immunohistochemical analysis (b,c). In panel a, mRNA expression levels of T1R2 and T1R3 were normalized against the corresponding levels of β-actin mRNA. In panel b, green and blue signals indicate expression of T1R2 or T1R3 and nuclei, respectively, and the results for fluorescence intensity derived from the immunoreactivity of T1R2 and T1R3 are given in panel c. In panel b, we linearly adjusted the contrast of whole images including the background by changing the input value from 255 to 200 in the images for T1R2 in fasting and fed groups. NC (negative control) was prepared by omitting the primary antibodies. Bar = 50 µm. Each bar represents the mean ± SD for 4 (a), and 4 (fasting of T1R3) or 5 (fasting and fed T1R2 and fed T1R3) (b,c) rats. *p<0.05 and **p<0.01 (vs. fasting). Panels d and e indicate correlation between blood glucose levels and expression levels of T1R2 or T1R3 in rats.
Figure 3
Figure 3
STZ administration induced DM conditions in rats. Blood glucose levels (a), body weight (b), water intake (c), and food consumption (d) in rats were measured just before (day 0) and weekly for 3 weeks after i.p. administration of STZ (50 mg/kg) to them. Each point represents the mean ± SD for 10 (control) and 6 (STZ) rats. * p < 0.001 (vs. control).
Figure 4
Figure 4
Alteration of the sensitivity and expression of receptors for sweet and bitter taste in STZ-induced DM rats. (a) Lick ratios were measured by means of a brief access test just before (day 0), and 3, 10 and 17 after i.p. administration of STZ (50 mg/kg) to them. Panel b indicates correlation between blood glucose levels and lick ratios at 30 mM sucrose on Days 0, 3, 10 and 17 in rats. (c) The expression levels of mRNAs for sweet (T1R2 and T1R3) and bitter (T2R7, T2R10, T2R16 and T2R38) taste receptors in CP isolated from their tongues on day 35 were determined by real-time PCR. mRNA expression levels of taste receptors were normalized against the corresponding levels of β-actin mRNA. Each point/bar represents the mean ± SD for 10 (control) and 6 (STZ) rats. * p < 0.05, ** p < 0.01, *** p < 0.001 (vs. control).
Figure 5
Figure 5
Protein expression of sweet taste receptors in CP of STZ-induced DM rats. The expression levels of T1R2 and T1R3 in CP isolated from the tongues of rats on day 35 were determined by immunohistochemical analysis. In panel a, green and blue signals indicate expression of T1R2 or T1R3 and nuclei, respectively, and the results for fluorescence intensity derived from the immunoreactivity of T1R2 and T1R3 are given in panel b. In panel a, we linearly adjusted the contrast of whole images including background by changing the input value from 255 to 150 in the images for T1R2 and T1R3 in control and DM groups. Bar = 50 µm. Each bar represents the mean ± SD for 5 (control) or 3 (STZ) rats. * p < 0.01 (vs. control). Panels c and d indicate correlation between blood glucose levels and expression levels of T1R2 or T1R3 on Day 35, and between lick ratios at 30 mM sucrose on Day 17 and expression levels of T1R2 or T1R3 on Day 35, respectively, in rats.

Similar articles

Cited by

References

    1. Nelson G., Hoon M.A., Chandrashekar J., Zhang Y., Ryba N.J., Zuker C.S. Mammalian sweet taste receptors. Cell. 2001;106:381–390. doi: 10.1016/S0092-8674(01)00451-2. - DOI - PubMed
    1. Temussi P. The sweet taste receptor: A single receptor with multiple sites and modes of interaction. Adv. Food Nutr. Res. 2007;53:199–239. doi: 10.1016/S1043-4526(07)53006-8. - DOI - PubMed
    1. Behrens M., Meyerhof W. A role for taste receptors in (neuro)endocrinology? J. Neuroendocrinol. 2019;31:e12691. doi: 10.1111/jne.12691. - DOI - PubMed
    1. Nakagawa Y., Nagasawa M., Mogami H., Lohse M., Ninomiya Y., Kojima I. Multimodal function of the sweet taste receptor expressed in pancreatic beta-cells: Generation of diverse patterns of intracellular signals by sweet agonists. Endocr. J. 2013;60:1191–1206. doi: 10.1507/endocrj.EJ13-0282. - DOI - PubMed
    1. Nakagawa Y., Nagasawa M., Yamada S., Hara A., Mogami H., Nikolaev V.O., Lohse M.J., Shigemura N., Ninomiya Y., Kojima I. Sweet taste receptor expressed in pancreatic beta-cells activates the calcium and cyclic AMP signaling systems and stimulates insulin secretion. PLoS ONE. 2009;4:e5106. doi: 10.1371/journal.pone.0005106. - DOI - PMC - PubMed