. 2020 Apr 2;17(7):2429.
doi: 10.3390/ijerph17072429.

Exposure of Live-Line Workers to Magnetic Fields: A Dosimetric Analysis

Affiliations

Exposure of Live-Line Workers to Magnetic Fields: A Dosimetric Analysis

Oriano Bottauscio et al. Int J Environ Res Public Health. .

Abstract

In this paper the authors present the results of a dosimetric analysis related to the exposure of live-line workers to the magnetic fields generated by high voltage overhead lines and substations. The study extends the work published by Dawson et al. in 2002, considering more evolved anatomical models nowadays available, the new reference limits given by the 2013/35/EU Directive, and a new methodology, based on the intercomparison of two alternative solvers and the use of data filtering. Moreover, additional exposure scenarios are here considered with respect to the studies already available in literature. The results show that for the exposure scenario of high voltage live line works with bare hand method, in any analyzed position, the exposure limits for the tissues of the central nervous system, as well as for all other tissues, are never exceeded, despite in some cases the action levels are exceeded. For the exposure of workers in substations near 220 kV and 380 kV line trap coils exposure is compliant with the regulatory limits if the current flowing through the line trap does not exceed the value of 1000 A. Finally, for the exposure of workers in substations near cable connections, electric field values induced in the body are always lower than regulatory limits with a phase current value equal to 1600 A r.m.s.

Keywords: dosimetry analysis; electromagnetic fields; human exposure; live-line working.


Conflict of interest statement

The authors declare no conflict of interest.

Figures
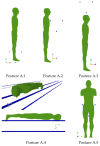
Figure 1
Figure 1
Five considered positions of the human body with reference to the exposure scenario A. The traces of the conductors are also reported in the figures.
Figure 2
Figure 2
Two considered positions of the human body with reference to the exposure scenario B. On the left the case of 220 kV line trap coil (B.1), on the right the case of the 380 kV line trap coil (B.2).
Figure 3
Figure 3
Two considered positions of the human body with reference to the exposure scenario C.1, with the human body close to the central (C.1a) or lateral (C.1b) phase conductor. The traces of the conductors are also reported in the figure.
Figure 4
Figure 4
Example of data filtering applied to raw data (values obtained with a unitary current amplitude imposed to the conductors) computed with the two solvers for Posture A.2. On the upper plots, the frequency distributions of the natural logarithm of the gradient of the sorted values of the E-field magnitude. On the lower plots the correction of data applying the filtering technique. On the left the data for the A-ϕ solver, on the right the data for the T solver.
Figure 5
Figure 5
Frequency distribution of entire set of ratios between maximum E-field values (after filtering) obtained with T solver (E_outT) with respect to the A-ϕ solver (E_outA-ϕ), computed for each tissue.
Figure 6
Figure 6
Results for posture A.1. On the left (a) the spatial distribution of the B-field amplitude (r.m.s. values in millitesla) over the body surface. In the middle (b) the corresponding spatial distribution of the E-field amplitude (peak values in volt per metre) over the body surface. On the right (c) the distribution of the voxel values.
Figure 7
Figure 7
Results for posture A.2. On the left (a) the spatial distribution of the B-field amplitude (r.m.s. values in millitesla) over the body surface. In the middle (b) the corresponding spatial distribution of the E-field amplitude (peak values in volt per metre) over the body surface. On the right (c) the distribution of the voxel values.
Figure 8
Figure 8
Results for posture A.3. On the left (a) the spatial distribution of the B-field amplitude (r.m.s. values in millitesla) over the body surface. In the middle (b) the corresponding spatial distribution of the E-field amplitude (peak values in volt per metre) over the body surface. On the right (c) the distribution of the voxel values.
Figure 9
Figure 9
Results for posture A.4. On the upper left (a) the spatial distribution of the B-field amplitude (r.m.s. values in millitesla) over the body surface. On the lower left (b) the corresponding spatial distribution of the E-field amplitude (peak values in volt per metre) over the body surface. On the right (c) the distribution of the voxel values.
Figure 10
Figure 10
Results for posture A.5. On the left (a) the spatial distribution of the B-field amplitude (r.m.s. values in millitesla) over the body surface. In the middle (b) the corresponding spatial distribution of the E-field amplitude (peak values in volt per metre) over the body surface. On the right (c) the distribution of the voxel values.
Figure 11
Figure 11
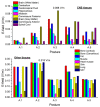
Exposure scenario A: on the upper diagram, maximum values of E-field (V/m) for the CNS tissues, on the bottom diagram, maximum values of E-field (V/m) for a selection of other tissues.
Figure 12
Figure 12
Results for posture B.1. On the left the (a) spatial distribution of the B-field amplitude (r.m.s. values, in millitesla) over the body surface. In the middle (b) the corresponding spatial distribution of the E-field amplitude (peak values, in volt per metre) over the body surface. On the right (c) the distribution of the voxel values.
Figure 13
Figure 13
Results for posture B.2. On the left (a) the spatial distribution of the B-field amplitude (r.m.s. values, in millitesla) over the body surface. In the middle (b) the corresponding spatial distribution of the E-field amplitude (peak values, in volt per metre) over the body surface. On the right (c) the distribution of the voxel values.
Figure 14
Figure 14
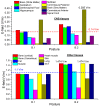
Exposure scenario B: on the upper diagram, maximum values of E-field (V/m) for the CNS tissues, on the bottom diagram, maximum values of E-field (V/m) for a selection of other tissues.
Figure 15
Figure 15
Results for posture C.1. On the upper left (a) the spatial distribution of the B-field amplitude (r.m.s. values, in millitesla) over the body surface for the two body positions. On the lower left (b) the corresponding spatial distribution of the E-field amplitude (peak values, in volt per metre) over the body surface. On the right the distributions of the voxel values: upper diagram (c) corresponding to the posture C.1a, lower diagram (d) corresponding to the posture C.1b.
Figure 16
Figure 16
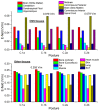
Exposure scenario C: on the upper diagram, maximum values of E-field (V/m) for the CNS tissues, on the bottom diagram, maximum values of E-field (V/m) for a selection of other tissues.

References

    1. Tamus Z.A., Németh B., Novák B., Kimpián A., Kiss I., Szűcs L., Berta I. Examination of electric field exposure of live line workers; Proceedings of the XVII International Symposium on High Voltage Engineering; Hannover, Germany. 22–26 August 2011.
    1. The European Parliament and the Council of the European Union . Directive 2013/35/EU on the Minimum Health and Safety Requirements Regarding the Exposure of Workers to the Risks Arising from Physical Agents (Electromagnetic Fields) European Union; Brussels, Belgium: 2013.
    1. International Commission on Non-Ionizing Radiation Protection (ICNIRP) Guidelines for limiting exposure to time varying electric and magnetic fields (1 Hz to 100 kHz) Health Phys. 2010;99:818–836. - PubMed
    1. International Commission on Non-Ionizing Radiation Protection (ICNIRP) Guidelines on limits of exposure to static magnetic fields. Health Phys. 2009;96:504–514. doi: 10.1097/01.HP.0000343164.27920.4a. - DOI - PubMed
    1. Habiballah I.O., Abdel-Galil T.K., Dawoud M.M., Belhadj C.A., Arif Abdul-Majeed M., Al-Betairi T.A. ELF Electric and Magnetic Fields Exposure Assessment of Live-Line Workers for 132 kV Transmission Line of SEC; Proceedings of the 2006 IEEE/PES Transmission and Distribution Conference and Exposition Latin America; Caracas, Venezuela. 15–18 August 2016; - DOI

Publication types