. 2020 Apr 6;19(1):83.
doi: 10.1186/s12934-020-01343-y.

Recombinant protein production associated growth inhibition results mainly from transcription and not from translation

Affiliations

Recombinant protein production associated growth inhibition results mainly from transcription and not from translation

Zhaopeng Li et al. Microb Cell Fact. .

Abstract

Background: Recombinant protein production can be stressful to the host organism. The extent of stress is determined by the specific properties of the recombinant transcript and protein, by the rates of transcription and translation, and by the environmental conditions encountered during the production process.

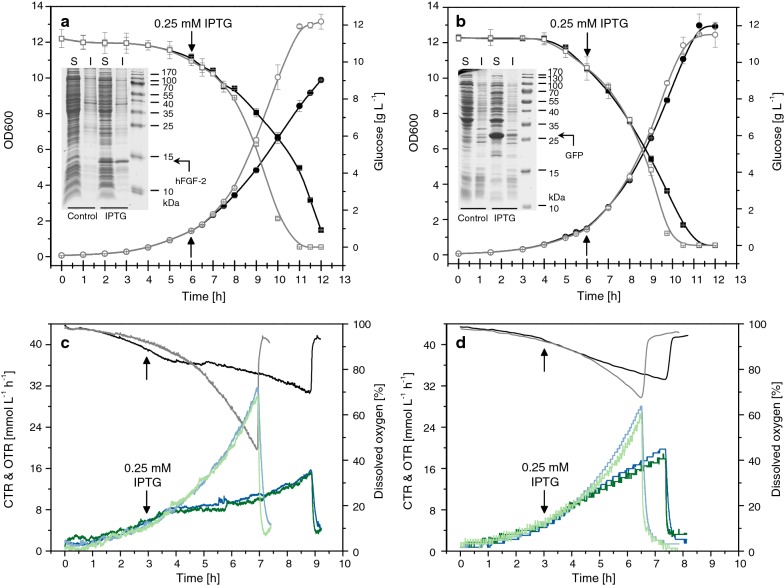
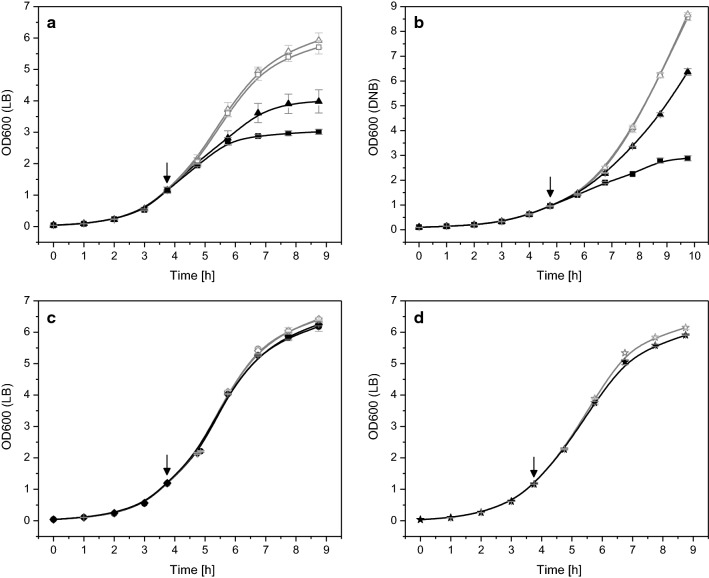
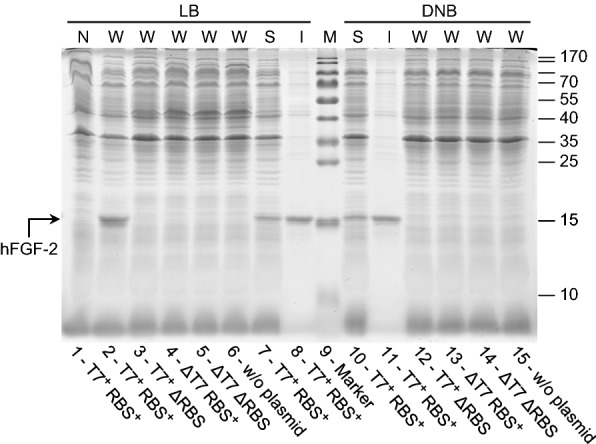
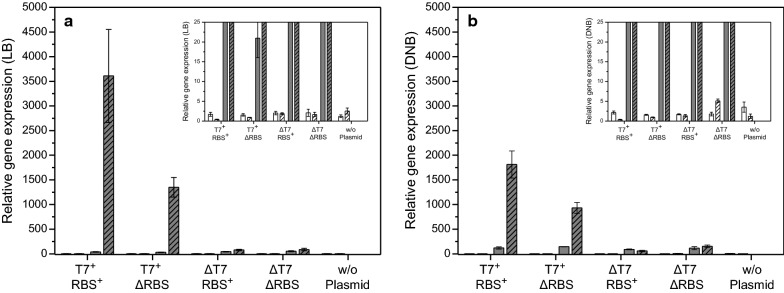
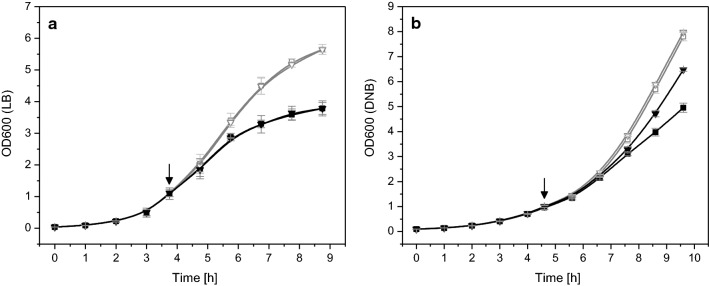
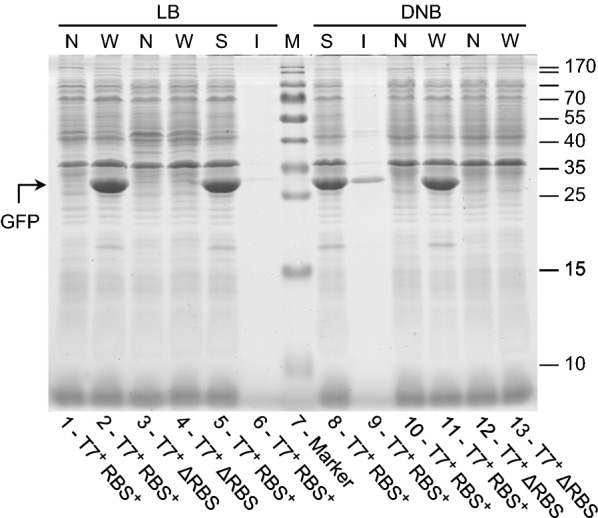
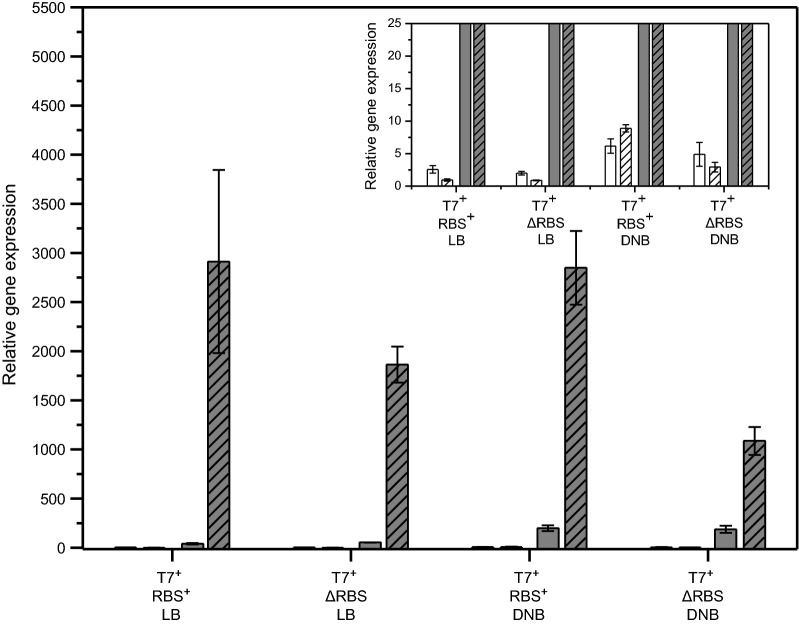
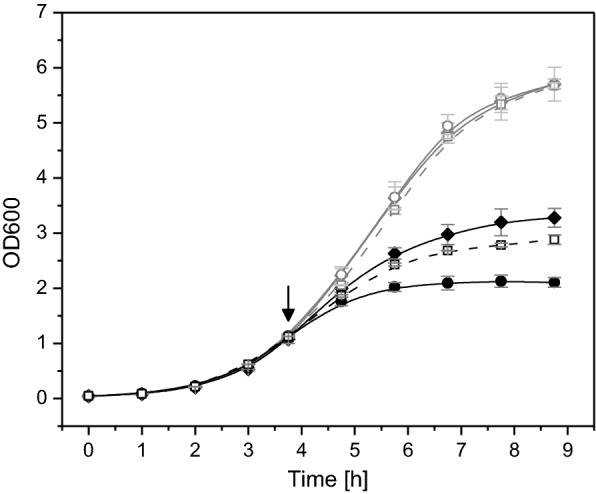
Results: The impact of the transcription of the T7-promoter controlled genes encoding human basic fibroblast growth factor (hFGF-2) and green fluorescent protein (GFP) as well as the translation into the recombinant protein on the growth properties of the production host E. coli BL21(DE3) were investigated. This was done by using expression vectors where the promoter region or the ribosome binding site(s) or both were removed. It is shown that already transcription without protein translation imposes a metabolic burden on the host cell. Translation of the transcript into large amounts of a properly folded protein does not show any effect on cell growth in the best case, e.g. high-level production of GFP in Luria-Bertani medium. However, translation appears to contribute to the metabolic burden if it is connected to protein folding associated problems, e.g. inclusion body formation.

Conclusion: The so-called metabolic burden of recombinant protein production is mainly attributed to transcription but can be enhanced through translation and those processes following translation (e.g. protein folding and degradation, heat-shock responses).

Keywords: Escherichia coli; Metabolic burden; Recombinant protein production; Transcriptional burden.


Conflict of interest statement

The authors declare that they have no competing interests.

Figures

Fig. 1
Fig. 1
Growth inhibition resulting from the production of different recombinant proteins. Production of a, c hFGF-2 and b, d GFP using E. coli BL21 (DE3) as expression host was carried out in a, b Fernbach flasks with baffles and in c, d bioreactor batch cultures employing a defined mineral salt medium with glucose as carbon substrate. a, b OD600 (circles), glucose (squares) and SDS-PAGE analysis of target protein production (S: soluble, and I: insoluble cell protein of control and producing cells, the positions of target proteins are indicated) are shown. c, d Carbon dioxide (CTR, green lines) and oxygen transfer rates (OTR, blue lines) as well as dissolved oxygen concentrations (black and gray lines) are given. The arrows indicate the time point of IPTG addition to a final concentration of 0.25 mM in production experiments. Dark colored symbols and lines correspond to production experiments. Light colored lines and open gray symbols correspond to control experiments where IPTG addition was omitted. Data are presented as mean ± SD, n = 2
Fig. 2
Fig. 2
Already transcription of the recombinant gene causes growth inhibition. Growth properties of E. coli BL21 (DE3) with expression vectors carrying the gene encoding hFGF-2 in shake-flask cultures with a Luria–Bertani (LB) or b defined glucose-supplemented mineral salt medium. Growth of cells carrying the original expression vector with promoter region and with RBS (squares) and the expression vector with promoter region but without RBS in front of the hFGF-2 gene (triangles). c Growth of cells on LB medium carrying the expression vector without promoter region but with RBS (circles) and without promoter region and without RBS (diamonds). d Control cultures of cells without any expression vector growing on LB medium (stars). Full black symbols always correspond to IPTG induced cultures and open gray symbols to cultures where IPTG addition was omitted. The time-point of IPTG addition to a final concentration of 0.5 mM is indicated by an arrow. Data are presented as mean ± SD, n = 4
Fig. 3
Fig. 3
hFGF-2 production only detectable when promoter region and RBS are present. SDS-PAGE analysis of IPTG induced cells carrying the gene encoding hFGF-2 growing on LB medium (lanes 1–8) and glucose supplemented mineral salt medium DNB (lanes 10–15) collected 4 h after induction. Lane 1: N, T7+ RBS+ (non-induced control, total cell extract of cells containing the expression vector with promoter and with RBS in front of the hFGF-2 gene), lane 2: W, T7+ RBS+ (induced cells with promoter and with RBS), lanes 3, 12: W, T7+ ΔRBS (with promoter but without RBS), lanes 4, 13: W, ΔT7 RBS+ (without promoter but with RBS), lanes 5, 14: W, ΔT7 ΔRBS (without promoter and without RBS), lanes 6, 15: W, w/o plasmid (induced E. coli BL21(DE3) without expression vector), lanes 7, 10: S, T7+ RBS+ (soluble) and lanes 8, 11: I, T7+ RBS+ (insoluble cell fraction of induced cells containing the expression vector with promoter and with RBS). Lane 9: molecular mass marker, the position of hFGF-2 is indicated by an arrow. N: non-induced whole cell protein W: induced whole cell protein, S: induced soluble part, and I: induced insoluble part of whole cell protein
Fig. 4
Fig. 4
hFGF-2 transcript levels under inducing and non-inducing conditions. a Transcript levels in E. coli BL21(DE3) transformed with expression vectors carrying the gene encoding hFGF-2 in shake-flask cultures with a Luria–Bertani (LB) medium or b defined glucose-supplemented mineral salt medium (DNB). Trancripts of genes encoding the major elongation factor EF-Tu (white bars) and hFGF-2 (gray bars) are shown in non-induced cells (open bars) and 4 h after IPTG induction (hatched bars). T7+ RBS+: cells containing the expression vector with promoter and with RBS in front of the hFGF-2 gene; T7+ ΔRBS: with promoter but without RBS; ΔT7 RBS+: without promoter but with RBS; ΔT7 ΔRBS: without promoter and without RBS; w/o plasmid: E. coli BL21(DE3) without expression vector. The inserts depict the same data as the main figures only at different scale. Transcripts of rrsH, were used as internal standard and artificially defined as 10,000. Data are presented as mean ± SD, n = 4
Fig. 5
Fig. 5
Recombinant protein translation itself does not impair cell growth but folding associated problems contribute to growth inhibition. a Growth properties of E. coli BL21(DE3) with expression vectors carrying the gene encoding GFP in shake-flask cultures with a Luria–Bertani medium or b defined glucose-supplemented mineral salt medium (DNB). Growth of cells carrying the original expression vector with promoter region and with RBS (squares) and the expression vector with promoter region but without RBS in front of the hFGF-2 gene (triangles). Full black symbols always correspond to IPTG induced cultures and open gray symbols to cultures where IPTG addition was omitted. The time-point of IPTG addition to a final concentration of 0.5 mM is indicated by an arrow. Data are presented as mean ± SD, n = 4
Fig. 6
Fig. 6
GFP only forms inclusion bodies during production on defined medium. SDS-PAGE analysis of IPTG induced cells carrying the gene encoding GFP growing on LB medium (lanes 1–6) and glucose supplemented mineral salt medium (lanes 8–13) collected 4 h after induction. Lanes 1, 10: N, T7+ RBS+ (non-induced controls, total cell extract of cells containing the expression vector with promoter and with RBS in front of the GFP gene), lanes 2, 11: W, T7+ RBS+ (induced cells with promoter and with RBS), lanes 3, 12: N, T7+ ΔRBS (non induced controls with promoter but without RBS), lanes 4, 13: W, T7+ ΔRBS (induced cells with promoter but without RBS), lanes 5, 8: S, T7+ RBS+ (soluble) and lanes 6, 9: I, T7+ RBS+ (insoluble cell fraction of induced cells containing the expression vector with promoter and with RBS). Lane 7: molecular mass marker, the position of GFP is indicated by an arrow. N: non-induced whole cell protein W: induced whole cell protein, S: induced soluble part, and I: induced insoluble part of whole cell protein
Fig. 7
Fig. 7
GFP transcript levels under inducing and non-inducing conditions. Transcript levels in E. coli BL21(DE3) transformed with expression vectors carrying the gene encoding GFP in shake-flask cultures with Luria–Bertani (LB) medium or defined glucose-supplemented mineral salt medium (DNB). Trancripts of genes encoding the major elongation factor EF-Tu (white bars) and GFP (gray bars) are shown in non-induced cells (open bars) and 4 h after IPTG induction (hatched bars). T7+ RBS+: cells containing the expression vector with promoter and with RBS in front of the GFP gene; T7+ ΔRBS: with promoter but without RBS. The insert depicts the same data set as the main figure only at different scale. Transcripts of rrsH were used as internal standard and artificially defined as 10,000. Data are presented as mean ± SD, n = 4
Fig. 8
Fig. 8
Growth properties of E. coli BL21 (DE3) carrying the “empty” pET-28c expression vector. Cells carrying the original “empty” pET-28c expression vector with promoter region and RBS (circles) and the “empty” vector with promoter region but without RBS (diamonds) were grown in shake flask cultures in Luria–Bertani medium. Growth of cells carrying the original expression vector encoding hFGF-2 with promoter region and with RBS is revisited for a better comparison (broken lines, open squares). Black symbols always correspond to IPTG induced cultures and gray symbols to cultures where IPTG addition was omitted. The time-point of IPTG addition to a final concentration of 0.5 mM is indicated by an arrow. Data are presented as mean ± SD, n = 4

References

    1. Bentley WE, Mirjalili N, Anderson DC, Davis R, Kompala DS. Plasmid-encoded protein: the principal factor in the “metabolic burden” associated with recombinant bacteria. Biotechnol Bioeng. 1990;35:668–681. doi: 10.1002/bit.260350704. - DOI - PubMed
    1. Bhattacharya SK, Dubey AK. Metabolic burden as reflected by maintenance coefficient of recombinant Escherichia coli overpressing target gene. Biotechnol Lett. 1995;17:1155–1160. doi: 10.1007/BF00128377. - DOI
    1. Lecina M, Sarro E, Casablancas A, Godia F, Cairo JJ. IPTG limitation avoids metabolic burden and acetic acid accumulation in induced fedbatch cultures of Escherichia coli M15 under glucose limiting conditions. Biochem Eng J. 2012;70:78–83. doi: 10.1016/j.bej.2012.10.006. - DOI
    1. Gubellini F, Verdon G, Karpowich NK, Luff JD, Boel G, Gauthier N, Handelman SK, Ades SE, Hunt JF. Physiological response to membrane protein overexpression in E. coli. Mol Cell Proteomics. 2011;10:M111. doi: 10.1074/mcp.M111.007930. - DOI - PMC - PubMed
    1. Gasser B, Saloheimo M, Rinas U, Dragosits M, Rodríguez-Carmora E, Baumann K, Giuliani M, Parrilli E, Branduardi P, Lang C, Porro D, Ferrer P, Tutino ML, Mattanovich D, Villaverde A. Protein folding and conformational stress in microbial cells producing recombinant proteins: a host comparative overview. Microb Cell Fact. 2008;7:11. doi: 10.1186/1475-2859-7-11. - DOI - PMC - PubMed

MeSH terms

Substances

LinkOut - more resources