. 2020 Apr 6;21(1):90.
doi: 10.1186/s13059-020-01982-9.

Principles of RNA processing from analysis of enhanced CLIP maps for 150 RNA binding proteins

Affiliations

Principles of RNA processing from analysis of enhanced CLIP maps for 150 RNA binding proteins

Eric L Van Nostrand et al. Genome Biol. .

Abstract

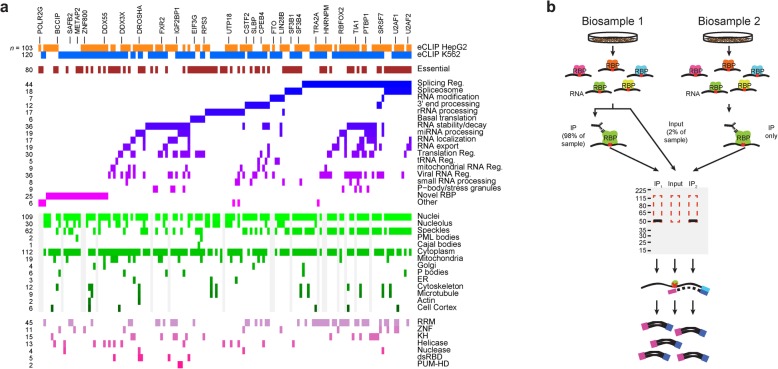
Background: A critical step in uncovering rules of RNA processing is to study the in vivo regulatory networks of RNA binding proteins (RBPs). Crosslinking and immunoprecipitation (CLIP) methods enable mapping RBP targets transcriptome-wide, but methodological differences present challenges to large-scale analysis across datasets. The development of enhanced CLIP (eCLIP) enabled the mapping of targets for 150 RBPs in K562 and HepG2, creating a unique resource of RBP interactomes profiled with a standardized methodology in the same cell types.

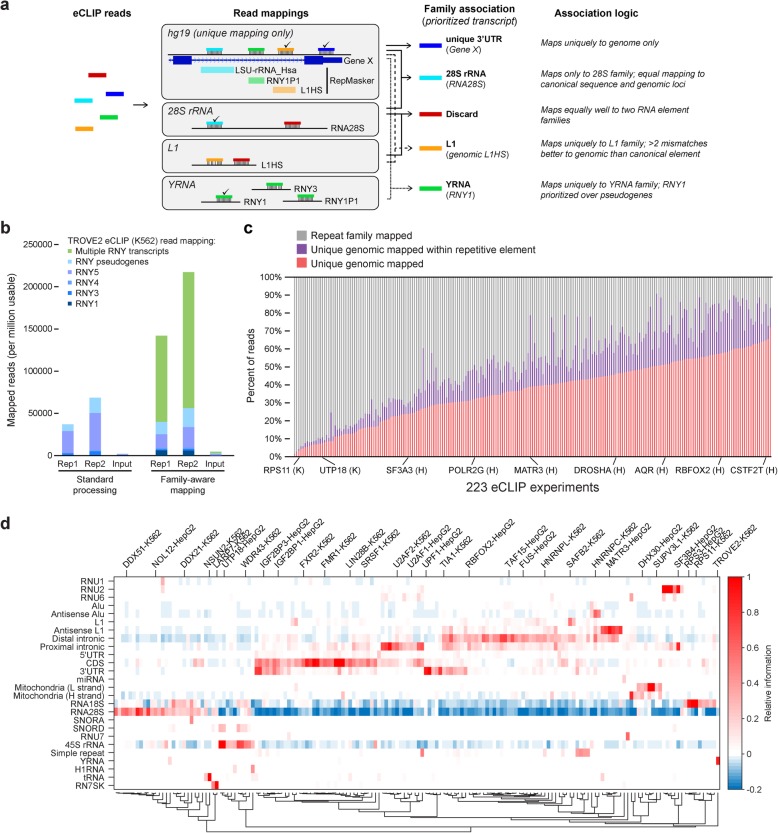
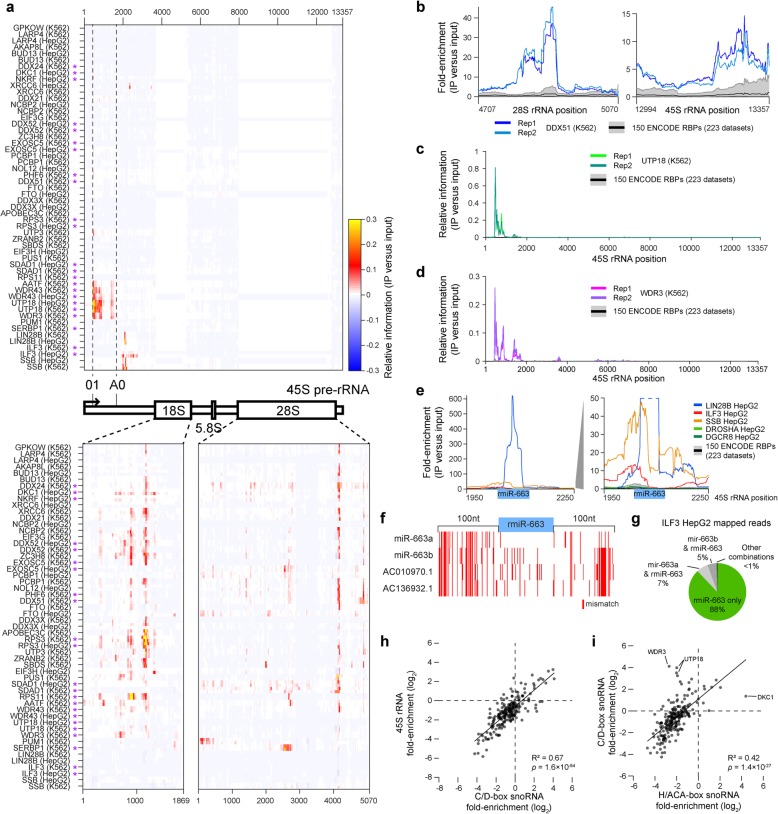
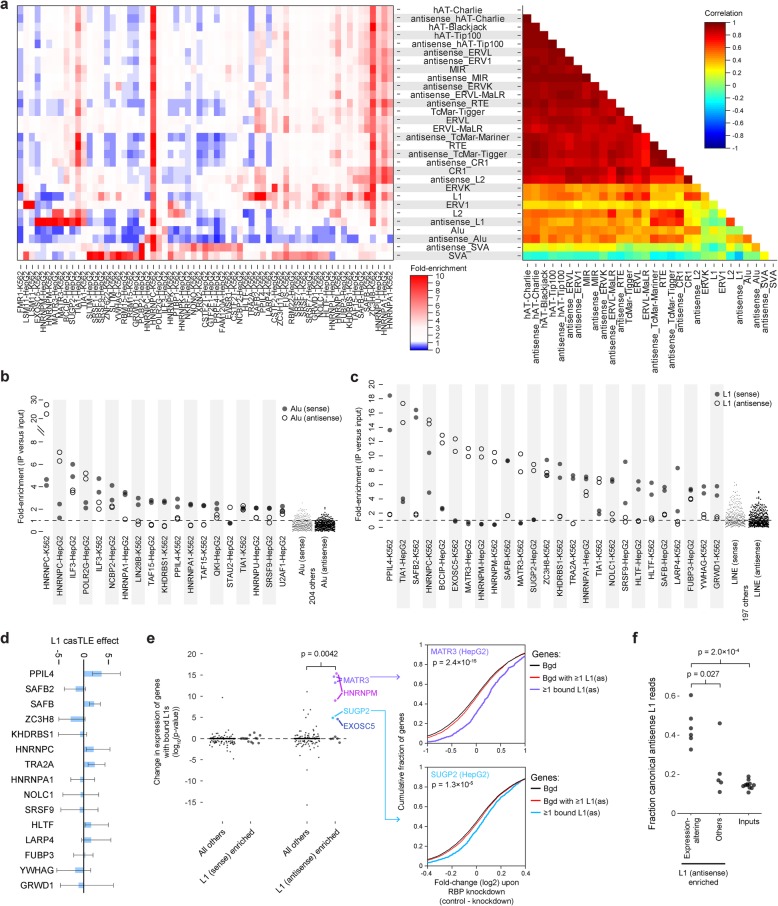
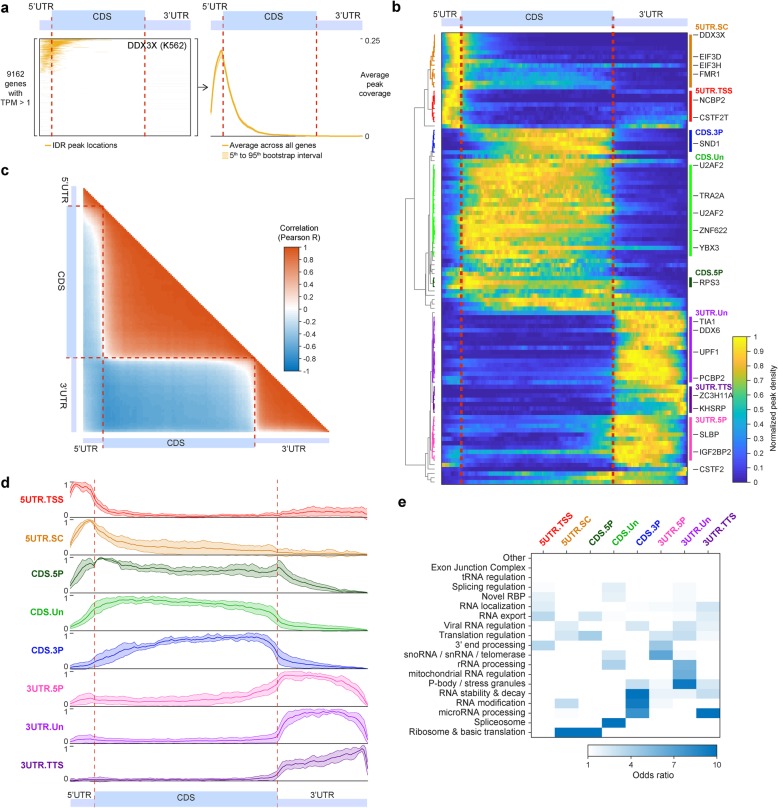
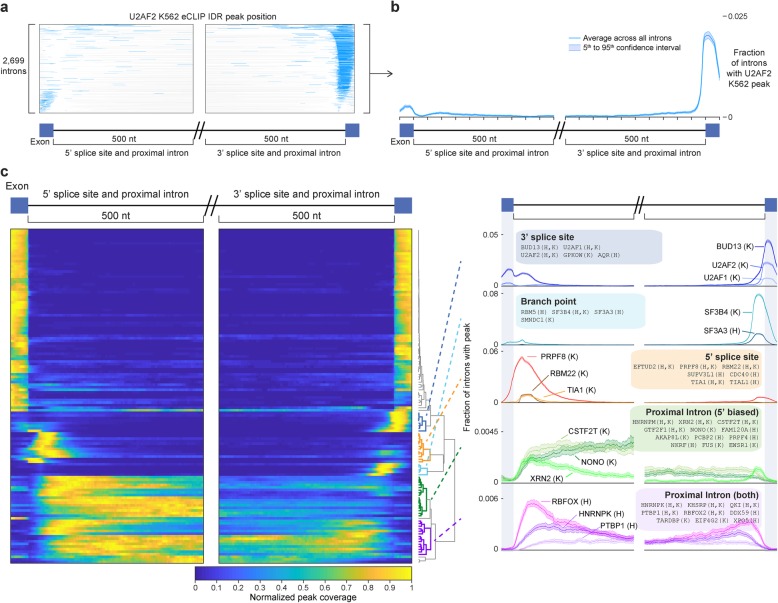
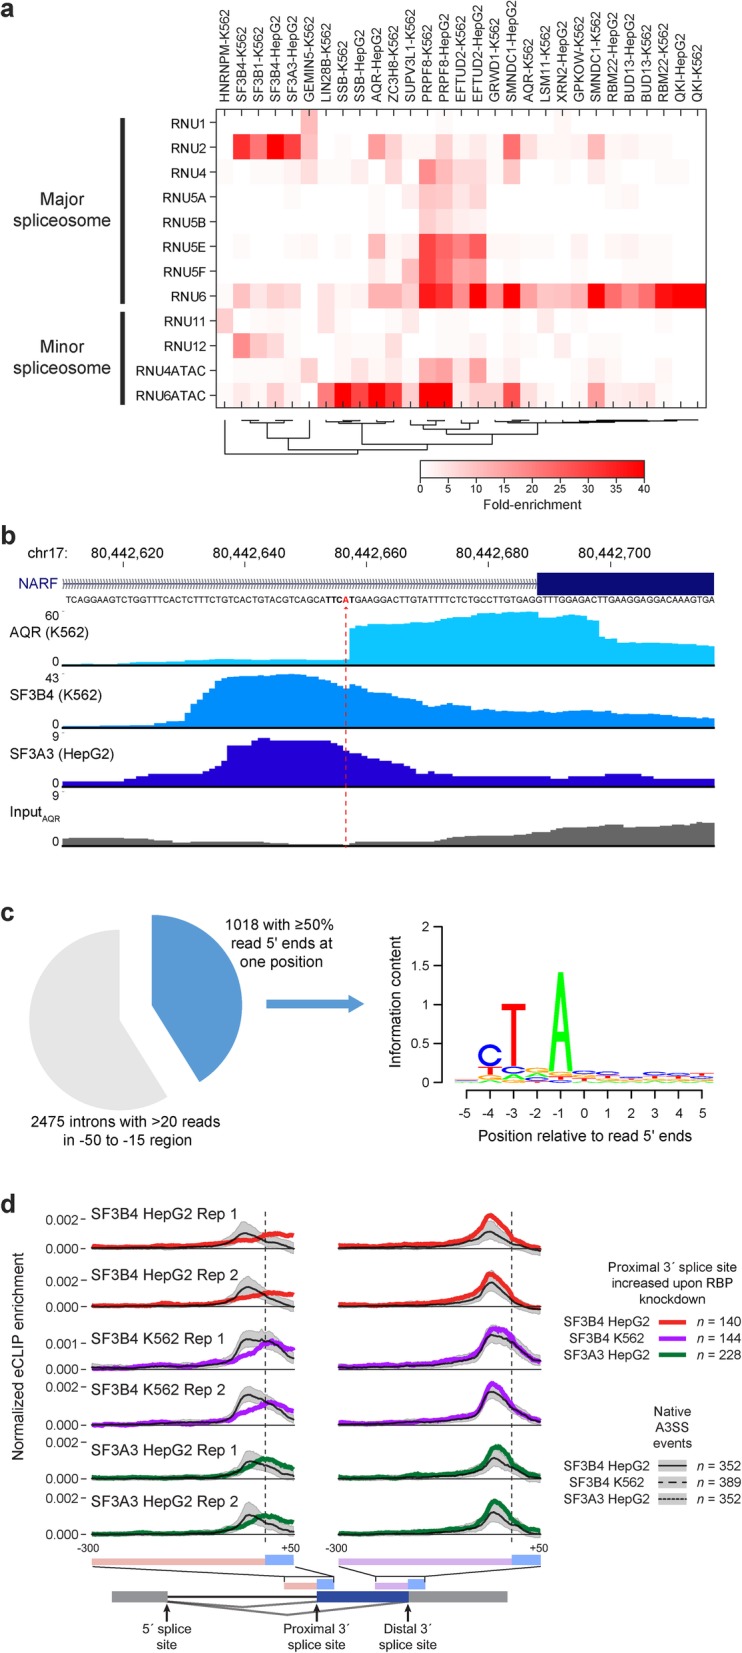
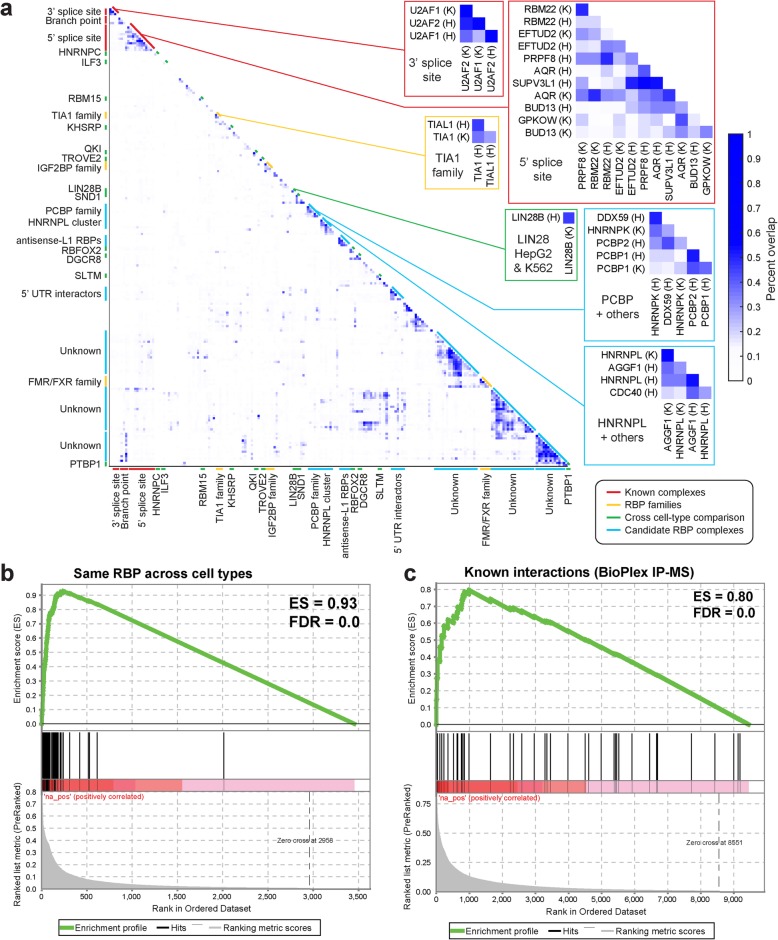
Results: Our analysis of 223 eCLIP datasets reveals a range of binding modalities, including highly resolved positioning around splicing signals and mRNA untranslated regions that associate with distinct RBP functions. Quantification of enrichment for repetitive and abundant multicopy elements reveals 70% of RBPs have enrichment for non-mRNA element classes, enables identification of novel ribosomal RNA processing factors and sites, and suggests that association with retrotransposable elements reflects multiple RBP mechanisms of action. Analysis of spliceosomal RBPs indicates that eCLIP resolves AQR association after intronic lariat formation, enabling identification of branch points with single-nucleotide resolution, and provides genome-wide validation for a branch point-based scanning model for 3' splice site recognition. Finally, we show that eCLIP peak co-occurrences across RBPs enable the discovery of novel co-interacting RBPs.

Conclusions: This work reveals novel insights into RNA biology by integrated analysis of eCLIP profiling of 150 RBPs with distinct functions. Further, our quantification of both mRNA and other element association will enable further research to identify novel roles of RBPs in regulating RNA processing.

Keywords: CLIP-seq; RNA binding protein; RNA processing; eCLIP.


Conflict of interest statement

ELVN is co-founder, member of the Board of Directors, on the SAB, equity holder, and paid consultant for Eclipse BioInnovations. GWY is co-founder, member of the Board of Directors, on the SAB, equity holder, and paid consultant for Locana and Eclipse BioInnovations. GWY is a visiting professor at the National University of Singapore. ELVN's and GWY's interests have been reviewed and approved by the University of California, San Diego in accordance with its conflict of interest policies. The other authors declare that they have no competing interests.

Figures

Fig. 1
Fig. 1
Two hundred twenty-three eCLIP datasets profile targets for 150 RNA binding proteins. a Colors indicate RBPs profiled by eCLIP, with manually annotated RBP functions, subcellular localization patterns from immunofluorescence imaging, and predicted RNA binding domains indicated (Additional file 1). b Schematic overview of eCLIP as performed in the datasets described here. Two biological replicates (defined as biosamples from separate cell thaws and crosslinked more than a week apart) were performed for each RBP, along with one size-matched input taken from one of the two biosamples prior to immunoprecipitation
Fig. 2
Fig. 2
Quantification of repetitive elements and other non-uniquely mapped reads. a Graphical representation of repetitive element mapping. Reads are mapped to human genome (requiring unique mapping) and a database of repetitive element families. Reads are then associated with RNA element families based on mismatch score, with (red) reads discarded if mapping equally well to more than one family. b Stacked bars indicate the number of reads from TROVE2 eCLIP in K562 that map either uniquely to one of four primary Y RNA transcripts, map uniquely to Y RNA pseudogenes (identified by RepeatMasker), or (for family-aware mapping) map to multiple Y RNA transcripts but not uniquely to the genome or to other repetitive element families. c Stacked bars indicate the fraction of reads (averaged between replicates) of all 223 eCLIP experiments, separated by whether they map (red) uniquely to the genome, (purple) uniquely to the genome but within a repetitive element identified by RepeatMasker, or (gray) to repetitive element families. Datasets are sorted by the fraction of unique genomic reads. d Heatmap indicates the relative information for 26 elements and 168 eCLIP datasets, requiring elements and datasets to have at least one entry meeting a 0.2 relative information cutoff (based on Additional file 3: Fig. S2d). See Table 1 for RBP:element enrichments meeting this criteria and Additional file 5 for all enrichments
Fig. 3
Fig. 3
eCLIP enrichment for rRNA links RBPs with ribosomal RNA processing. a Heatmap indicates relative information at each position along (top) the ribosomal RNA precursor 45S polycistronic transcript and (bottom) within the mature 18S and 28S transcripts. Reads mapping equally to the 45S and mature 18S or 28S are assigned to the mature for quantitation. Purple asterisk indicates RBPs for which knockdown showed rRNA processing defects in Tafforeau et al. [28]. b Lines indicate fold-enrichment in DDX51 eCLIP in K562 cells at the 3′ end of the 28S and 45S transcript. For this and further plots, black line indicates mean and gray region indicates 10th to 90th percentile across all 223 eCLIP datasets. c, d Lines indicate relative information for c UTP18 in K562 and d WDR3 in K562 across the 45S precursor. e Lines indicate fold-enrichment for indicated RBPs within a region flanking putative ribosomal-encoded microRNA rmiR-663. f Red indicates mismatch positions relative to ribosomal rmiR-663 (and 100 nt flanking regions) for genomic-encoded miR-663a, miR-663b, and two additional homologous regions containing putative microRNAs. g Pie chart indicates the fraction of reads in ILF3 HepG2 eCLIP mapping (green) with fewer mismatches to rmiR-663, or (gray) mapping equally well to rmiR-663 and other miR-663 family members as indicated. See Additional file 3: Fig. S3j-k for LIN28B (HepG2) and SSB (HepG2). h, i Points indicate fold-enrichment in each eCLIP dataset for h C/D-box snoRNAs versus 45S precursor RNA, and i H/ACA-box snoRNAs versus C/D-box snoRNAs. Pearson’s correlation and significance were calculated in MATLAB
Fig. 4
Fig. 4
RBP association at retrotransposable and other repetitive elements. a (left) Heatmap indicates fold-enrichment in eCLIP versus paired input, averaged across two biological replicates. Shown are 30 RepBase elements which had average RPM > 100 in input experiments and at least one RBP with greater than 5-fold enrichment and 65 eCLIP experiments with greater than 5-fold enrichment for at least one element. (right) Color indicates correlation in fold-enrichment between elements across the 65 experiments. b, c Points indicate fold-enrichment for b Alu elements and c L1 LINE elements in individual biological replicates. Shown are all RBPs with average enrichment of at least 2 (for Alu elements) or 5 (for L1 elements). d Bars indicate L1 retrotransposition casTLE effect score (positive score indicates increased retrotransposition upon RBP knockout), with error bars indicating 95% minimum and maximum credible interval estimates (data from Liu et al. [38]). e (left) Each point indicates significance (from two-sided Kolmogorov-Smirnov test) between fold changes observed in RNA-seq of RBP knockdown for the set of genes with one or more RBP-bound L1 (or antisense L1) elements versus the set of genes containing one or more L1 (or antisense L1) elements but lacking RBP binding (defined as overlap with an IDR peak). RBPs were separated based on requiring 5-fold enrichment for L1 elements as in c. (right) Cumulative distribution plots for (top) MATR3 in HepG2 and (bottom) SUGP2 in HepG2. Significance shown is versus the set of genes containing one or more L1 (or antisense L1) elements but lacking RBP binding (red line). f Points indicate the fraction of antisense L1-assigned reads that map to canonical (RepBase) elements for six expression-altering antisense L1-enriched eCLIP datasets (from e), five other antisense-L1 enriched eCLIP datasets, and 11 paired input samples. Significance is from the two-sided non-parametric Kolmogorov-Smirnov test. See Additional file 3: Fig. S4g for the full distribution of read assignments
Fig. 5
Fig. 5
mRNA meta-gene profiles from eCLIP correspond to RBP regulatory roles. a (left) Each line indicates the presence (orange) of a reproducible DDX3X K562 eCLIP peak for 9162 mRNAs that are expressed (TPM > 1) in K562. Each gene was normalized to 13 5′UTR, 100 CDS, and 49 3′UTR bins (based on average lengths among expressed transcripts in K562 cells). (right) A meta-mRNA plot is generated by averaging across all expressed genes, with shaded region indicating 5th to 95th percentile observed in 100 bootstrap samplings. b Heatmap indicates peak coverage for 104 datasets (requiring at least 100 reproducible peaks and at least one meta-mRNA position with 5th percentile greater than 0.002). Color indicates the average occupancy, normalized by setting (blue) minimum value to zero and (yellow) maximum to one. Meta-mRNA profiles were hierarchically clustered and manually labeled. c Heatmap indicates pairwise correlation (Pearson’s R) between each pair of positions along the meta-mRNA in b. d Lines indicate average normalized peaks per bin for all RBPs in the indicated class. Shaded region indicates one standard deviation. e Heatmap indicates odds ratio of overlap between eCLIP datasets in (x-axis) indicated meta-mRNA cluster versus (y-axis) annotated RBP functions. See Additional file 3: Fig. S5d for significance
Fig. 6
Fig. 6
Meta-exon plots reveal intronic regulatory roles. a Each line indicates the presence (in blue) of a reproducible U2AF2 K562 eCLIP peak for 2699 introns that contain at least one peak within the displayed region (500 nt of proximal intron and 50 nt of exon flanking the 5′ and 3′ splice sites). See Additional file 3: Fig. S6a for all 89,265 introns. b Meta-exon plot for data shown in a, with line indicating average and shaded region indicating 5th to 95th percent confidence interval (derived by 100 bootstrap samplings). c (left) Heatmap indicates average peak coverage across all introns for 130 RBPs with at least 100 peaks and 5th percentile confidence interval at least 0.0005 (for heatmap visualization, the maximum value for each dataset was set to one to calculate normalized coverage). (right) Lines show individual RBP examples for five clusters identified based on similar meta-exon profiles. Y-axis indicates fraction of introns with peak
Fig. 7
Fig. 7
Insights from eCLIP of spliceosome-associated RBPs. a Heatmap indicates fold-enrichment for individual snRNAs within eCLIP datasets. Shown are all RBPs with greater than 5-fold enrichment for at least one snRNA. b Browser shows read density for eCLIP of AQR (K562), SF3B4 (K562), and SF3A3 (HepG2) for the NARF exon 11 3′ splice site region. Dotted line indicates position of enriched reverse transcription termination at crosslink sites. c (left) Pie chart shows all (n = 2475) introns with > 20 reads in the − 50 to − 15 (branch point) region in AQR K562 eCLIP. Blue indicates putative branch points (the subset with more than 50% of read 5′ ends at one position). (right) Motif information content for 11-mers centered on the putative branch points. Image generated with seqLogo package in R. d Lines indicate mean normalized eCLIP enrichment in IP versus input for SF3B4 and SF3A3 at (red/purple/green) alternative 3′ splice site extensions in RBP knockdown or (black) alternative 3′ splice site events in control HepG2 or K562 cells. The region shown extends 50 nt into exons and 300 nt into introns
Fig. 8
Fig. 8
RBP co-association predicts known and novel RNP complexes. a Heatmap indicates the pairwise fraction of eCLIP peaks overlapping between datasets. Callout examples are shown for known complexes, RBP families, same RBP profiled across cell types, and putative novel complexes. b GSEA analysis comparing the fraction overlap observed profiling the same RBP in both K562 and HepG2, compared against random pairings of RBPs (with one profiled in K562 and the other in HepG2). c As in b, but using the set of RBPs with interactions reported in the BioPlex IP-mass spectrometry database [52]

References

    1. Posner R, Toker IA, Antonova O, Star E, Anava S, Azmon E, Hendricks M, Bracha S, Gingold H, Rechavi O. Neuronal small RNAs control behavior transgenerationally. Cell. 2019;177:1814–1826. doi: 10.1016/j.cell.2019.04.029. - DOI - PMC - PubMed
    1. Morris KV, Mattick JS. The rise of regulatory RNA. Nat Rev Genet. 2014;15:423–437. doi: 10.1038/nrg3722. - DOI - PMC - PubMed
    1. Gerstberger S, Hafner M, Tuschl T. A census of human RNA-binding proteins. Nat Rev Genet. 2014;15:829–845. doi: 10.1038/nrg3813. - DOI - PMC - PubMed
    1. Ule J, Jensen KB, Ruggiu M, Mele A, Ule A, Darnell RB. CLIP identifies Nova-regulated RNA networks in the brain. Science. 2003;302:1212–1215. doi: 10.1126/science.1090095. - DOI - PubMed
    1. Martinez FJ, Pratt GA, Van Nostrand EL, Batra R, Huelga SC, Kapeli K, Freese P, Chun SJ, Ling K, Gelboin-Burkhart C, et al. Protein-RNA networks regulated by normal and ALS-associated mutant HNRNPA2B1 in the nervous system. Neuron. 2016;92:780–795. doi: 10.1016/j.neuron.2016.09.050. - DOI - PMC - PubMed

Publication types