. 2020 Jun 1;10(6):1997-2005.
doi: 10.1534/g3.120.401221.

Genomic Structure, Evolutionary Origins, and Reproductive Function of a Large Amplified Intrinsically Disordered Protein-Coding Gene on the X Chromosome (Laidx) in Mice

Affiliations

Genomic Structure, Evolutionary Origins, and Reproductive Function of a Large Amplified Intrinsically Disordered Protein-Coding Gene on the X Chromosome (Laidx) in Mice

Martin F Arlt et al. G3 (Bethesda). .

Abstract

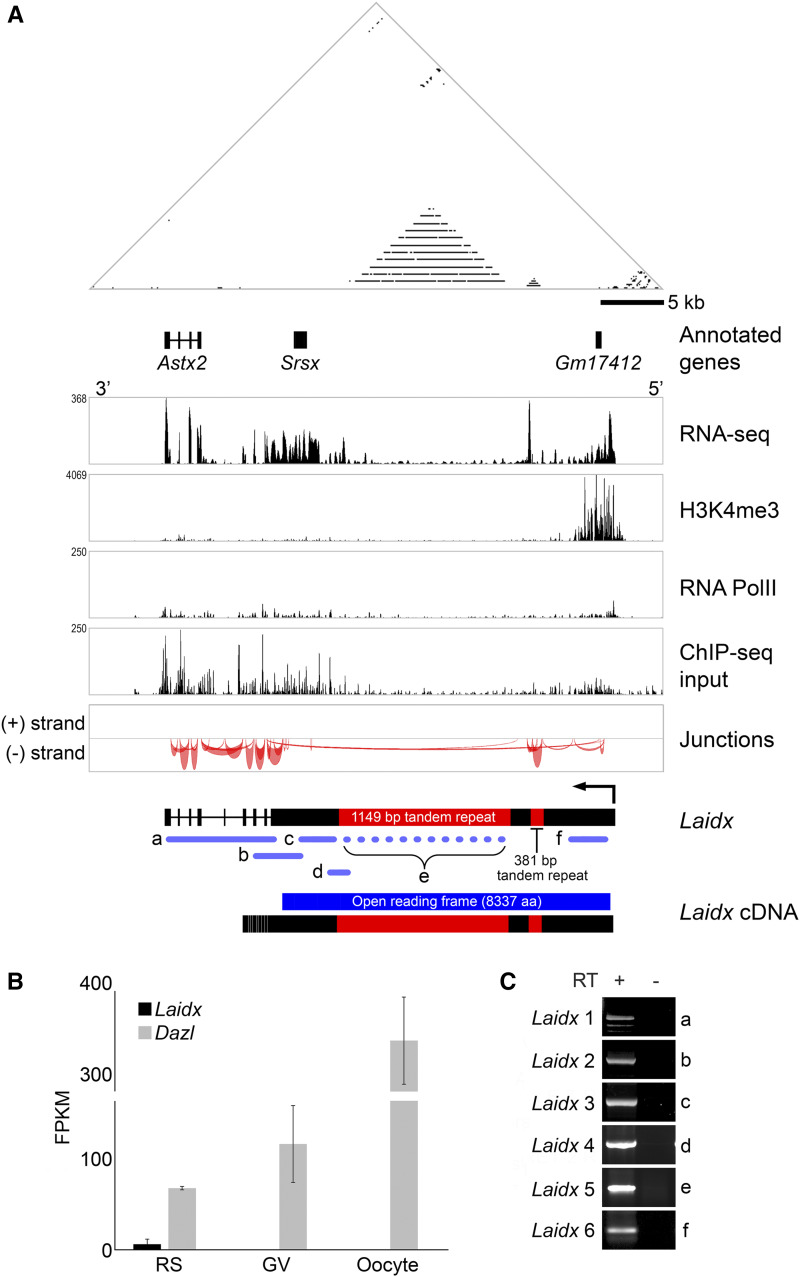
Mouse sex chromosomes are enriched for co-amplified gene families, present in tens to hundreds of copies. Co-amplification of Slx/Slxl1 on the X chromosome and Sly on the Y chromosome are involved in dose-dependent meiotic drive, however the role of other co-amplified genes remains poorly understood. Here we demonstrate that the co-amplified gene family on the X chromosome, Srsx, along with two additional partial gene annotations, is actually part of a larger transcription unit, which we name LaidxLaidx is harbored in a 229 kb amplicon that represents the ancestral state as compared to a 525 kb Y-amplicon containing the rearranged LaidyLaidx contains a 25,011 nucleotide open reading frame, predominantly expressed in round spermatids, predicted to encode an 871 kD protein. Laidx has orthologous copies with the rat and also the 825-MY diverged parasitic Chinese liver fluke, Clonorchis sinensis, the likely result of a horizontal gene transfer of rodent Laidx to an ancestor of the liver fluke. To assess the male reproductive functions of Laidx, we generated mice carrying a multi-megabase deletion of the Laidx-ampliconic region. Laidx-deficient male mice do not show detectable reproductive defects in fertility, fecundity, testis histology, and offspring sex ratio. We speculate that Laidx and Laidy represent a now inactive X vs. Y chromosome conflict that occurred in an ancestor of present day mice.

Keywords: Genetics of Sex; X chromosome; amplicon; horizontal gene transfer; male fertility; mouse; testicular germ cells.


Figures

Figure 1
Figure 1
Amplicons containing Srsx and Srsy are present in multiple copies within ampliconic regions of the mouse X and Y chromosomes. (A) Dot plot comparing the representative Srsx-containing amplicon to the entire ampliconic region (chrX:123,050,000-126,250,000; mm10). Each dot represents 100% sequence identity in a 100 bp window. Blue arrows indicate position and orientation of Srsx-containing amplicons. The representative sequence used for subsequent analyses is indicated by a blue bar. Vertical dotted gray lines mark the boundaries of each amplicon. Dark gray bars mark gaps in the mm10 reference genome sequence. (B) Self-symmetry triangular dot plots of X- and Y-amplicons are shown with each amplicon compared to itself. Each dot represents a perfect match of 50 nucleotides. Horizontal lines indicate tandemly-arrayed amplicons. The chromosomal regions shown are chrX:123,326,277-123,555,768 and chrY:49,567,447-50,092,166 (mm10). (C) Dot plots of DNA sequence identity between the X- and Y-amplicons from (B), on the Y and X axes, respectively. Each dot represents 100% sequence identity in a 25 bp window. Blue highlights indicate regions of sequence identity between the two sequences. The red, yellow, and blue Y-amplicon subunits are shown at top. Testis RNA-seq reads for each region are illustrated along the respective axes. The positions of Sly and Ssty1/2 have been previously mapped (Soh et al. 2014) and are excluded from the Y-amplicon for simplicity.
Figure 2
Figure 2
A large transcription unit, Laidx, encompasses three partially annotated genes, including Srsx. (A) Self-symmetry triangular dot plot of a 45.5 kb region encompassing the large transcription unit. The coordinates of the chromosomal regions shown are chrX:123,443,060-123,488,539 (mm10). Positions of three partially annotated genes (Astx2, Srsx, and Gm17412) are indicated. Below the dotplot and gene annotations are aligned reads from RNA-seq performed on round spermatids, showing transcription extending from upstream of Gm17412 to the end of Astx2. In addition, ChIP-seq on round spermatids revealed modest enrichment of RNA polymerase II along the transcription unit and a small amount of enrichment at the transcription start site, along with broad enrichment of H3K4me3, a modification associated with active promoters. RNA-seq and ChIP-seq alignments were performed on repeat masked sequence (Smit et al. 2015). “Junctions” illustrates predicted splice sites based on RNA-seq. The height and thickness of the arcs are proportional to read depth spanning the junction, up to 50 reads. The predicted genomic organization of the Laidx gene is illustrated below. Purple bars represent select RT-PCR assays used to verify expression and are lettered to correspond with labels in (C). (B) Quantitation of RNA-seq data from round spermatids (RS), germinal vesicles (GV), and oocytes demonstrating transcription in the male but not female germline. Dazl, a gene expressed in both male and female germlines, is used as a control. FPKM, Fragments Per Kilobase per Million reads. (C) RT-PCR on RT (+) and no RT controls (-) performed on RNA isolated from adult testis.
Figure 3
Figure 3
High Laidx sequence identity between mouse and Chinese liver fluke suggests a horizontal gene transfer event. (A) Blastp alignment of the 5280 amino acid Clonorchis protein CSKR_14446s and the predicted 8337 amino acid LAIDX protein. (B) TBLASTN alignment of Laidx with Clonorchis genomic sequence encoding CSKR_14446s. (C) Evolutionary history of Laidx. Species that carry a Laidx ortholog are marked with a “+”. An orange arrow and orange branches mark a proposed horizontal gene transfer event that occurred between a mouse/rat ancestor and the liver fluke. Mya, Million years ago.
Figure 4
Figure 4
Generation of Laidx-/Y and LaidxDup/Y transgenic mice. (A) Schematic representation of the mouse X chromosome. Ampliconic regions are shown in blue, centromere in gray, and pseudoautosomal region (PAR) in green. The region of the X chromosome carrying the Laidx-containing amplicons is expanded to show a representation of the repeat structure (blue arrows). Red arrows denote loxP sites. Mice carrying loxP sites flanking the ampliconic region were mated to Ella-Cre mice to generate Laidx-/Y mice. (B) RT-PCR on RT (+) and no RT controls (-) performed on RNA isolated from adult testis from WT and Laidx-/Y mice. Trim42 is a testis-specific gene used as a positive control. Primer pairs for each assay are indicated (see Supplemental Tables 1 and 2). (C) Sanger sequencing chromatograms from Laidx RT-PCR product in WT (top) and Laidx-/Y (bottom) mice. The WT product contains multiple sequence variants that are specific to both the X and Y chromosome. The Laidx-/Y product contains only variant sequences specific to the Y chromosome. (D) mRNA-seq was performed on testes from WT, Laidx-/Y, and LaidxDup/Y mice.
Figure 5
Figure 5
Deletion or duplication of Laidx has no detectable effect on male fertility, fecundity, sperm count or sperm motility. (A) Male fecundity as a function of litter size. Each data point represents the number of pups from a single litter. The horizontal line indicates the mean, with error bars representing standard deviation. P-value was determined by Student’s t-test. (B) The proportion of male offspring is shown as a percentage along with the number of pups screened in parentheses. P-values were calculated using Fisher’s Exact Test. (C) Sperm counts. Each data point represents the average sperm count from an individual mouse. The horizontal line indicates the mean while error bars represent standard deviation. P-value determined by Student’s t-test. (D) Sperm motility. Each data point is the percentage of motile sperm from an individual mouse. The horizontal line indicates the mean while error bars represent standard deviation. P-value determined by Two Proportion Z Test.

References

    1. Agarwala R., Barrett T., Beck J., Benson D. A., Bollin C. et al. , 2018. Database resources of the National Center for Biotechnology Information. Nucleic Acids Res. 46: D8–D13. 10.1093/nar/gkx1095 - DOI - PMC - PubMed
    1. Ahmed E. A., and de Rooij D. G., 2009. Staging of mouse seminiferous tubule cross-sections. Methods Mol. Biol. 558: 263–277. 10.1007/978-1-60761-103-5_16 - DOI - PubMed
    1. Bennett-Baker P. E., and Mueller J. L., 2017. CRISPR-mediated isolation of specific megabase segments of genomic DNA. Nucleic Acids Res. 45: e165 10.1093/nar/gkx749 - DOI - PMC - PubMed
    1. Chai J. Y., Darwin Murrell K., and Lymbery A. J., 2005. Fish-borne parasitic zoonoses: status and issues. Int. J. Parasitol. 35: 1233–1254. 10.1016/j.ijpara.2005.07.013 - DOI - PubMed
    1. Cocquet J., Ellis P. J., Mahadevaiah S. K., Affara N. A., Vaiman D. et al. , 2012. A genetic basis for a postmeiotic X versus Y chromosome intragenomic conflict in the mouse. PLoS Genet. 8: e1002900 10.1371/journal.pgen.1002900 - DOI - PMC - PubMed

Publication types

Substances

LinkOut - more resources