. 2020 Jun 26;7(3):ENEURO.0414-19.2020.
doi: 10.1523/ENEURO.0414-19.2020. Print 2020 May/Jun.

Neural Coding of Thermal Preferences in the Nematode Caenorhabditis elegans

Affiliations

Neural Coding of Thermal Preferences in the Nematode Caenorhabditis elegans

Hironori J Matsuyama et al. eNeuro. .

Abstract

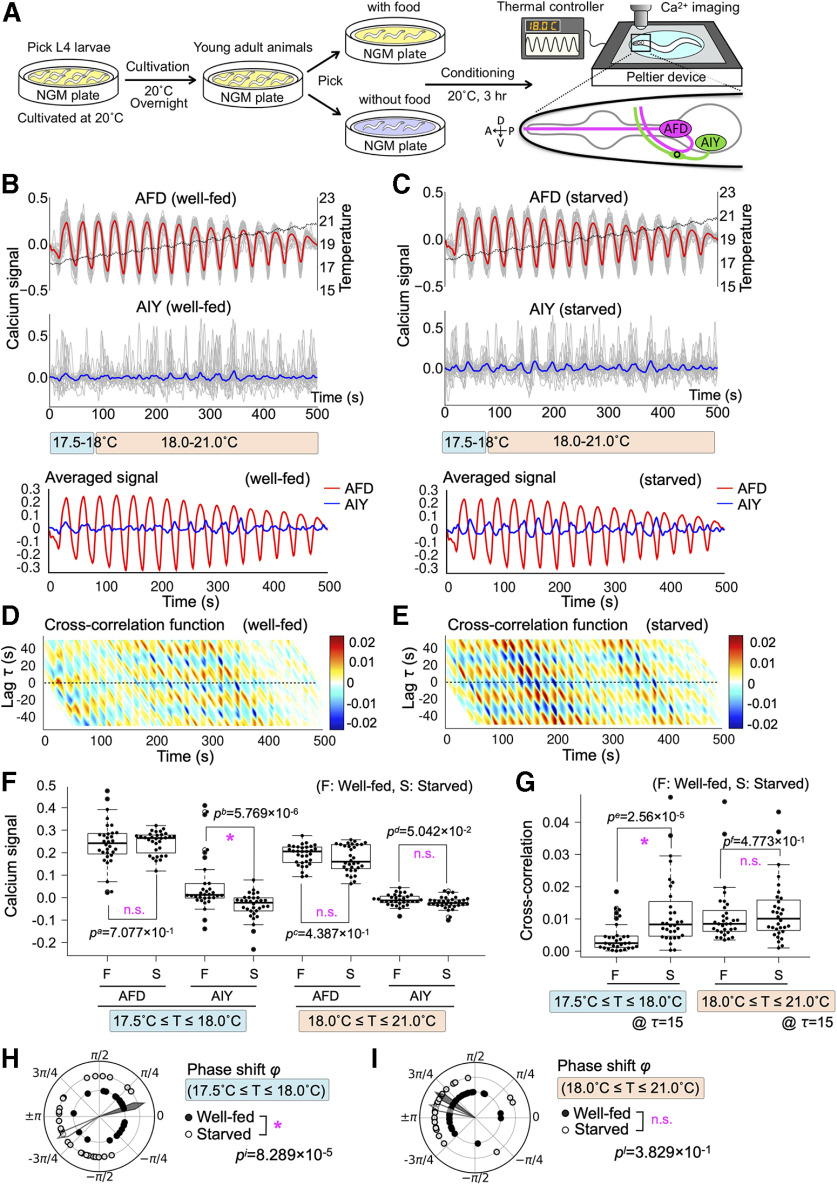
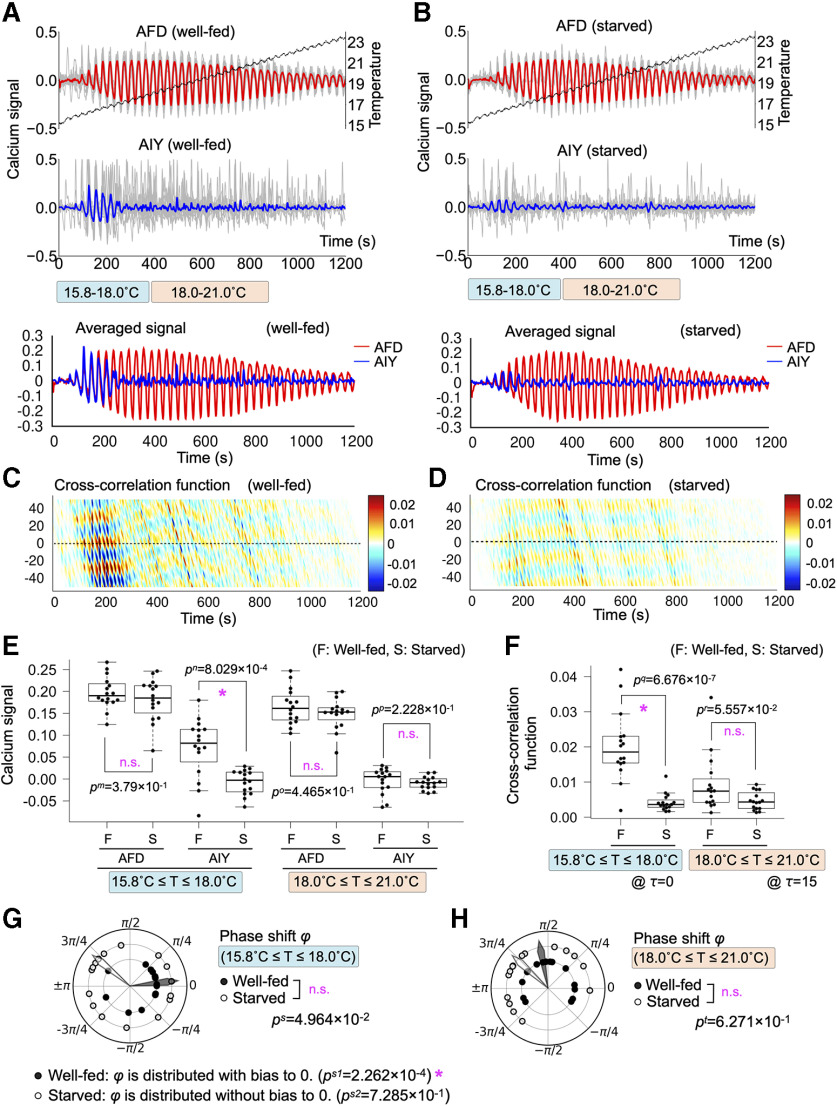
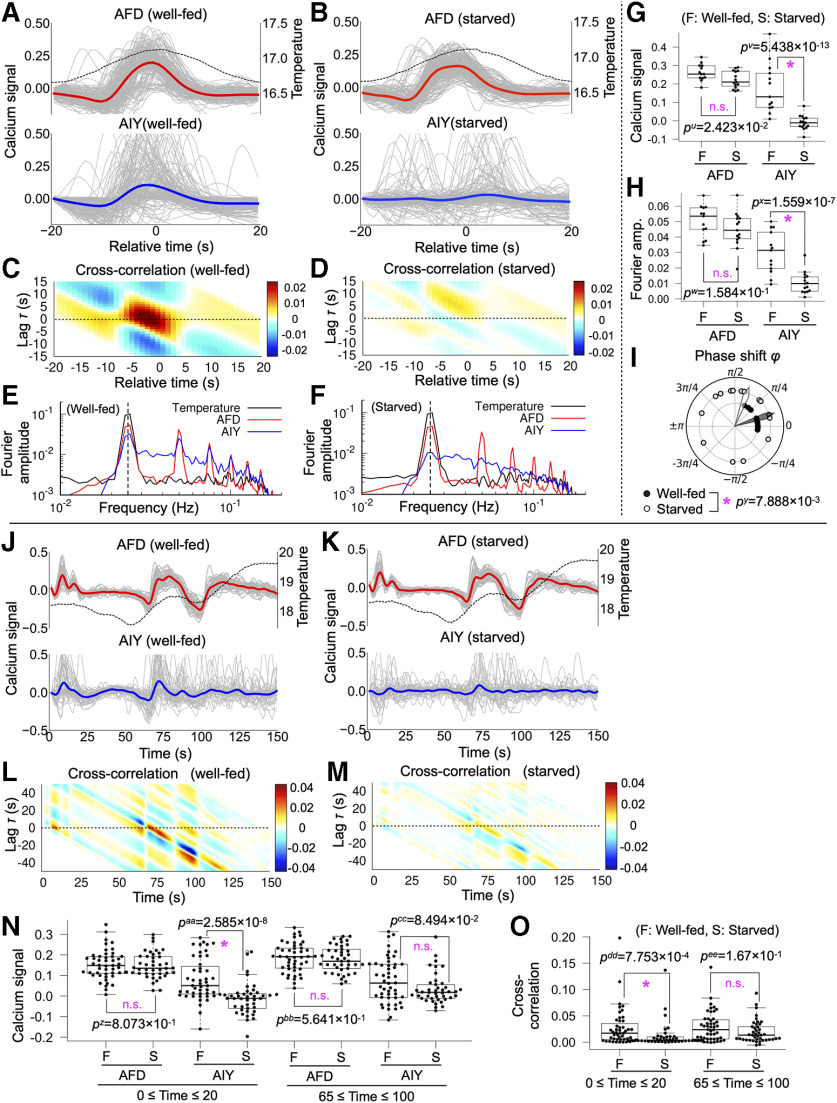
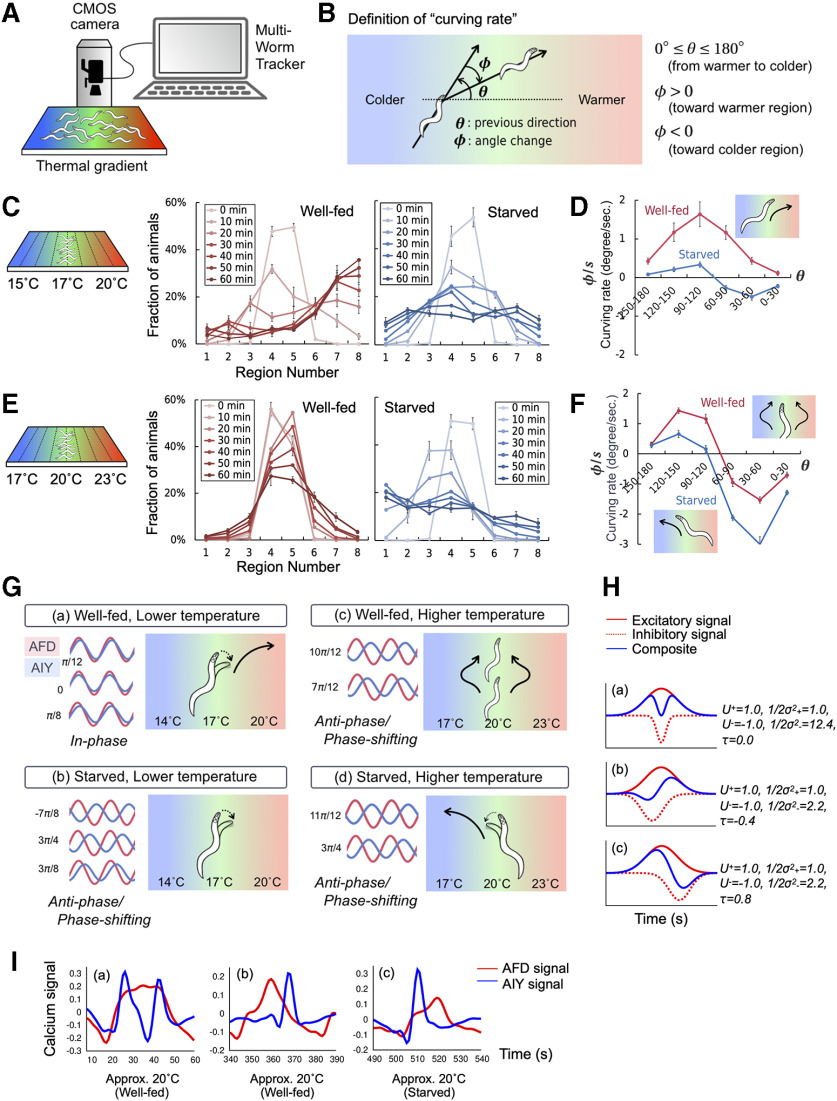
Animals are capable to modify sensory preferences according to past experiences. Surrounded by ever-changing environments, they continue assigning a hedonic value to a sensory stimulus. It remains to be elucidated however how such alteration of sensory preference is encoded in the nervous system. Here we show that past experiences alter temporal interaction between the calcium responses of sensory neurons and their postsynaptic interneurons in the nematode Caenorhabditis elegansC. elegans exhibits thermotaxis, in which its temperature preference is modified by the past feeding experience: well-fed animals are attracted toward their past cultivation temperature on a thermal gradient, whereas starved animals lose that attraction. By monitoring calcium responses simultaneously from both AFD thermosensory neurons and their postsynaptic AIY interneurons in well-fed and starved animals under time-varying thermal stimuli, we found that past feeding experiences alter phase shift between AFD and AIY calcium responses. Furthermore, the difference in neuronal activities between well-fed and starved animals observed here are able to explain the difference in the behavioral output on a thermal gradient between well-fed and starved animals. Although previous studies have shown that C. elegans executes thermotaxis by regulating amplitude or frequency of the AIY response, our results proposed a new mechanism by which thermal preference is encoded by phase shift between AFD and AIY activities. Given these observations, thermal preference is likely to be computed on synapses between AFD and AIY neurons. Such a neural strategy may enable animals to enrich information processing within defined connectivity via dynamic alterations of synaptic communication.

Keywords: C. elegans; behavioral preference; emotion; phase coding; thermotaxis.


Figures

Figure 1.
Figure 1.
AFD-AIY temporal interaction in response to oscillatory thermal ramp from 17.5°C to 21.0°C (Osci1721) was altered by starvation. A, The schematics of simultaneous calcium imaging of AFD and AIY under time-varying thermal stimuli. Well-fed and starved animals were conditioned at 20°C for 3 h with and without food, respectively. Genetically encoded calcium indicators R-CaMP2 and GCaMP3 were expressed in AFD and AIY, respectively. Calcium signals were monitored from AFD cell bodies and AIY axons (shown by a circle on schematic AIY figure). B, AFD-AIY calcium responses of well-fed animals under thermal stimuli Osci1721 (n = 32). Dashed black line indicates mean of the thermal stimuli. The gray lines indicate individual traces of calcium signals of AFD and AIY. The red and blue lines represent the mean of individual AFD and AIY signals, respectively. The blue and red bars indicate the temperature range of lower (17.5–18.0°C) and higher one (18.0–21.0°C). C, AFD-AIY calcium responses of starved animals under thermal stimuli Osci1721 (n = 32). D, Cross-correlation function between AFD and AIY activities for well-fed animals; x-axis and y-axis represent time and time lag, respectively. Color map indicates value of the cross-correlation function. E, Cross-correlation function between AFD and AIY activities for starved animals. F, Differences in AFD and AIY calcium signals between well-fed and starved animals. Four datasets on the left: the results at lower temperature (17.5–18.0°C). The peak values of AFD signals and the values of AIY signals when AFD signals reach their peaks. Four datasets on the right: the results at higher temperature (18.0–21.0°C). Differences in AFD and AIY signals between well-fed and starved animals were tested for statistical significance by using Brunner–Munzel test; p values <0.05/5 = 0.01 (1%) were considered statistically significant, because a dataset was tested five times: (1) difference in calcium signals, (2) difference in cross-correlation, (3) difference in phase shift distribution between well-fed and starved animals, (4) normality of phase shift distribution, and (5) bias of phase shift distribution. Asterisk indicates p <0.01 (statistically significant), and n.s. indicates p 0.01 (not significant). G, Difference in the cross-correlation function between well-fed and starved animals. Brunner–Munzel test was used for statistical analysis; p values <0.05/5 = 0.01 (1%) were considered statistically significant. Asterisk indicates p <0.01 (statistically significant), and n.s. indicates p 0.01 (not significant). H, Difference in phase shift between AFD and AIY at lower temperature (17.5–18.0°C). The black dots indicate phase shift between AFD and AIY responses for well-fed animals, and white dots are for starved animals. The black and white arrowheads represent mean directions of individual phase shift vectors. Mardia–Watson–Wheeler test was used for statistical analysis; p values <0.05/5 = 0.01 (1%) were considered statistically significant. Asterisk indicates p <0.01 (statistically significant), and n.s. indicates p 0.01 (not significant). I, Difference in phase shift between AFD and AIY at higher temperature (18.0–21.0°C). Quantifications and statistical tests were done in the same manner as H.
Figure 2.
Figure 2.
AFD-AIY temporal interaction in response to oscillatory thermal ramp from 15.8°C to 23.0°C (Osci1523) was altered by starvation. A, AFD-AIY calcium responses of well-fed animals under thermal stimuli Osci1523 (n = 16). Dashed black line indicates mean of the thermal stimuli. The gray lines indicate individual traces of calcium signals of AFD and AIY. The red and blue lines represent the mean of individual AFD and AIY signals, respectively. The blue and red bars indicate the temperature range of lower (15.8–18.0°C) and higher one (18.0–21.0°C). B, AFD-AIY calcium responses of starved animals under thermal stimuli Osci1523 (n = 16). C, Cross-correlation function between AFD and AIY activities for well-fed animals. D, Cross-correlation function between AFD and AIY activities for starved animals. E, Differences in AFD and AIY calcium signals between well-fed and starved animals. Four datasets on the left: the results of AFD and AIY signals at lower temperature (15.8–18.0°C). The peak values of AFD signals and the values of AIY signals when AFD signals reach their peaks. Four datasets on the right: the results of AFD and AIY signals at higher temperature (18.0–21.0°C). Differences in AFD and AIY signals between well-fed and starved animals were tested for statistical significance by using Brunner–Munzel test; p values <0.05/5 = 0.01 (1%) were considered statistically significant. Asterisk indicates p <0.01 (statistically significant), and n.s. indicates p 0.01 (not significant). F, Difference in the cross-correlation function between well-fed and starved animals. Brunner–Munzel test was used for statistical analysis; p values <0.05/5 = 0.01 (1%) were considered statistically significant. Asterisk indicates p <0.01 (statistically significant), and n.s. indicates p 0.01 (not significant). G, Difference in phase shift between AFD and AIY responses at lower temperature (15.8–18.0°C). The black dots indicate phase shift between AFD and AIY responses for well-fed animals, and white dots are for starved animals. The black and white arrowheads represent mean directions of individual phase shift vectors for well-fed and starved animals, respectively. Mardia–Watson–Wheeler test was used for statistical analysis; p values <0.05/5 = 0.01 (1%) were considered statistically significant. Asterisk indicates p <0.01 (statistically significant), and n.s. indicates p 0.01 (not significant). H, Difference in phase shift between AFD and AIY at higher temperature (18.0–21.0°C). Quantifications and statistical tests were done in the same manner as G.
Figure 3.
Figure 3.
AFD-AIY temporal interaction in response to thermal oscillation around 17°C (Osci17) and naturally fluctuated thermal stimuli (Fluc1719) was altered by starvation. A, AFD-AIY calcium responses of well-fed animals under thermal stimuli Osci17 (n = 13). Dashed black line indicates mean of the thermal stimuli. The gray lines indicate individual traces of calcium signals of AFD and AIY. The red and blue lines represent the mean of individual AFD and AIY signals, respectively. B, AFD-AIY calcium responses of starved animals under thermal stimuli Osci17 (n = 15). C, Cross-correlation function between AFD and AIY activities for well-fed animals. D, Cross-correlation function between AFD and AIY activities for starved animals. E, Fourier amplitude spectrum of temperature (black), AFD (red), and AIY activities (blue) observed in well-fed animals. Vertical dashed line represents frequency of thermal oscillation (0.025 Hz). F, Fourier amplitude spectrum of temperature (black), AFD (red), and AIY activities (blue) observed in starved animals. G, Differences in AFD and AIY calcium signals between well-fed and starved animals. Two datasets on the left: the results of AFD signals. Two datasets on the right: the results of AIY signals. Differences in AFD and AIY signals between well-fed and starved animals were tested for statistical significance by using Brunner–Munzel test; p values <0.05/3 = 0.0167 (1.67%) were considered statistically significant. Asterisk indicates p <0.0167 (statistically significant), and n.s. indicates p 0.0167 (not significant). H, Differences in Fourier amplitude of AFD and AIY activities between well-fed and starved animals. Brunner–Munzel test was used for statistical analysis; p values <0.05/3 = 0.0167 (1.67%) were considered statistically significant. Asterisk indicates p <0.0167 (statistically significant), and n.s. indicates p 0.0167 (not significant). I, Difference in phase shift between AFD and AIY responses. The black dots indicate phase shift between AFD and AIY responses for well-fed animals, and white dots are for starved animals. The black and white arrowheads represent mean directions of individual phase shift vectors for well-fed and starved animals, respectively. Mardia–Watson–Wheeler test was used for statistical analysis; p values <0.05/3 = 0.0167 (1.67%) were considered statistically significant. Asterisk indicates p <0.0167 (statistically significant), and n.s. indicates p 0.0167 (not significant). J, AFD-AIY calcium responses of well-fed animals under thermal stimuli Fluc1719 (n = 48). Dashed black line indicates mean of the thermal stimuli. The gray lines indicate individual traces of calcium signals of AFD and AIY. The red and blue lines represent the mean of individual AFD and AIY signals, respectively. K, AFD-AIY calcium responses of starved animals under thermal stimuli Fluc1719 (n = 42). L, Cross-correlation function between AFD and AIY activities for well-fed animals. M, Cross-correlation function between AFD and AIY activities for starved animals. N, Differences in AFD and AIY calcium signals between well-fed and starved animals. Four datasets on the left: the results of AFD and AIY signals at 0 ≤ time ≤ 20 (18°C). The peak values of AFD signals and the values of AIY signals when AFD signals reach their peaks. Four datasets on the right: the results of AFD and AIY signals at 65 ≤ time ≤ 100 (18–18.5°C). Differences in AFD and AIY signals between well-fed and starved animals were tested for statistical significance by using Brunner–Munzel test; p values <0.05/2 = 0.025 (2.5%) were considered statistically significant. Asterisk indicates p <0.025 (statistically significant), and n.s. indicates p 0.025 (not significant). O, Difference in the cross-correlation function between well-fed and starved animals. Four datasets on the right, Cross-correlation at 0 ≤ time ≤ 20 (18°C). Four datasets on the right, Cross-correlation at 65 ≤ time ≤ 100 (18°C). Brunner–Munzel test was used for statistical analysis; p values <0.05/2 = 0.025 (2.5%) were considered statistically significant. Asterisk indicates p <0.025 (statistically significant), and n.s. indicates p 0.025 (not significant).
Figure 4.
Figure 4.
Starvation-induced modulation of curving behavior on a thermal gradient and its correlation with AFD-AIY activities. A, The schematic figures of MWT. B, Definition of curving behavior on a thermal gradient. C, Thermotaxis behavior of 20°C-conditioned animals on 17°C-centered thermal gradient. The left panel with red lines indicates the distribution of well-fed animals in each section of the thermotaxis assay plate (n = 9). The right panel with blue lines is for starved animals (n = 5). The values indicate means ± SEM, and as the color of line changes from light to dark, it indicates that time passed since the starts of assays. D, Curving rate of well-fed and starved animals measured from 10 to 20 min after placing the animals on the assay plate. E, Thermotaxis behavior of 20°C-conditioned animals on 20°C-centered thermal gradient (well-fed n = 6, starved n = 6). F, Curving rate of well-fed and starved animals measured from 0 to 10 min after placing the animals on the assay plate. G, Relationship between temporal AFD-AIY interaction and behavioral outputs on a thermal gradient. The schematic diagram of neuronal activity patterns is displayed next to the diagrams showing the relevant animal locomotion on a thermal gradient. The red and blue traces represent AFD and AIY activities, respectively. The numerical values written next to the diagram of AFD-AIY activities represents the mean direction of phase shit. The three activity patterns observed under the thermal stimulus Osci1721, Osci1523, and Osci17 are shown in order from the top (a, b). The two activity patterns observed under the thermal stimulus Osci1721 and Osci1523 are shown in order from the top (c, d). H, Various patterns of interneuron activities can be generated by composing excitatory and inhibitory signals from sensory neurons. The red and blue lines represent excitatory and inhibitory signals written by Gaussian function, respectively. The numerical values indicate the parameters of Gaussian function. I, Neuronal activity patterns similar to the numerically calculated patterns were observed in the experiments.

Similar articles

Cited by

References

    1. Ainsworth M, Lee S, Cunningham MO, Traub RD, Kopell NJ, Whittington MA (2012) Rates and rhythms: a synergistic view of frequency and temporal coding in neuronal networks. Neuron 75:572–583. 10.1016/j.neuron.2012.08.004 - DOI - PubMed
    1. Ashida K, Hotta K, Oka K (2019) The input-output relationship of AIY interneurons in Caenorhabditis elegans in noisy environment. iScience 19:191–203. 10.1016/j.isci.2019.07.028 - DOI - PMC - PubMed
    1. Baca SM, Marin-Burgin A, Wagenaar DA, Kristan WB (2008) Widespread inhibition proportional to excitation controls the gain of a leech behavioral circuit. Neuron 57:276–289. 10.1016/j.neuron.2007.11.028 - DOI - PMC - PubMed
    1. Barbano MF, Wang HL, Morales M, Wise RA (2016) Feeding and reward are differentially induced by activating GABAergic lateral hypothalamic projections to VTA. J Neurosci 36:2975–2985. 10.1523/JNEUROSCI.3799-15.2016 - DOI - PMC - PubMed
    1. Beyeler A, Namburi P, Glober GF, Simonnet C, Calhoon GG, Conyers GF, Luck R, Wildes CP, Tye KM (2016) Divergent routing of positive and negative information from the amygdala during memory retrieval. Neuron 90:348–361. 10.1016/j.neuron.2016.03.004 - DOI - PMC - PubMed

Publication types

Substances

LinkOut - more resources