. 2020 Apr;5(2):e000632.
doi: 10.1136/esmoopen-2019-000632.

Prognostic nomogram based on the metastatic lymph node ratio for gastric neuroendocrine tumour: SEER database analysis

Affiliations

Prognostic nomogram based on the metastatic lymph node ratio for gastric neuroendocrine tumour: SEER database analysis

Jinluan Li et al. ESMO Open. 2020 Apr.

Abstract

Objective: The prediction of survival of gastric neuroendocrine tumours (g-NETs) is controversial. Prognostic effects of the metastatic lymph node ratio (LNR) in patients with g-NET were explored, and a nomogram was plotted to predict the survival rates of patients.

Methods: A longitudinal study conducted on the basis of the Surveillance, Epidemiology, and End Results database. The association between LNR and survival were investigated by using Pearson correlation and Cox regression. Overall survival (OS) and cancer-specific survival (CSS) rates were predicted with the help of nomograms.

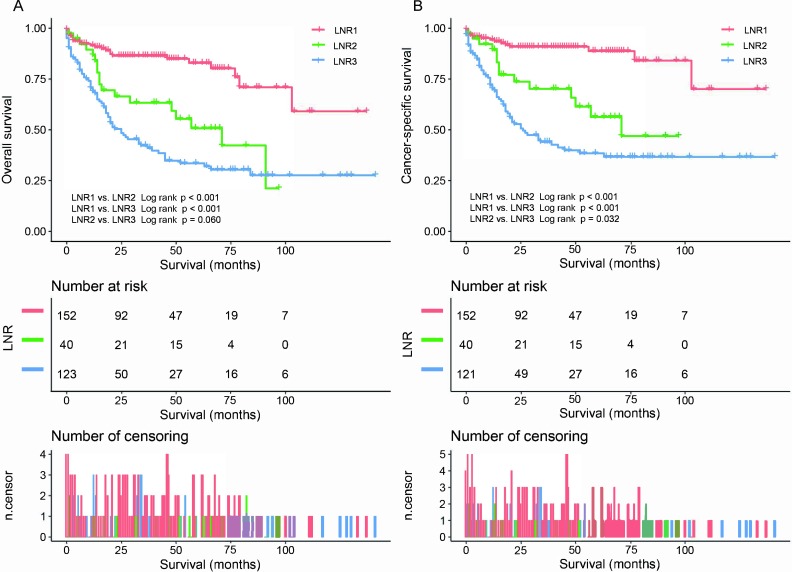
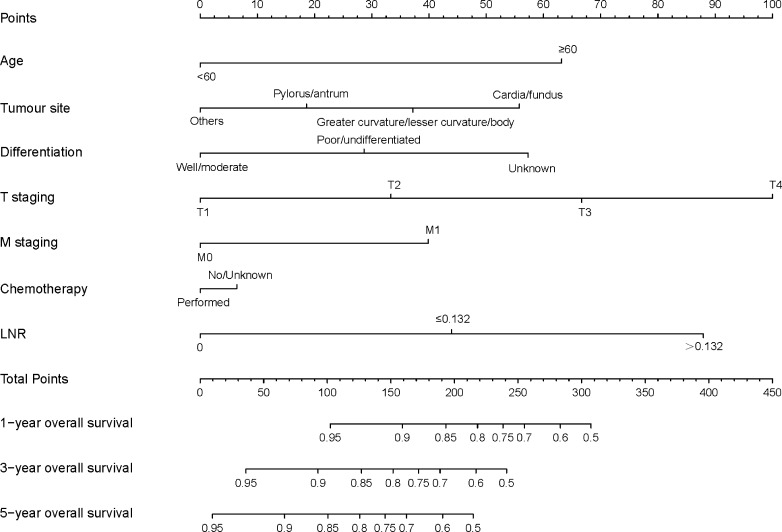
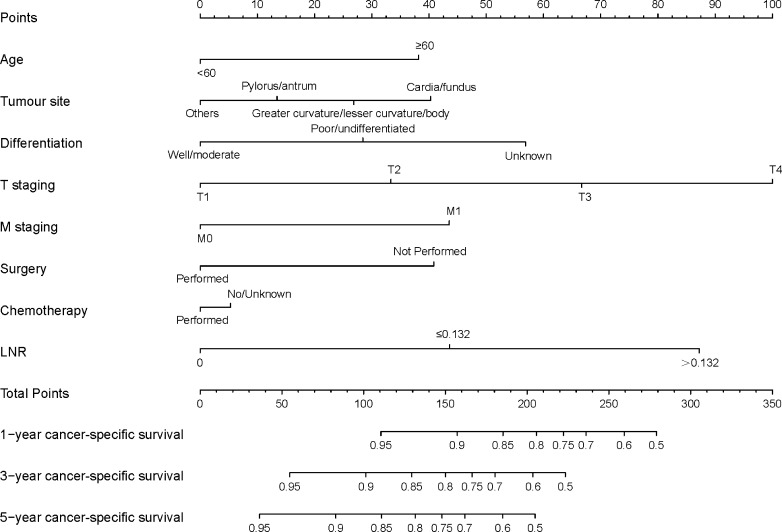
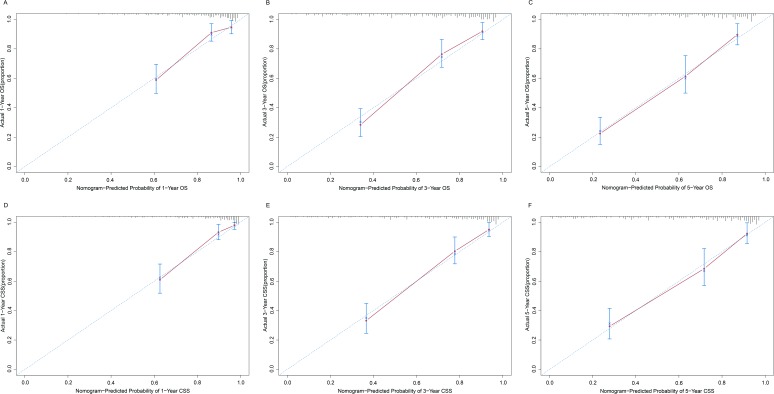
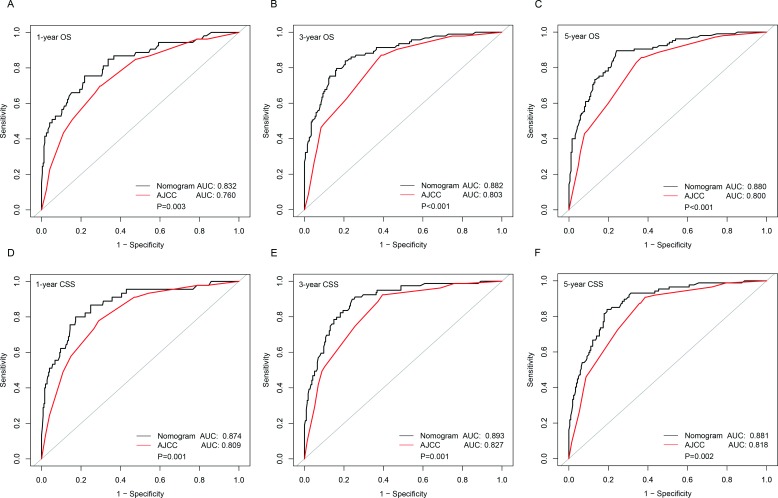
Results: A total of 315 patients with g-NET diagnosed from 2004 to 2015 were included in this study. LNR was discovered to have a negative correlation with OS and CSS (Pearson correlation coefficients: 0.343 (p<0.001) and 0.389 (p<0.001), respectively). The multivariate analyses indicated age, tumour site, differentiation, T staging, M staging, chemotherapy and LNR to be independent prognostic factors for both OS and CSS. Surgery was also a prognostic determinant for CSS (p=0.003). Concordance indices of the nomograms for OS and CSS were higher than those of the TNM classification (0.772 vs 0.730 and 0.807 vs 0.768, respectively). As per the area under the receiver operating characteristic curve, predictive ability of the nomograms for survival of 1, 3 and 5 years was all better than that of TNM classification.

Conclusions: LNR is an independent predictor of g-NETs. The nomograms plotted in this study have a satisfying predictive ability of survival risks and are capable of guiding tailored treatment strategies for patients with g-NET.

Keywords: SEER database; cancer-specific survival; gastric neuroendocrine tumor; lymph node ratio; overall survival.


Conflict of interest statement

Competing interests: None declared.

Figures

Figure 1
Figure 1
(A) Overall survival rates for all patients by LNR groups. (B) Cancer-specific survival rates for all patients by LNR groups. Pictures show the number of subjects at risk in each group at 25-month increments. Pictures show the number of censoring in each group at 25-month increments. LNR, lymph node ratio.
Figure 2
Figure 2
Nomogram predicting the OS rates of 1, 3 and 5 years of patients with gastric neuroendocrine tumour. The nomogram summed the points identified on the scale for each variable. The total points projected on the bottom scales indicate the probabilities of OS rates of 1, 3 and 5 years. LNR, lymph node ratio; OS, overall survival.
Figure 3
Figure 3
Nomogram predicting the CSS rates of 1, 3 and 5 years of patients with g-NETs. The nomogram summed the points identified on the scale for each variable. The total points projected on the bottom scales indicate the probabilities of CSS rates of 1, 3 and 5 years. CSS, cancer-specific survival; LNR, lymph node ratio.
Figure 4
Figure 4
Calibrations of the nomograms for predicting survival rates. The x axis represents the nomogram-predicted survival rates, whereas the y axis represents the actual survival rates. 95% CIs were measured via Kaplan-Meier analysis. All predictions lie within a 10% margin of error (within the dashed lines). (A) Calibration of the nomogram for predicting 1-year OS rate. (B) Calibration of the nomogram for predicting 3-year OS rate. (C) Calibration of the nomogram for predicting 5-year OS rate. (D) Calibration of the nomogram for predicting 1-year CSS rate. (E) Calibration of the nomogram for predicting 3-year CCS rate. (F) Calibration of the nomogram for predicting 5-year CSS rate. CSS, cancer-specific survival; OS, overall survival.
Figure 5
Figure 5
Comparison of the AUCs of the nomogram and eighth AJCC TNM staging system for predicting survival rates. The black lines represent nomogram-predicted survival rates, whereas the red lines represent AJCC TNM stage-predicted survival rates. AUCs of the two models predict OS rates at 1 year (A), 3 years (B) and 5 years (C). AUCs of the two models predict CSS at 1 year (D), 3 years (E) and 5 years (F). AJCC, American Joint Committee on Cancer; AUC, area under the curve; CSS, cancer-specific survival; OS, overall survival.

Similar articles

Cited by

References

    1. Partelli S, Maurizi A, Tamburrino D, et al. . GEP-NETS update: a review on surgery of gastro-entero-pancreatic neuroendocrine tumors. Eur J Endocrinol 2014;171:R153–62. 10.1530/EJE-14-0173 - DOI - PubMed
    1. Modlin IM, Lye KD, Kidd M. A 5-decade analysis of 13,715 carcinoid tumors. Cancer 2003;97:934–59. 10.1002/cncr.11105 - DOI - PubMed
    1. Maggard MA, O'Connell JB, Ko CY. Updated population-based review of carcinoid tumors. Ann Surg 2004;240:117–22. 10.1097/01.sla.0000129342.67174.67 - DOI - PMC - PubMed
    1. Crocetti E, Paci E. Malignant carcinoids in the USA, seer 1992-1999. An epidemiological study with 6830 cases. Eur J Cancer Prev 2003;12:191–4. 10.1097/00008469-200306000-00004 - DOI - PubMed
    1. Modlin IM, Kidd M, Latich I, et al. . Current status of gastrointestinal carcinoids. Gastroenterology 2005;128:1717–51. 10.1053/j.gastro.2005.03.038 - DOI - PubMed

Publication types

Supplementary concepts