. 2020 May 20;88(6):e00100-20.
doi: 10.1128/IAI.00100-20. Print 2020 May 20.

Dual Function of Aar, a Member of the New AraC Negative Regulator Family, in Escherichia coli Gene Expression

Affiliations

Dual Function of Aar, a Member of the New AraC Negative Regulator Family, in Escherichia coli Gene Expression

Abigail S Mickey et al. Infect Immun. .

Abstract

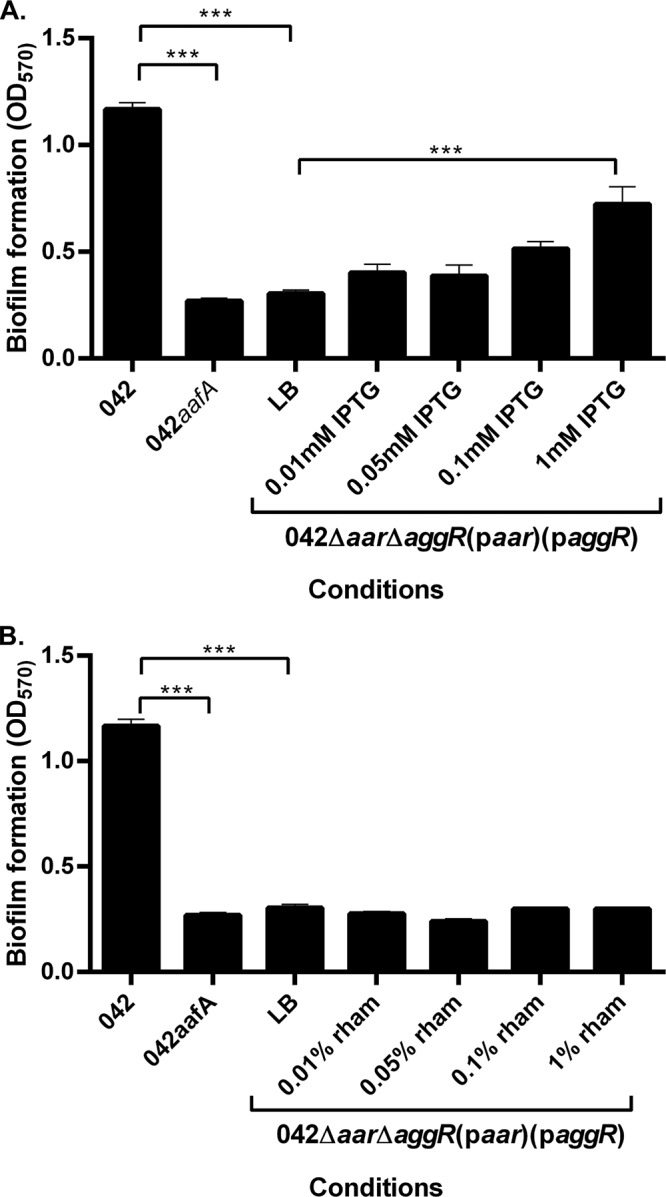
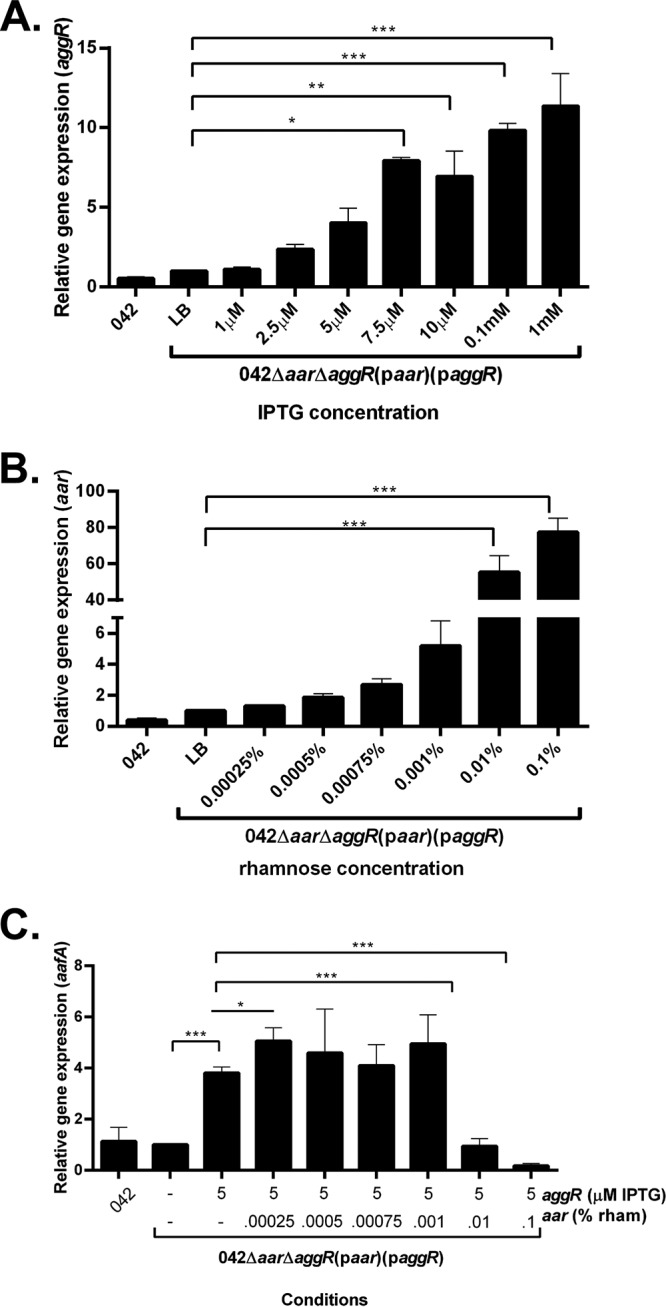
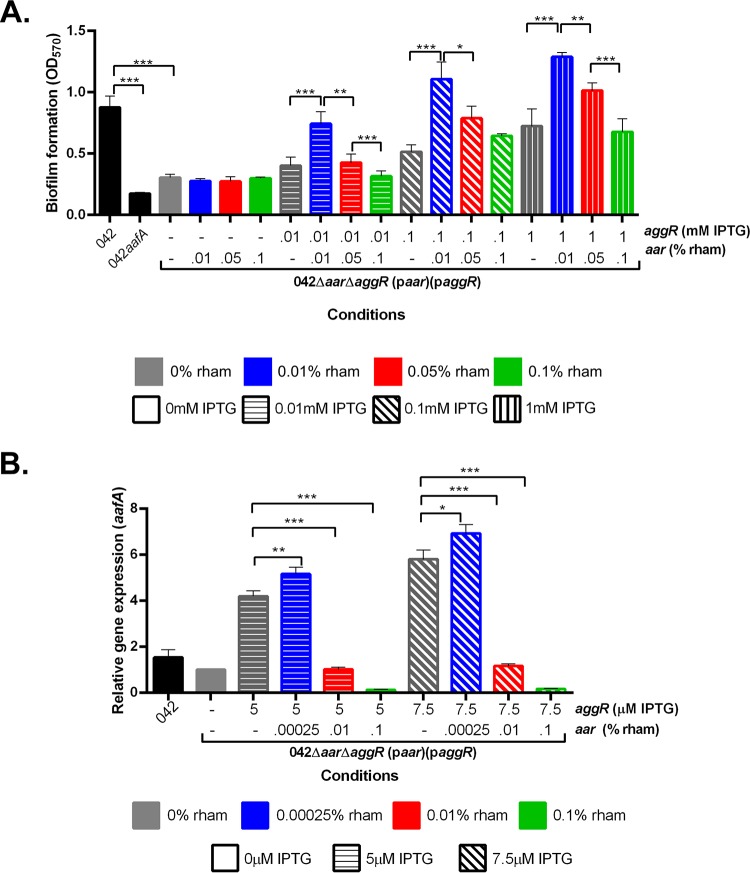
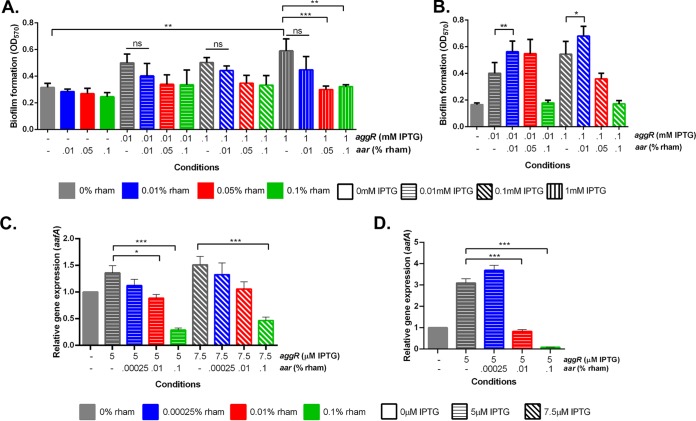
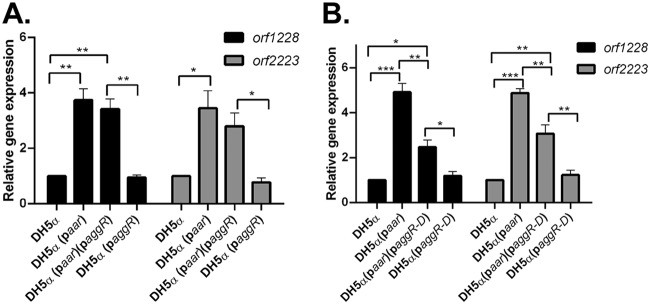
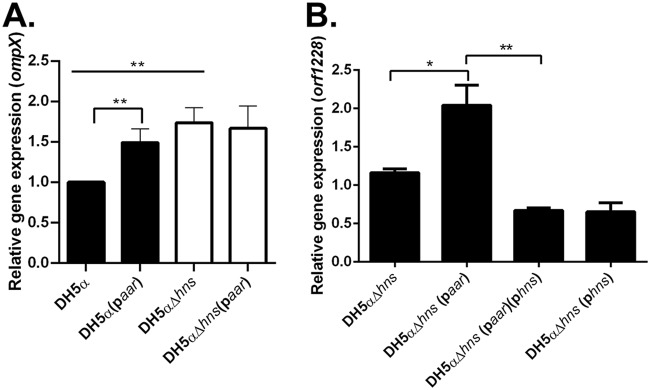
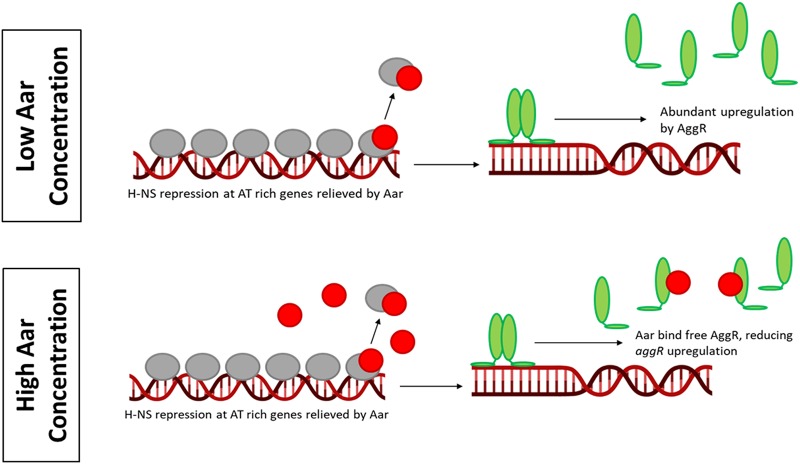
Enteroaggregative Escherichia coli (EAEC) is an E. coli pathotype associated with diarrhea and growth faltering. EAEC virulence gene expression is controlled by the autoactivated AraC family transcriptional regulator, AggR. AggR activates transcription of a large number of virulence genes, including Aar, which in turn acts as a negative regulator of AggR itself. Aar has also been shown to affect expression of E. coli housekeeping genes, including H-NS, a global regulator that acts at multiple promoters and silences AT-rich genes (such as those in the AggR regulon). Although Aar has been shown to bind both AggR and H-NS in vitro, functional significance of these interactions has not been shown in vivo In order to dissect this regulatory network, we removed the complex interdependence of aggR and aar by placing the genes under the control of titratable promoters. We measured phenotypic and genotypic changes on downstream genes in EAEC strain 042 and E. coli K-12 strain DH5α, which lacks the AggR regulon. In EAEC, we found that low expression of aar increases aafA fimbrial gene expression via H-NS; however, when aar is more highly expressed, it acts as a negative regulator via AggR. In DH5α, aar affected expression of E. coli genes in some cases via H-NS and in some cases independent of H-NS. Our data support the model that Aar interacts in concert with AggR, H-NS, and possibly other regulators and that these interactions are likely to be functionally significant in vivo.

Keywords: ANR; Aar; AggR; enteroaggregative E. coli.


Figures

FIG 1
FIG 1
Biofilm formation in the presence and absence of inducer molecules. (A) Biofilm formation was measured using crystal violet staining after 3 h in 042 and 042ΔaafA in DMEM high glucose and in 042Δaar ΔaggR(paar)(paggR) in LB with varying concentrations of IPTG. (B) Biofilm formation was measured using crystal violet staining after 3 h in 042 and 042ΔaafA in DMEM high glucose and in 042Δaar ΔaggR(paar)(paggR) in LB with varying concentrations of rhamnose. Biofilm data are representative of at least three independent experiments. Asterisks indicate significant differences by ANOVA (*, P < 0.05; **, P < 0.005; ***, P < 0.0005).
FIG 2
FIG 2
Gene expression after induction of aggR by IPTG or aar by rhamnose. (A) Three-hour aggR expression measured using qRT-PCR on 042 in DMEM high glucose and 042Δaar ΔaggR(paar)(paggR) in LB with varying concentrations of IPTG. (B) Three-hour aar expression measured using qRT-PCR on 042 in DMEM high glucose and 042Δaar ΔaggR(paar)(paggR) in LB with varying concentrations of rhamnose. (C) Three-hour aafA expression measured using qRT-PCR on 042 in DMEM high glucose and 042Δaar ΔaggR(paar)(paggR) in LB with 0.005 mM IPTG and a range of concentrations of rhamnose. qRT-PCR data are representative of at least three independent experiments. Asterisks indicate significant differences by ANOVA (*, P < 0.05; **, P < 0.005; ***, P < 0.0005). The difference between aggR (5 μM) and aggR (5 μM) with aar (0.00025%) was found to be significant with a two-tailed paired t test.
FIG 3
FIG 3
Biofilm formation and gene expression of aafA in 042Δaar ΔaggR titrated with aar and aggR. (A) Biofilm growth at 3 h postinduction with increasing concentration of IPTG and rhamnose. aggR expression was induced with 0.01 mM IPTG (horizontal fill pattern), 0.1 mM IPTG (diagonal fill pattern), or 1 mM IPTG (vertical fill pattern). aar expression was induced with 0.01% rhamnose (rham) (blue), 0.05% rham (red), or 0.1% rham (green). (B) qRT-PCR analysis of aafA using titratable aar and aggR. aggR expression was induced with either 5 μM IPTG (horizontal fill pattern) or 7.5 μM IPTG (diagonal fill pattern). aar expression was induced with 0.00025% rham (blue), 0.01% rham (red), or 0.1% rham (green). Biofilm data and qRT-PCR data are representative of at least three independent experiments. Asterisks indicate significant differences by ANOVA (*, P < 0.05; **, P < 0.005; ***, P < 0.0005).
FIG 4
FIG 4
Biofilm formation and expression of aafA in 042Δaar ΔaggR Δhns and hns repair titrated with aar and aggR. (A) Biofilm growth in 042Δaar ΔaggR Δhns at 5 h postinduction with increasing concentration of IPTG and rhamnose. (B) Biofilm growth in hns repair at 3 h postinduction with increasing concentration of IPTG and rhamnose. aggR expression was induced with 0.01 mM IPTG (horizontal fill pattern), 0.1 mM IPTG (diagonal fill pattern), or 1 mM IPTG (vertical fill pattern). aar expression was induced with 0.01% rham (blue), 0.05% rham (red), or 0.1% rham (green). (C) qRT-PCR analysis of aafA using titratable aar and aggR in 042Δaar ΔaggR Δhns after 5 h. (D) qRT-PCR analysis of aafA using titratable aar and aggR in the hns repaired 042Δaar ΔaggR after 3 h. aggR expression was induced with either 5 μM IPTG (horizontal fill pattern) or 7.5 μM IPTG (diagonal fill pattern). aar expression was induced with 0.00025% rham (blue), 0.01% rham (red), or 0.1% rham (green). Biofilm data and qRT-PCR data are representative of at least three independent experiments. Asterisks indicate significant differences by ANOVA (*, P < 0.05; **, P < 0.005; ***, P < 0.0005).
FIG 5
FIG 5
The effect of aar and aggR on gene expression in DH5α transformed with paar and/or paggR/paggR-D. (A) DH5α was transformed with paar and paggR expressing full-length aggR or their corresponding empty vectors pBR322 and pACYC177, respectively. Transcriptional levels of E. coli chromosomal genes orf1228 and orf2223 were analyzed by qRT-PCR. (B) DH5α was transformed with paar and paggR-D expressing the AggR dimerization domain or their corresponding empty vectors. Transcriptional levels of E. coli chromosomal genes orf1228 and orf2223 were analyzed by qRT-PCR. RT-PCR data are representative of at least three independent experiments. Asterisks indicate significant differences by ANOVA (*, P < 0.05; **, P < 0.005; ***, P < 0.0005).
FIG 6
FIG 6
The effect of aar on gene expression in the presence or absence of hns in DH5α. (A) DH5α and DH5αΔhns were transformed with paar or its corresponding empty vector pBR322. Transcriptional levels of ompX were analyzed by qRT-PCR. (B) DH5αΔhns was transformed with paar and phns or their corresponding empty vectors pBR322 and pKNT25, respectively. Transcriptional levels of orf1228 were analyzed by qRT-PCR. RT-PCR data are representative of at least three independent experiments. Asterisks indicate significant differences by ANOVA (*, P < 0.05; **, P < 0.005; ***, P < 0.0005).
FIG 7
FIG 7
Proposed mechanism of AggR-Aar-Hns interaction in vivo. When the concentration of Aar (red circles) is low, Aar removes H-NS (gray ovals) repression at AT-rich genes. This allows AggR (green ovals) to abundantly upregulate gene expression. When the concentration of Aar is high, Aar removes H-NS repression but also binds to AggR. AggR is still able to upregulate gene expression but not as abundantly.

Similar articles

Cited by

References

    1. Mohamed JA, Huang DB, Jiang Z-D, DuPont HL, Nataro JP, Belkind-Gerson J, Okhuysen PC. 2007. Association of putative enteroaggregative Escherichia coli virulence genes and biofilm production in isolates from travelers to developing countries. J Clin Microbiol 45:121–126. doi:10.1128/JCM.01128-06. - DOI - PMC - PubMed
    1. Huang DB, Nataro JP, DuPont HL, Kamat PP, Mhatre AD, Okhuysen PC, Chiang T. 2006. Enteroaggregative Escherichia coli is a cause of acute diarrheal illness: a meta-analysis. Clin Infect Dis 43:556–563. doi:10.1086/505869. - DOI - PubMed
    1. Acosta GJ, Vigo NI, Durand D, Riveros M, Arango S, Zambruni M, Ochoa TJ. 2016. Diarrheagenic Escherichia coli: prevalence and pathotype distribution in children from Peruvian rural communities. Am J Trop Med Hyg 95:574–579. doi:10.4269/ajtmh.16-0220. - DOI - PMC - PubMed
    1. Cohen MB, Nataro JP, Bernstein DI, Hawkins J, Roberts N, Staat MA. 2005. Prevalence of diarrheagenic Escherichia coli in acute childhood enteritis: a prospective controlled study. J Pediatr 146:54–61. doi:10.1016/j.jpeds.2004.08.059. - DOI - PubMed
    1. Morin N, Santiago AE, Ernst RK, Guillot SJ, Nataro JP. 2013. Characterization of the AggR regulon in enteroaggregative Escherichia coli. Infect Immun 81:122–132. doi:10.1128/IAI.00676-12. - DOI - PMC - PubMed

Publication types

MeSH terms