

Ridesharing and motor vehicle crashes: a spatial ecological case-crossover study of trip-level data
- PMID: 32253258
- PMCID: PMC7541727
- DOI: 10.1136/injuryprev-2020-043644
Ridesharing and motor vehicle crashes: a spatial ecological case-crossover study of trip-level data
Abstract
Background: Ridesharing services (eg, Uber, Lyft) have facilitated over 11 billion trips worldwide since operations began in 2010, but the impacts of ridesharing on motor vehicle injury crashes are largely unknown.
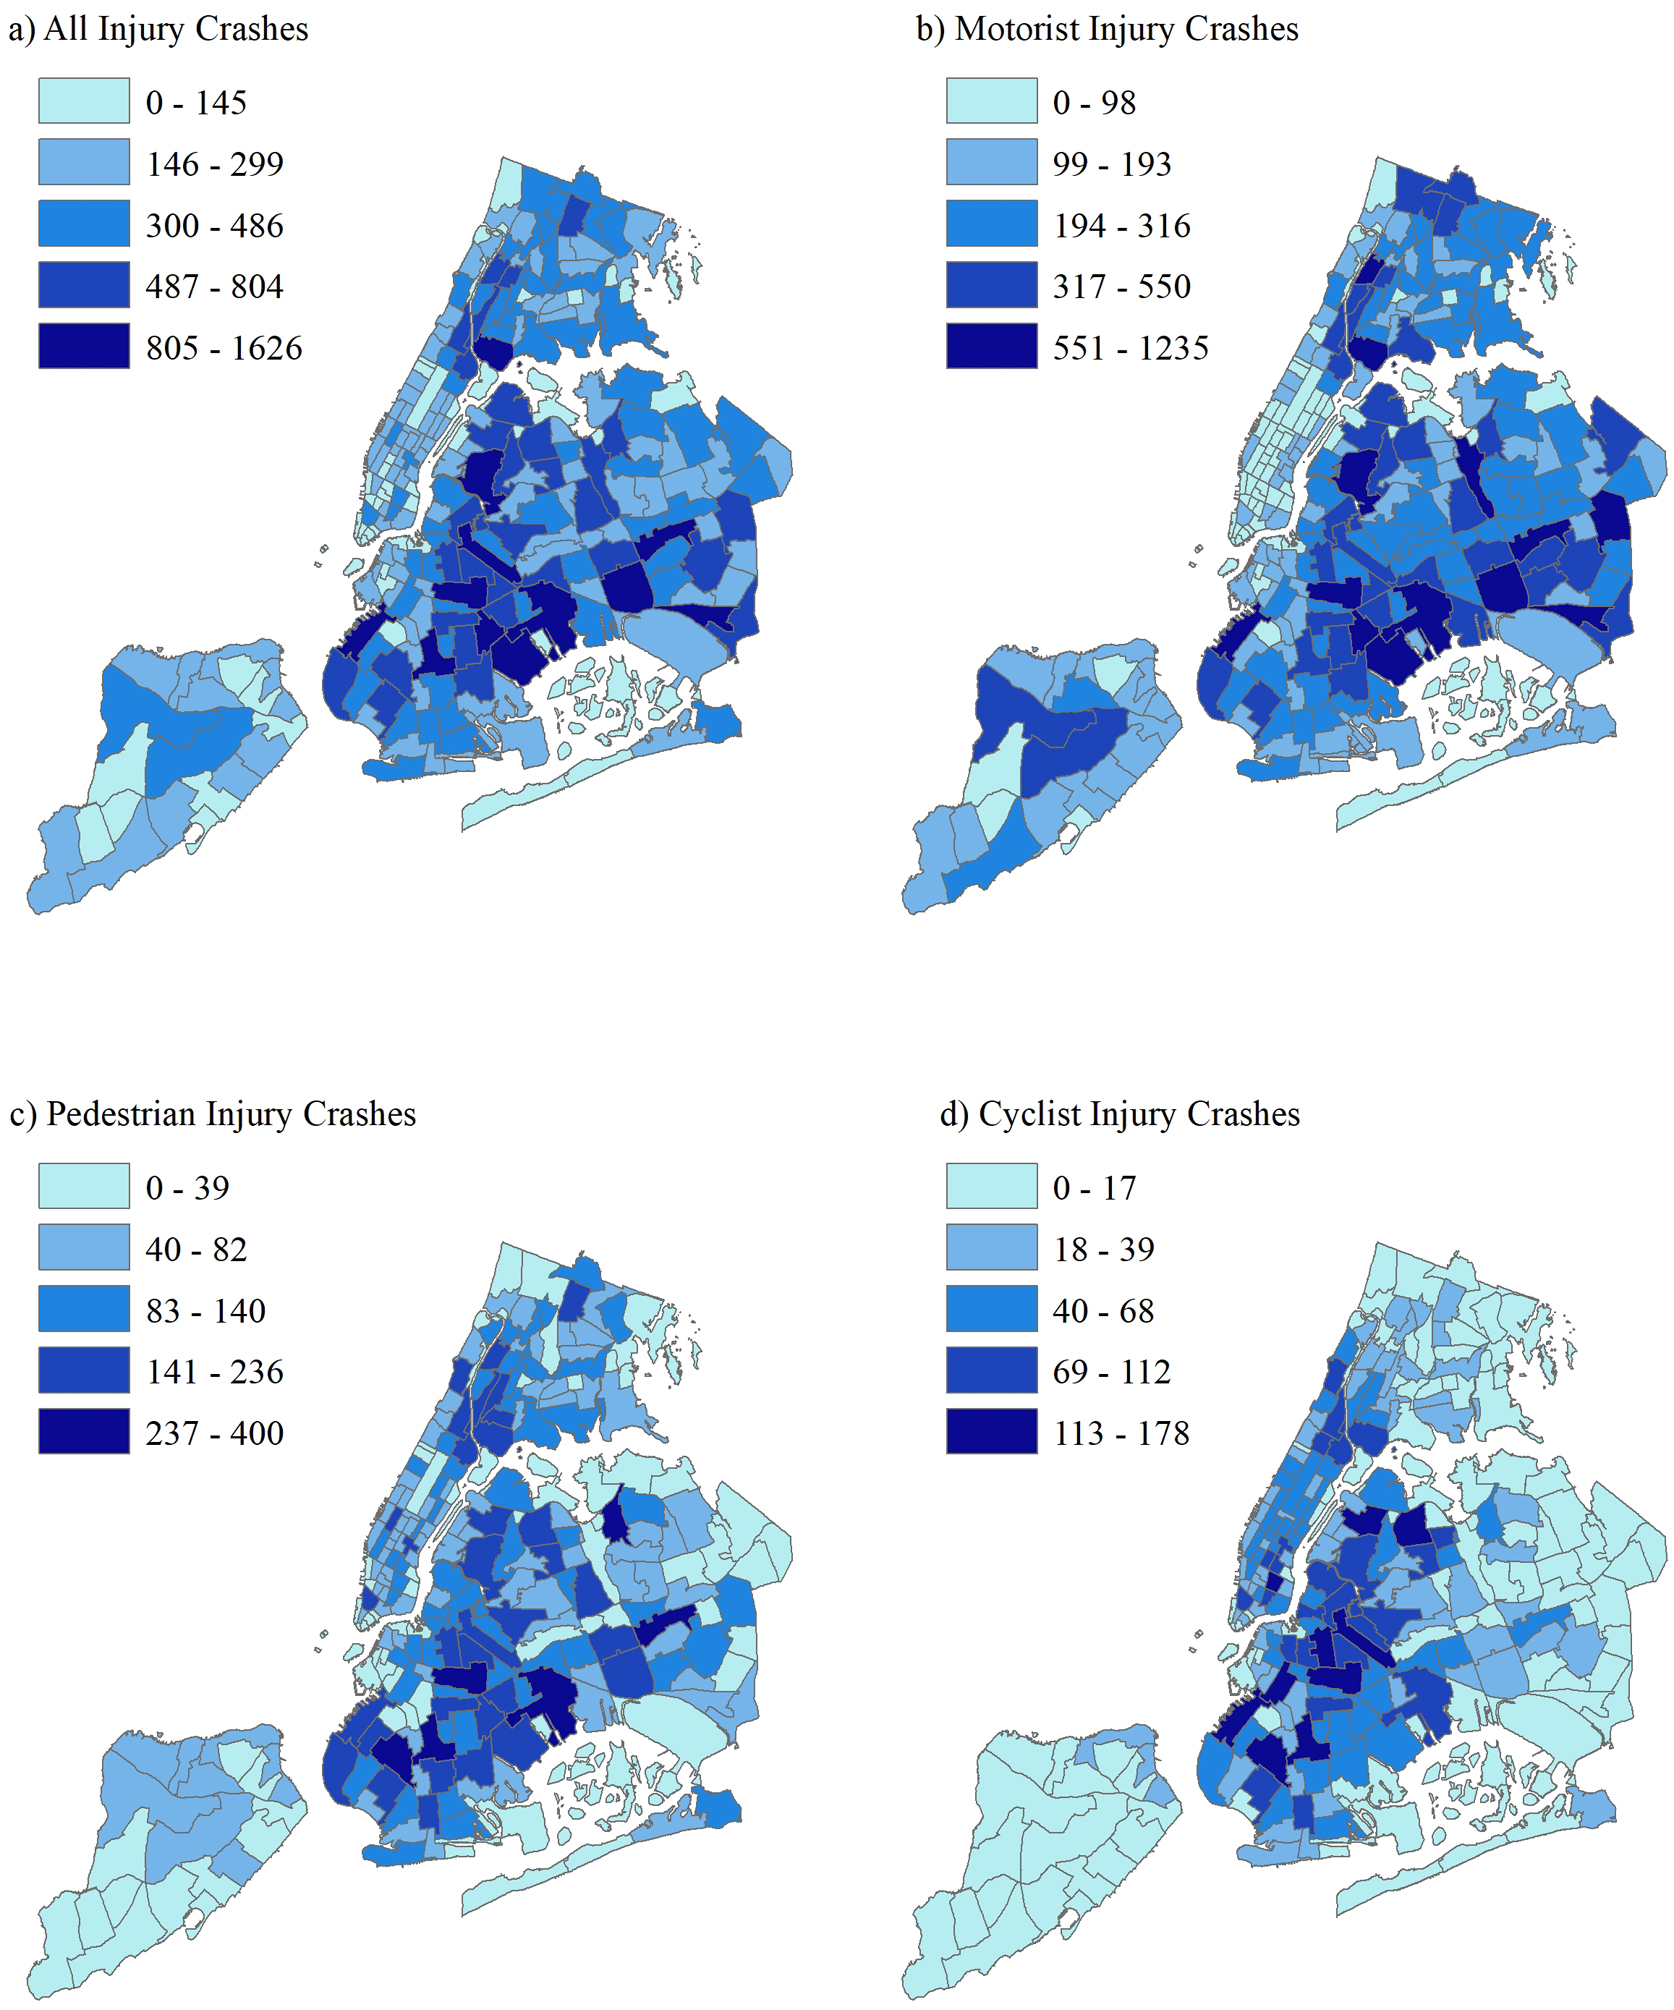
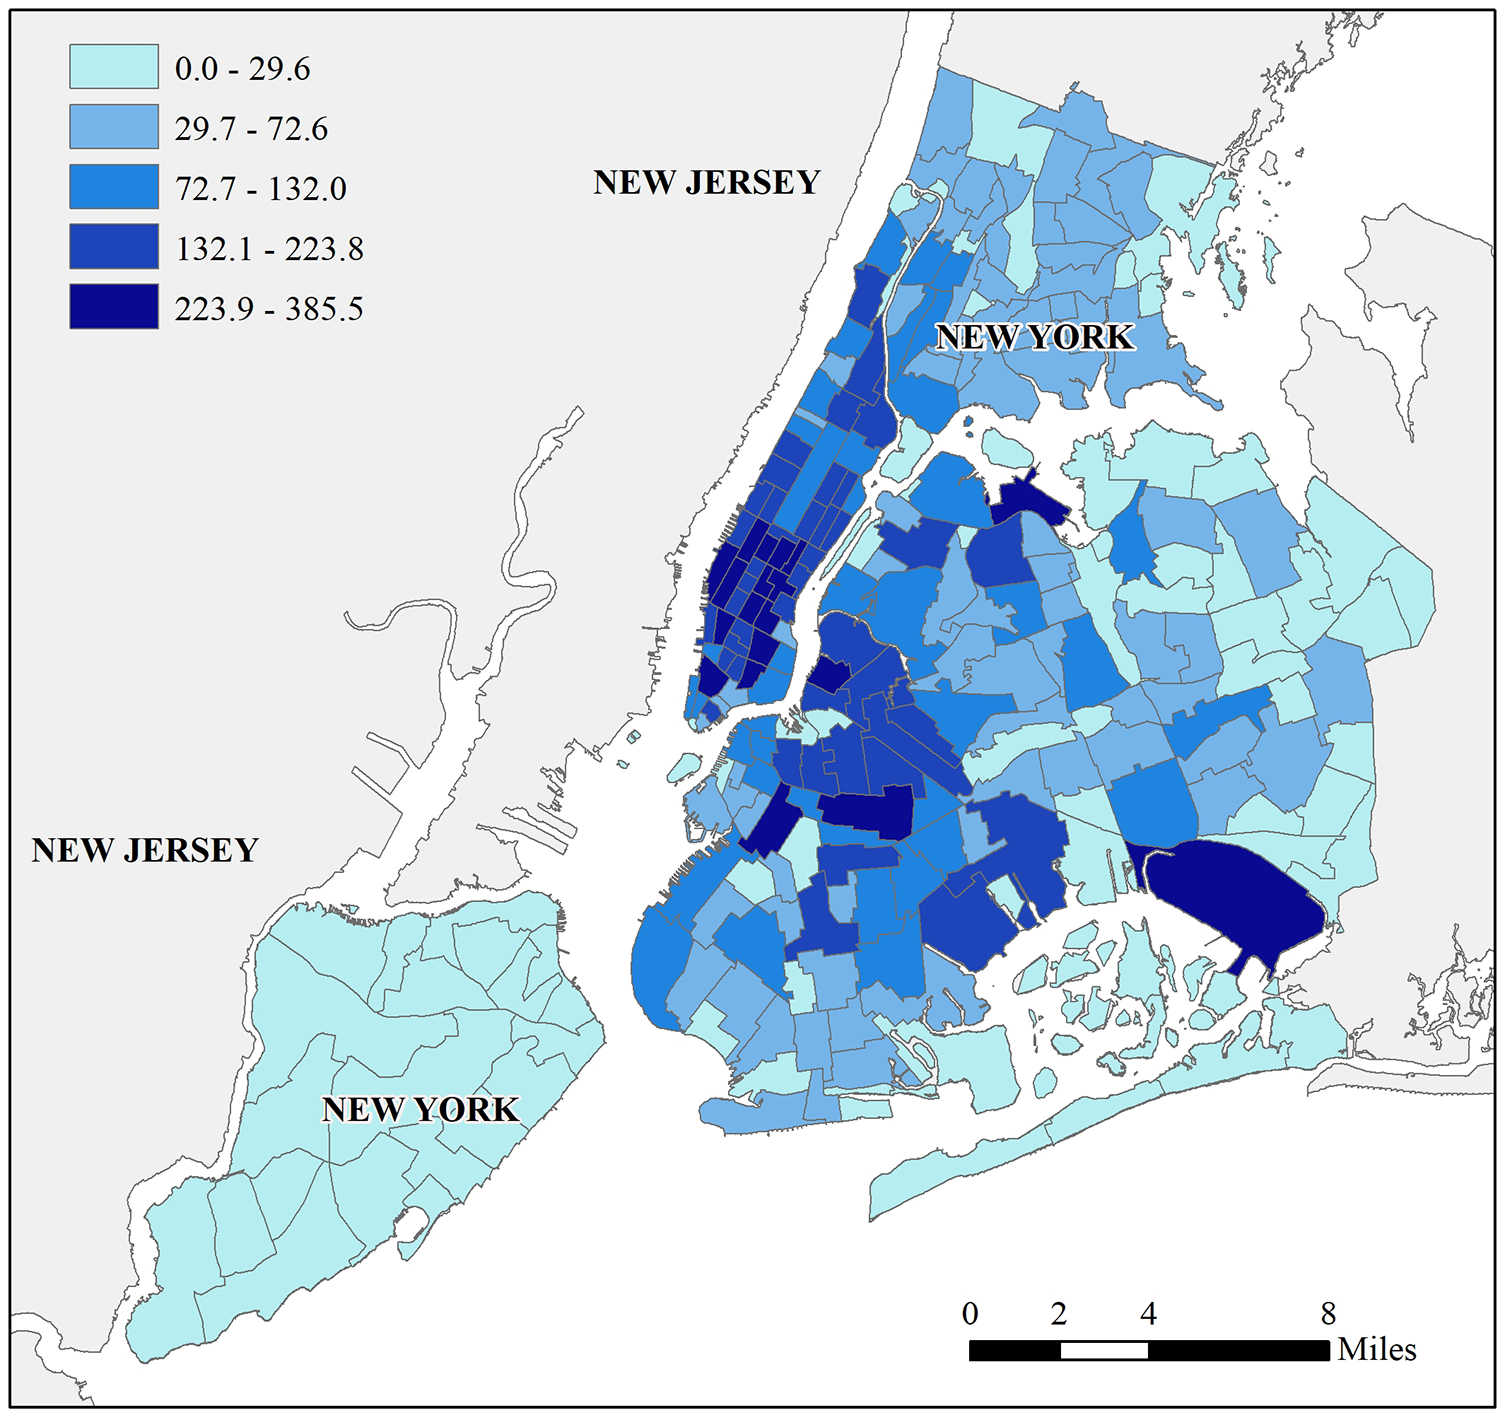
- methods: This spatial ecological case-cross over used highly spatially and temporally resolved trip-level rideshare data and incident-level injury crash data for New York City (NYC) for 2017 and 2018. The space-time units of analysis were NYC taxi zone polygons partitioned into hours. For each taxi zone-hour we calculated counts of rideshare trip origins and rideshare trip destinations. Case units were taxi zone-hours in which any motor vehicle injury crash occurred, and matched control units were the same taxi zone from 1 week before (-168 hours) and 1 week after (+168 hours) the case unit. Conditional logistic regression models estimated the odds of observing a crash (separated into all injury crashes, motorist injury crashes, pedestrian injury crashes, cyclist injury crashes) relative to rideshare trip counts. Models controlled for taxi trips and other theoretically relevant covariates (eg, precipitation, holidays).
Results: Each additional 100 rideshare trips originating within a taxi zone-hour was associated with 4.6% increased odds of observing any injury crash compared with the control taxi zone-hours (OR=1.046; 95% CI 1.032 to 1.060). Associations were detected for motorist injury and pedestrian injury crashes, but not cyclist injury crashes. Findings were substantively similar for analyses conducted using trip destinations as the exposure of interest.
Conclusions: Ridesharing contributes to increased injury burden due to motor vehicle crashes, particularly for motorist and pedestrian injury crashes at trip nodes.
Keywords: distraction; motor vehicle—non-traffic; motor vehicle—occupant; pedestrian.
© Author(s) (or their employer(s)) 2021. No commercial re-use. See rights and permissions. Published by BMJ.
Conflict of interest statement
Competing interests: None declared.
Figures

References
-
- World Health Organization. Global Status Report on Road Safety 2018. Geneva: World Health Organization; 2018. Report No.: License: CC BY-NC-SA 3.0 IGO; Accessed December 23, 2019: https://www.who.int/violence_injury_prevention/road_safety_status/2018/en/
-
- World Health Organization. World report on road traffic injury prevention; 2004. Report ISBN 92 4 156260 9. Accessed December 23, 2019: https://apps.who.int/iris/bitstream/handle/10665/42871/9241562609.pdf?se...
-
- Federal Highway Administration. Building links to improve safety: How safety and transportation planning practitioners work together; 2016. Accessed December 23, 2019: https://safety.fhwa.dot.gov/tsp/fhwasa16116/saf_plan.pdf
-
- Uber. 10 Billion Uber Newsroom; US. July 24, 2018; Accessed December 23, 2019: https://www.uber.com/newsroom/10-billion/
Publication types
MeSH terms
Grants and funding
LinkOut - more resources
Full Text Sources