. 2021 Jan;70(1):180-193.
doi: 10.1136/gutjnl-2020-320646. Epub 2020 Apr 6.

LPIAT1/MBOAT7 depletion increases triglyceride synthesis fueled by high phosphatidylinositol turnover

Affiliations

LPIAT1/MBOAT7 depletion increases triglyceride synthesis fueled by high phosphatidylinositol turnover

Yuki Tanaka et al. Gut. 2021 Jan.

Abstract

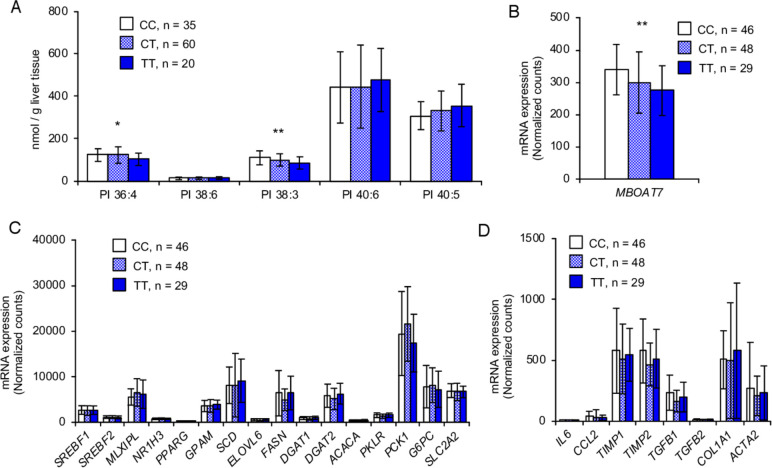
Objective: Non-alcoholic fatty liver disease (NAFLD) is a common prelude to cirrhosis and hepatocellular carcinoma. The genetic rs641738 C>T variant in the lysophosphatidylinositol acyltransferase 1 (LPIAT1)/membrane bound O-acyltransferase domain-containing 7, which incorporates arachidonic acid into phosphatidylinositol (PI), is associated with the entire spectrum of NAFLD. In this study, we investigated the mechanism underlying this association in mice and cultured human hepatocytes.

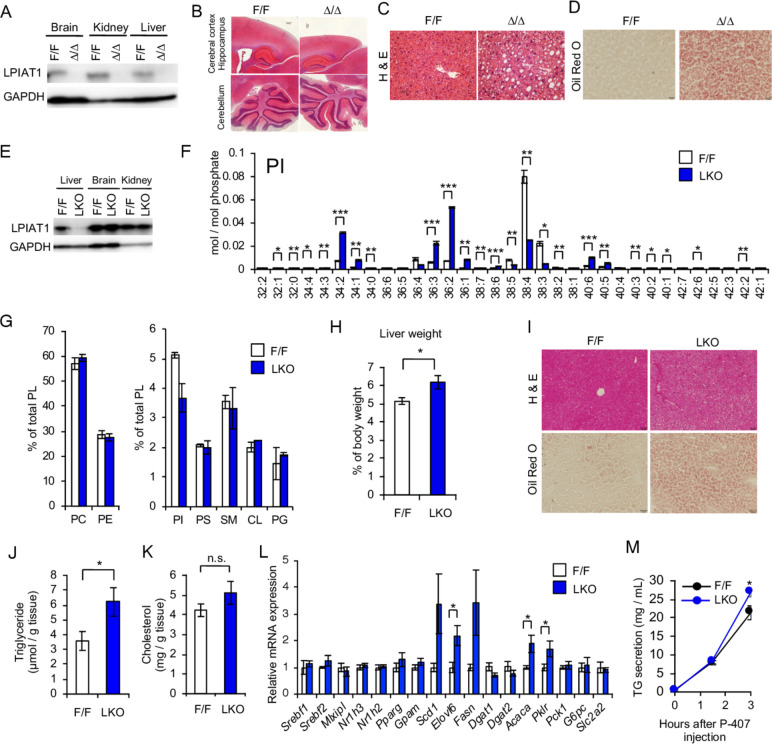
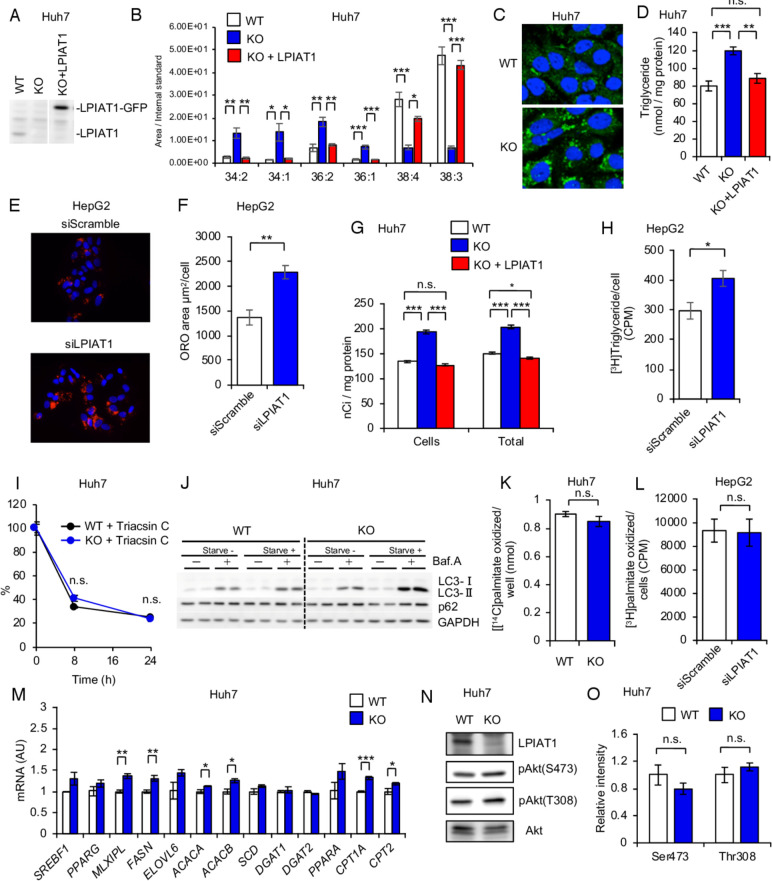
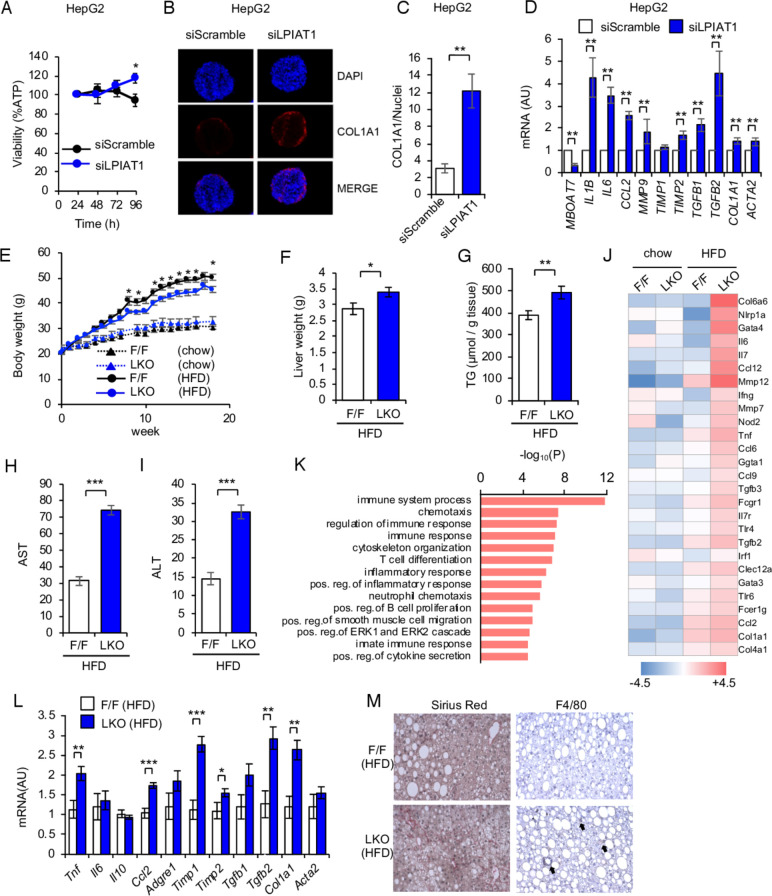
Design: We generated the hepatocyte-specific Lpiat1 knockout mice to investigate the function of Lpiat1 in vivo. We also depleted LPIAT1 in cultured human hepatic cells using CRISPR-Cas9 systems or siRNA. The effect of LPIAT1-depletion on liver fibrosis was examined in mice fed high fat diet and in liver spheroids. Lipid species were measured using liquid chromatography-electrospray ionisation mass spectrometry. Lipid metabolism was analysed using radiolabeled glycerol or fatty acids.

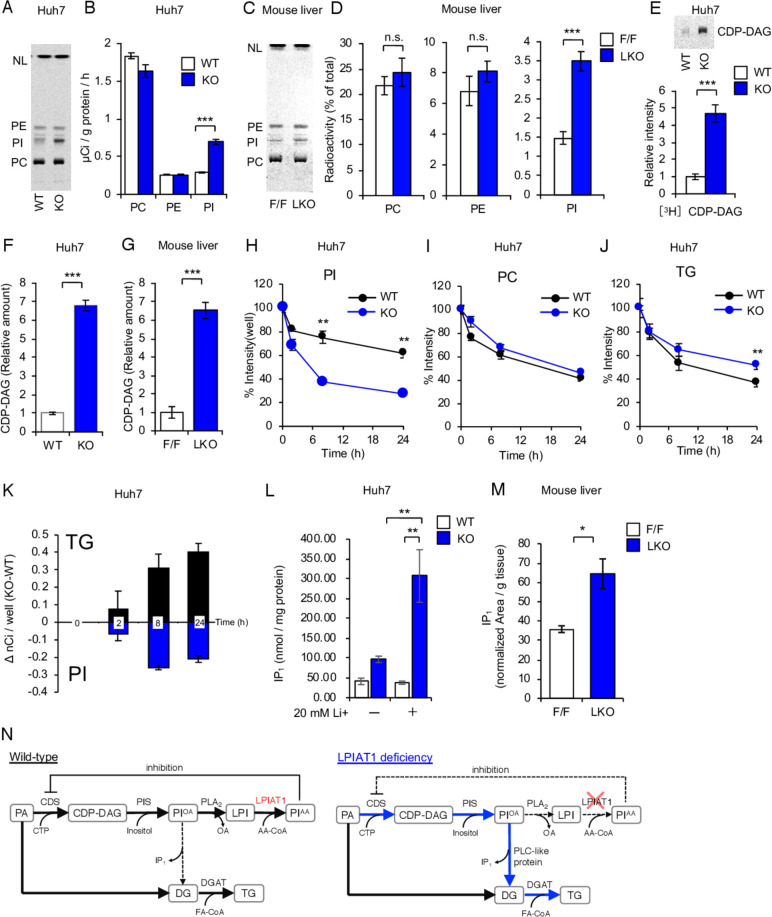
Results: The hepatocyte-specific Lpiat1 knockout mice developed hepatic steatosis spontaneously, and hepatic fibrosis on high fat diet feeding. Depletion of LPIAT1 in cultured hepatic cells and in spheroids caused triglyceride accumulation and collagen deposition. The increase in hepatocyte fat content was due to a higher triglyceride synthesis fueled by a non-canonical pathway. Indeed, reduction in the PI acyl chain remodelling caused a high PI turnover, by stimulating at the same time PI synthesis and breakdown. The degradation of PI was mediated by a phospholipase C, which produces diacylglycerol, a precursor of triglyceride.

Conclusion: We found a novel pathway fueling triglyceride synthesis in hepatocytes, by a direct metabolic flow of PI into triglycerides. Our findings provide an insight into the pathogenesis and therapeutics of NAFLD.

Keywords: fatty liver; hepatic fibrosis; lipid metabolism; lipids.


Conflict of interest statement

Competing interests: None declared.

Figures

Figure 1
Figure 1
Hepatocyte-Specific LPIAT1 depletion causes steatosis. (A–D) Six-week-old male Lpiat1f/f mice (F/F) and Ubc-CreERT2;Lpiat1f/f mice (∆/∆) were treated with tamoxifen for 3 weeks. (A) Western blot of LPIAT1 in brain, kidney and liver. GAPDH serves as a control. Similar results were obtained in one additional independent experiment. (B–D) Representative images of brain (B) or liver (C, D) sections from tamoxifen-treated F/F and ∆/∆ mice stained with H&E (B, C) or Oil-red O (D). Images are representative of three independent experiments. (E) Western blot of LPIAT1 in liver, brain and kidney from 12-week-old male F/F and hepatocyte-specific Lpiat1 knockout (LKO) mice. GAPDH serves as a control. Similar results were obtained in one additional independent experiment. (F) LC-MS/MS analysis of phosphatidylinositol (PI) species in the liver of F/F and LKO mice (n=3). (G) The content of individual phospholipid of the livers from F/F and LKO mice. (H) Liver weights of F/F and LKO mice normalised to the total body weight (n=4). (I) Representative images of the liver sections from F/F and LKO stained with H&E (upper) and oil red O (below). Images are representative of three independent experiments. (J, K) Levels of hepatic triglyceride (n=6) (J) and cholesterol (n=4) (K) in F/F and LKO mice. (L) Expression of genes involved in lipogenesis, β-oxidation and gluconeogenesis in the liver of F/F and LKO mice (n=4–6). (M) Measurement of triglyceride (TG) secretion rate. Lipoprotein lipase inhibitor (P-407, 1 g / kg body weight) was intraperitoneally injected and serum TG levels were measured at each time point (n=5). Values are shown as mean±SEM data were analysed by unpaired two-tailed Student’s t-test (F, H, J, K, L, M): *p<0.05, **p<0.01, ***p<0.001. CL, cardiolipin; GAPDH, glyceraldehyde 3-phosphate dehydrogenase; H&E, hematoxylin and eosin; LC-MS/MS, liquid chromatography-mass spectrometry; LKO, hepatocyte-specific Lpiat1 knockout; LPIAT1, lysophosphatidylinositol acyltransferase 1; n.s., not significant; PC, phosphatidylcholine; PE, phosphatidylethanolamine; PG, phosphatidylglycerol; PL, phospholipid; PS, phosphatidylserine; SM, sphingomyelin.
Figure 2
Figure 2
LPIAT1 depletion causes cellular TG accumulation in cultured hepatocytes (A) Western blot of LPIAT1 in native Huh-7 cells (WT), LPIAT1 knockout Huh-7 cells (KO) and KO Huh-7 cells reconstituted with GFP-tagged LPIAT1 (KO+LPIAT1). GAPDH serves as a control. Similar results were obtained in one additional independent experiment. (B) LC-MS/MS analysis of PI species in WT, KO and KO+LPIAT1 Huh-7 cells (n=3). (C) Representative images of WT and KO Huh-7 cells stained with BODIPY. Similar results were obtained in one additional independent experiment. (D) Cellular TG levels of WT, KO and KO+LPIAT1 Huh-7 cells (n=4–5). (E, F) HepG2 cells were treated with scramble siRNA (siSramble) or LPIAT1 siRNA (siLPIAT1) and subjected to oil red O staining. Representative oil red O fluorescent staining images (E). Neutral lipid content quantified by ImageJ and normalised to number of nuclei (F; n=4). (G) Incorporation of [14C]oleic acid into TG. WT, KO and KO +LPIAT1 Huh-7 cells were incubated with [14C]oleic acid for 24 hours and both cellular and medium lipids were extracted and separated by TLC. Radioactivity in TG fractions was measured (n=4). (H) De novo synthesis of TG in HepG2 cells using [3H]glycerol (n=5). (I) Chase analysis of [14C]glycerol-labelled TG. Cells were preincubated with [14C]glycerol for 12 hours and then shifted to radioactivity free medium with triacsin C (20 µM) and radioactivity of TG fractions at each time point was measured. Data were shown by the relative ratio of signal intensity, with the value at 0 hour set as 100% (n=3). (J) Western blot of LC3 and p62 of WT and KO Huh-7 cells treated with or without EBSS and bafilomycin A1 (150 nM). GAPDH serves as a control. Similar results were obtained in one additional independent experiment. (K) Measurement of β-oxidation rate of WT and KO Huh-7 cells. After incubation with [14C]palmitic acid, radioactivity of acid-soluble fractions were measured by scintillation counting (n=4). (L) β-oxidation rate of HepG2 cells treated with siScramble or siLPIAT1. After incubation with [3H]palmitic acid, radioactivity of acid-soluble fractions were measured by scintillation counting (n=4). (M) Expression of genes involved in TG metabolism (n=3). (N, O) Western blot analysis of Akt phosphorylation in WT and KO Huh-7 cells (N). The ratios of p-Akt to Akt were mersured, with the value of WT being as 1 (O) (n=3). Values are shown as mean±SEM data were analysed by one-way ANOVA with Tukey’s post hoc test (B, D, G) or unpaired two-tailed Student’s t-test (F, H, I, K, L, M, O): *p<0.05, **p<0.01, ***p<0.001. ANOVA, analysis of variance; GAPDH, glyceraldehyde 3-phosphate dehydrogenase; HepG2, hepatoma cell line; Huh-7, hepatoma cell line; KO, knockout; LC-MS/MS, liquid chromatography-mass spectrometry; LPIAT1, lysophosphatidylinositol acyltransferase 1; n.s., not significant; PI, phosphatidylinositol; TG, triglyceride; TLC, thin layer chromatography; WT, wild type.
Figure 3
Figure 3
PI-derived diacylglycerol flow into TG synthesis. (A, B) Phospholipid synthesis speed measured by incorporation of [14C]glycerol into each phospholipid species for 2 hours. (A) Representative image of TLC separation of total lipids from WT or KO cells. (B) Radioactivity of each phospholipid fraction (n=4). (C, D) Phospholipid synthesis speed measured by incorporation of intraperitoneally injected [14C]glycerol (0.133 mCi/kg body weight) into liver phospholipid species of 18–20 weeks-old male F/F or LKO mice. (C) Representative image of TLC separation of total lipids from F/F or LKO mice liver. (D) Radioactivity of each phospholipid fraction (n=5). (E) CDS activity measured by the incorporation of [3H]CTP into CDP-DAG for 2 hours. Total lipids from WT and KO Huh-7 cells were separated by TLC and the radioactivity of CDP-DAG fraction were measured (n=4). (F) Amounts of CDP-DAG in WT and KO Huh-7 cells (n=3). (G) Amounts of CDP-DAG in F/F and LKO mice liver (n=3) (H–J) lipid degradation measured by the reduction of [14C]glycerol radioactivity from each lipid fraction of cells pre-incubated with [14C]glycerol for 12 hours and then shifted to [14C]glycerol-free medium at indicated time point. Radioactivity of PI (H), PC (I) and TG (J) fractions were measured. data were shown by the relative ratio of signal intensity, with the value at 0 hour set as 100% (n=3). (K) Changes in the radioactivity of PI and TG during Chase analysis. Reduction of radioactivity from 0 hour was shown at each time point (n=3). (L) Amount of cellular inositol monophosphate in WT and KO Huh-7 cells treated with or without 20 mM Li+ for 2 hours (n=3). (M) Amounts of inositol monophosphate in F/F and LKO mice liver intraperitoneally injected with 250 mM Li+for 3 hours (F/F, n=3; LKO, n=5) (N) A schematic diagram of the mechanism for the increase in TGs synthesis after depletion of LPIAT1. Values are shown as mean±SEM data were analysed by one-way ANOVA with Tukey’s post hoc test (L) or unpaired two-tailed Student’s t-test (B, D, E, F, G, H, I, J, M): *p<0.05, **p<0.01, ***p<0.001. ANOVA, analysis of variance; CDP-DAG, cytidine diphosphate diacylglycerol; CDS, cytidine diphosphate diacylglycerol synthase; DGAT, diacylglycerol O-acyltransferase; DG, diacylglycerol; FA, fatty acid; IP1, inositol monophosphate; KO, knockout; LPI, lysophosphatidylinositol; LKO, hepatocyte-specific Lpiat1 knockout; LPIAT1, lysophosphatidylinositol acyltransferase 1; NL, neutral lipid; n.s., not significant; PA, phosphatidic acid; PIOA, phosphatidylinositol with oleic acid; PIAA, phosphatidylinositol with arachidonic acid; PIS, PI synthase; PLA2, phospholipase A2; PLC, phospholipase C; TG, triglyceride; WT, wild-type.
Figure 4
Figure 4
LPIAT1 depletion exacerbates HFD-driven NAFLD pathogenesis. (A–D) Spheroids were formed by coculturing HepG2 and LX-2 cells with a 24:1 ratio on ultra-low attachment plates. Cells were transiently transfected with siScramble or siLPIAT1. (A) Cellular viability normalised to the volume of spheroids (n=8). (B) Representative immunofluorescence staining of DAPI, COL1A1 and merged images of spheroids. (C) Collagen content quantified by ImageJ, normalised to number of nuclei (n=4). (D) Expression of genes involved in inflammation and fibrosis (n=5). (E–M) F/F and LKO male C57BL/6 mice were fed Chow or high fat diet (HFD) for 18 weeks. n=4 and 5 for chow-fed F/F and LKO mice. n=10 and n=13 for HFD-fed F/F and LKO mice. (E) Changes in body weights of F/F and LKO mice fed Chow or HFD (F/F, n=7–12; LKO, n=8–13). (F) Liver weights of F/F and LKO mice fed HFD (F/F, n=10; LKO, n=13). (G) Levels of hepatic TG in F/F and LKO mice (F/F, n=7; LKO, n=8). (H, I) Plasma ALT (H) and AST (I) levels of F/F and LKO mice fed HFD (F/F, n=10; LKO, n=12). (J) Selected list of differentially expressed transcripts in livers of F/F and LKO mice fed Chow or HFD. (K) Gene ontology (GO) analysis of differentially expressed transcripts in livers of F/F and LKO mice fed HFD according to the values in the enrichment score under the theme of biological processes. Top 5% of the most enriched biological processes are listed. (L) Expression of genes involved in inflammation and fibrosis in livers of F/F and LKO fed HFD. (F/F, n=6; LKO, n=9). (M) Sirius red staining and F4/80 immunostaining of liver sections from F/F and LKO mice fed HFD. Arrows indicate the sites of inflammatory cell infiltration. Images are representative of three independent experiments. Values are shown as mean±SEM data were analysed by unpaired two-tailed Student’s t-test (A, C, E, F, G, H, I, L) and non-parametric Mann-Whitney U test (D): *p<0.05, **p<0.01, ***p<0.001. DAPI, 4'6-diamidino-2-phenylindole; LKO, Lpiat1 knockout; LPIAT1, lysophosphatidylinositol acyltransferase 1; NAFLD, non-alcoholic fatty liver disease; TG, triglyceride.
Figure 5
Figure 5
LPIAT1 rs641738 variant decreases levels of LPIAT1 mRNA and AA-containing PI in the human liver, without affecting expression of genes for de novo lipogenesis. (A) Lipidomic analysis of PI species in the human liver stratified by LPIAT1 rs641738 genotype (CC, n=35; CT, n=60; TT, n=20). (B) Expression of LPIAT1 in the human liver stratified by MBOAT7 rs641738 genotype (CC, n=46; CT, n=48; TT, n=29). (C) Expression of genes involved in lipogenesis, β-oxidation and gluconeogenesis in human liver stratified by LPIAT1 rs641738 genotype (CC, n=46; CT, n=48; TT, n=29). (D) Expression of genes involved in inflammation and fibrosis in human liver stratified by LPIAT1 rs641738 genotype (CC, n=46; CT, n=48; TT, n=29). Values are shown as mean and SD. P values calculated by linear regression analysis under an additive genetic model adjusted for age, gender and BMI. Values were log transformed before entering the model. *P<0.05, **P<0.01, ***P<0.001. AA, arachidonic acid; BMI, body mass index; CC, individuals homozygote for the C allele; CT, individuals heterozygote; LPIAT1, lysophosphatidylinositol acyltransferase 1; MBOAT7, membrane bound O-acyltransferase domain containing 7; PI, phosphatidylinositol; TT individuals homozygote for the T allele.

Similar articles

  • Mboat7 down-regulation by hyper-insulinemia induces fat accumulation in hepatocytes.
    Meroni M, Dongiovanni P, Longo M, Carli F, Baselli G, Rametta R, Pelusi S, Badiali S, Maggioni M, Gaggini M, Fracanzani AL, Romeo S, Gatti S, Davidson NO, Gastaldelli A, Valenti L. Meroni M, et al. EBioMedicine. 2020 Feb;52:102658. doi: 10.1016/j.ebiom.2020.102658. Epub 2020 Feb 12. EBioMedicine. 2020. PMID: 32058943 Free PMC article.
  • The MBOAT7-TMC4 Variant rs641738 Increases Risk of Nonalcoholic Fatty Liver Disease in Individuals of European Descent.
    Mancina RM, Dongiovanni P, Petta S, Pingitore P, Meroni M, Rametta R, Borén J, Montalcini T, Pujia A, Wiklund O, Hindy G, Spagnuolo R, Motta BM, Pipitone RM, Craxì A, Fargion S, Nobili V, Käkelä P, Kärjä V, Männistö V, Pihlajamäki J, Reilly DF, Castro-Perez J, Kozlitina J, Valenti L, Romeo S. Mancina RM, et al. Gastroenterology. 2016 May;150(5):1219-1230.e6. doi: 10.1053/j.gastro.2016.01.032. Epub 2016 Feb 2. Gastroenterology. 2016. PMID: 26850495 Free PMC article.
  • Loss of hepatic Mboat7 leads to liver fibrosis.
    Thangapandi VR, Knittelfelder O, Brosch M, Patsenker E, Vvedenskaya O, Buch S, Hinz S, Hendricks A, Nati M, Herrmann A, Rekhade DR, Berg T, Matz-Soja M, Huse K, Klipp E, Pauling JK, Wodke JA, Miranda Ackerman J, Bonin MV, Aigner E, Datz C, von Schönfels W, Nehring S, Zeissig S, Röcken C, Dahl A, Chavakis T, Stickel F, Shevchenko A, Schafmayer C, Hampe J, Subramanian P. Thangapandi VR, et al. Gut. 2021 May;70(5):940-950. doi: 10.1136/gutjnl-2020-320853. Epub 2020 Jun 26. Gut. 2021. PMID: 32591434 Free PMC article.
  • Non-Alcoholic Fatty Liver Disease.
    Engin A. Engin A. Adv Exp Med Biol. 2017;960:443-467. doi: 10.1007/978-3-319-48382-5_19. Adv Exp Med Biol. 2017. PMID: 28585211 Review.
  • MBOAT7 in liver and extrahepatic diseases.
    Caddeo A, Spagnuolo R, Maurotti S. Caddeo A, et al. Liver Int. 2023 Nov;43(11):2351-2364. doi: 10.1111/liv.15706. Epub 2023 Aug 22. Liver Int. 2023. PMID: 37605540 Review.

Cited by

References

    1. Lambert JE, Ramos-Roman MA, Browning JD, et al. . Increased de novo lipogenesis is a distinct characteristic of individuals with nonalcoholic fatty liver disease. Gastroenterology 2014;146:726–35. 10.1053/j.gastro.2013.11.049 - DOI - PMC - PubMed
    1. Sanders FWB, Griffin JL. De novo lipogenesis in the liver in health and disease: more than just a shunting yard for glucose. Biol Rev Camb Philos Soc 2016;91:452–68. 10.1111/brv.12178 - DOI - PMC - PubMed
    1. Parks EJ, Skokan LE, Timlin MT, et al. . Dietary sugars stimulate fatty acid synthesis in adults. J Nutr 2008;138:1039–46. 10.1093/jn/138.6.1039 - DOI - PMC - PubMed
    1. Stanhope KL, Schwarz JM, Keim NL, et al. . Consuming fructose-sweetened, not glucose-sweetened, beverages increases visceral adiposity and lipids and decreases insulin sensitivity in overweight/obese humans. J Clin Invest 2009;119:1322–34. 10.1172/JCI37385 - DOI - PMC - PubMed
    1. Shimano H, Horton JD, Hammer RE, et al. . Overproduction of cholesterol and fatty acids causes massive liver enlargement in transgenic mice expressing truncated SREBP-1a. J Clin Invest 1996;98:1575–84. 10.1172/JCI118951 - DOI - PMC - PubMed

Publication types