. 2020 May;31(5):946-961.
doi: 10.1681/ASN.2019101052. Epub 2020 Apr 6.

Tubule-Specific Mst1/2 Deficiency Induces CKD via YAP and Non-YAP Mechanisms

Affiliations

Tubule-Specific Mst1/2 Deficiency Induces CKD via YAP and Non-YAP Mechanisms

Chunhua Xu et al. J Am Soc Nephrol. 2020 May.

Abstract

Background: The serine/threonine kinases MST1 and MST2 are core components of the Hippo pathway, which has been found to be critically involved in embryonic kidney development. Yes-associated protein (YAP) and transcriptional coactivator with PDZ-binding motif (TAZ) are the pathway's main effectors. However, the biologic functions of the Hippo/YAP pathway in adult kidneys are not well understood, and the functional role of MST1 and MST2 in the kidney has not been studied.

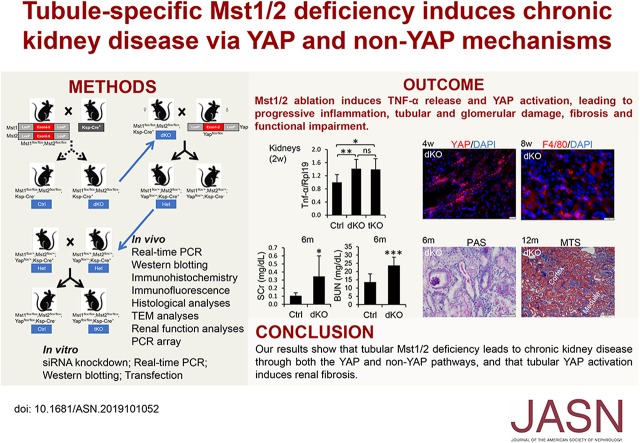
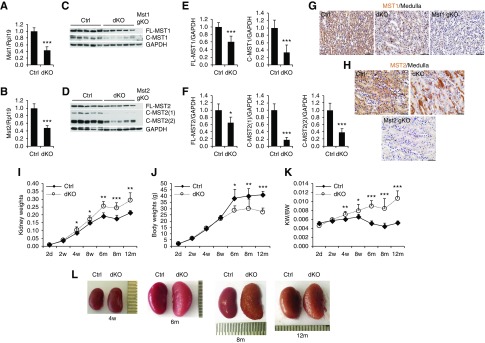
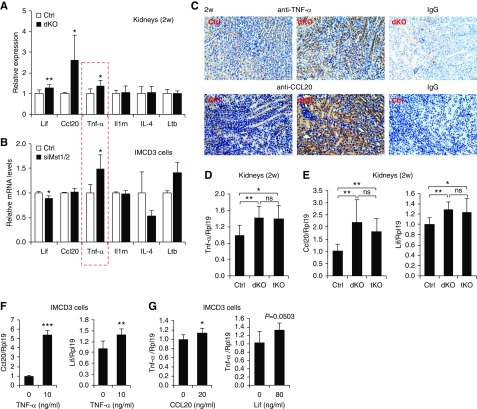
Methods: We used immunohistochemistry to examine expression in mouse kidneys of MST1 and MST2, homologs of Hippo in Drosophila. We generated mice with tubule-specific double knockout of Mst1 and Mst2 or triple knockout of Mst1, Mst2, and Yap. PCR array and mouse inner medullary collecting duct cells were used to identify the primary target of Mst1/Mst2 deficiency.

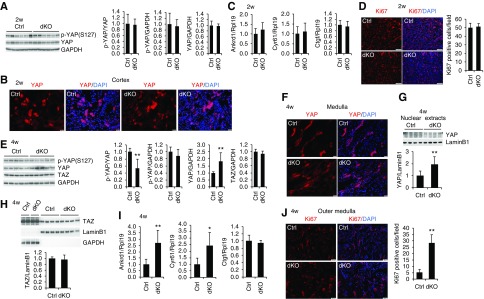
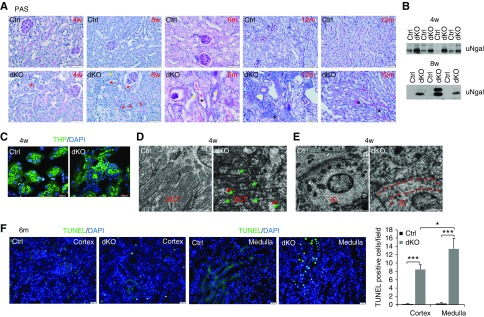
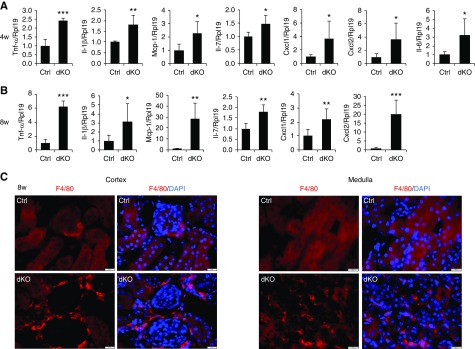
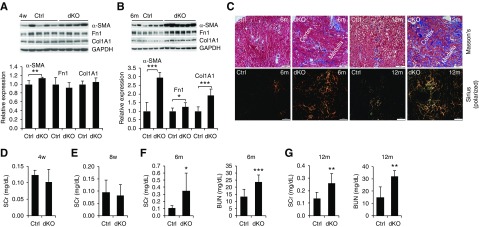
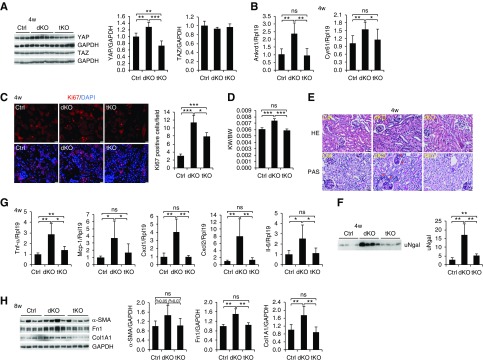
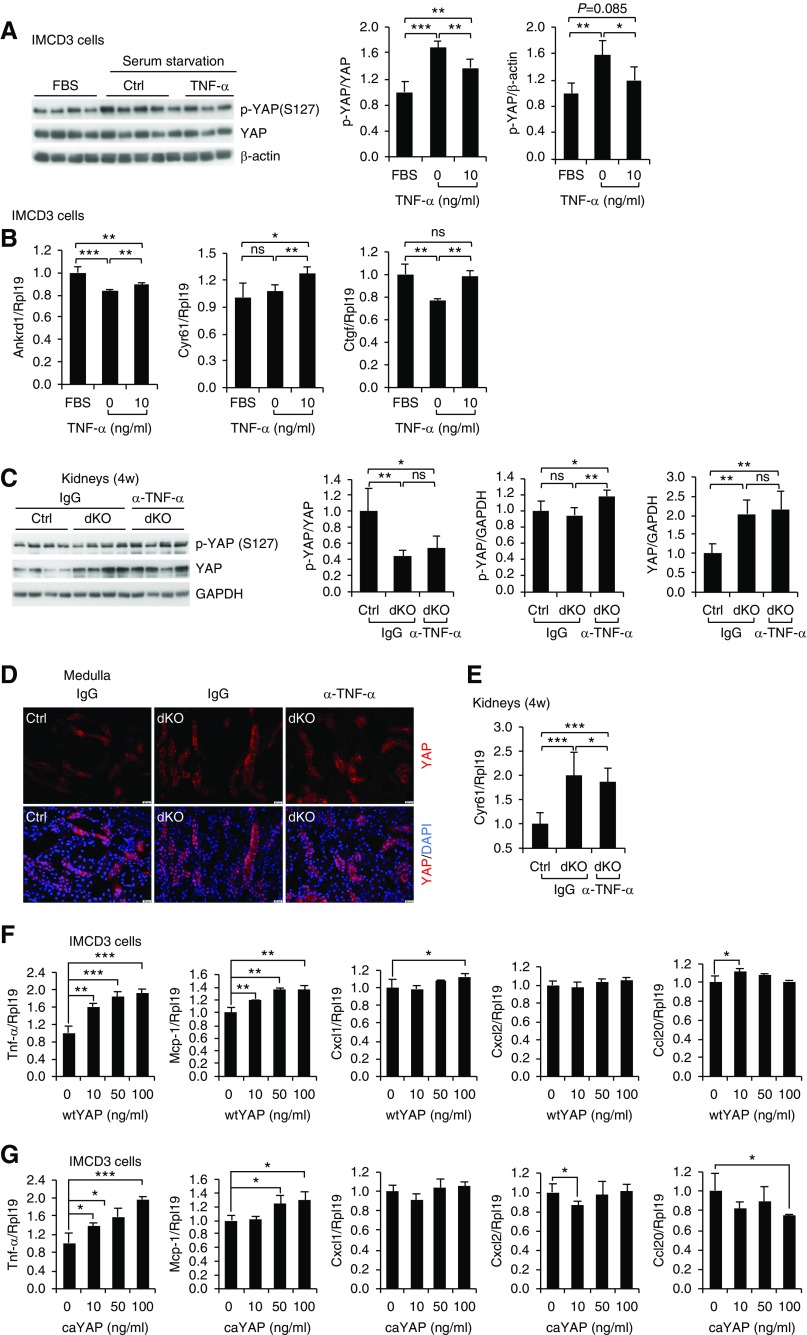
Results: MST1 and MST2 were predominantly expressed in the tubular epithelial cells of adult kidneys. Deletion of Mst1/Mst2 in renal tubules increased activity of YAP but not TAZ. The kidneys of mutant mice showed progressive inflammation, tubular and glomerular damage, fibrosis, and functional impairment; these phenotypes were largely rescued by deletion of Yap in renal tubules. TNF-α expression was induced via both YAP-dependent and YAP-independent mechanisms, and TNF-α and YAP amplified the signaling activities of each other in the tubules of kidneys with double knockout of Mst1/Mst2.

Conclusions: Our findings show that tubular Mst1/Mst2 deficiency leads to CKD through both the YAP and non-YAP pathways and that tubular YAP activation induces renal fibrosis. The pathogenesis seems to involve the reciprocal stimulation of TNF-α and YAP signaling activities.

Keywords: CKD; Hippo; MST1; MST2; YAP; renal fibrosis.


Figures

None
Graphical abstract
Figure 1.
Figure 1.
MST1 and MST2 were expressed in renal tubular cells and deletion of Mst1/2 in tubular cells caused kidney overgrowth. (A–F) Mst1 and Mst2 mRNA and protein levels in the kidneys of control (Ctrl; Mst1flox/flox;Mst2flox/flox) and Mst1/2 dKO (Mst1flox/flox;Mst2flox/flox;Ksp-Cre) mice. Kidneys collected from 4-week-old male Ctrl and Mst1/2 dKO mice were analyzed for (A and B) Mst1 and Mst2 mRNA levels by real-time PCR or (C and D) MST1 and MST2 protein levels by western blotting. Quantitative analysis of full-length (FL-) and cleaved (C-; E) MST1 and (F) MST2 protein levels was performed by densitometry. Rpl19 was used as internal Ctrl for real-time PCR. Glyceraldehyde-3-phosphate dehydrogenase (GAPDH) was used as the loading Ctrl for western blotting. (G and H) Immunohistochemistry for MST1 and MST2 in Ctrl and Mst1/2 dKO kidneys. Paraffin kidney sections from 8-week-old mice were used for immunohistochemistry with 3,3′-Diaminobenzidine (DAB) staining (brown). Mst1 gKO and Mst2 gKO kidneys were used as respective negative Ctrl. Scale bar: 50 µm. (I–L) Kidney size and appearance in Mst1/2 dKO mice. (I) Kidney weights, (J) body weights, and (K) ratios of kidney weights (KW) to body weights (BW) are presented for Ctrl and Mst1/2 dKO male mice at different ages. (L) Representative macroscopic images of kidneys of the indicated genotypes at different ages are presented. (A–F) n=5. n=4/5/5/5/6/7/6 (Ctrl) and 4/9/4/5/6/7/6 (dKO) for the different ages in (I–L). In (L), 1 unit=0.5 mm. Comparisons were made between Ctrl and dKO in (I–K). *P<0.05; **P<0.01; ***P<0.001.
Figure 2.
Figure 2.
Deletion of Mst1/2 in renal tubular cells activated YAP in mice at 4 weeks but not at 2 weeks of age. (A) Phosphorylated YAP (p-YAP) and total YAP levels in the kidneys of control (Ctrl) and Mst1/2 dKO mice at 2 weeks of age. Kidneys collected from male mice were analyzed for p-YAP and YAP levels by western blotting. Quantitative analysis of p-YAP relative to YAP, p-YAP relative to glyceraldehyde-3-phosphate dehydrogenase (GAPDH), and YAP relative to GAPDH was performed by densitometry. (B) Immunofluorescence for YAP in the kidneys of Mst1/2 dKO at 2 weeks of age. Frozen kidney sections from male Ctrl and Mst1/2 dKO mice were used for immunofluorescence for YAP (red). Nuclei were stained with 4′,6-diamidino-2-phenylindole (DAPI; blue). Scale bar: 20 µm. (C) Expression of the YAP target genes Ankrd1, Cyr61, and Ctgf in Ctrl and Mst1/2 dKO kidneys at 2 weeks of age. Kidneys collected from male mice were analyzed for Ankrd1, Cyr61, and Ctgf mRNA levels by real-time PCR. (D) Immunofluorescence for Ki67 in the kidneys of Mst1/2 dKO at 2 weeks of age. Frozen kidney sections from Ctrl and Mst1/2 dKO mice were used for immunofluorescence for Ki67 (red). Sections were counterstained with DAPI (blue). Ki67-positive tubular cells were counted in ten different fields of each section from each of three Ctrl or Mst1/2 dKO mice (right panel). Scale bar: 100 µm. (E) p-YAP, YAP, and TAZ levels in the kidneys of Ctrl and Mst1/2 dKO mice at 4 weeks of age. Kidneys collected from male mice were analyzed for p-YAP, YAP, and TAZ levels by western blotting. Quantitative analysis of p-YAP relative to YAP, p-YAP relative to GAPDH, YAP relative to GAPDH, and TAZ relative to GAPDH was performed by densitometry. (F and G) Nuclear localization of YAP in Mst1/2 dKO kidneys at 4 weeks of age. Frozen sections from Ctrl and Mst1/2 dKO kidneys were used for immunofluorescence for YAP (red). Nuclei were stained with DAPI (blue). Scale bar: 20 µm. Nuclear extracts from Ctrl and Mst1/2 dKO kidneys were subjected to western blotting for YAP (G, upper panel). Quantitative analysis of nuclear YAP protein levels was performed by densitometry (G, lower panel). (H) Nuclear TAZ levels in Mst1/2 dKO kidneys at 4 weeks of age. Cytosolic and nuclear extracts from Ctrl and Mst1/2 dKO kidneys were subjected to western blotting for TAZ (upper panel). Quantitative analysis of nuclear TAZ protein levels was performed by densitometry (lower panel). (I) Expression of the YAP target genes Ankrd1, Cyr61, and Ctgf in Ctrl and Mst1/2 dKO kidneys at 4 weeks of age. Kidneys collected from male mice were analyzed for Ankrd1, Cyr61, and Ctgf mRNA levels by real-time PCR. (J) Immunofluorescence for Ki67 in the kidneys of Mst1/2 dKO mice at 4 weeks of age. Frozen kidney sections from male Ctrl and Mst1/2 dKO mice were used for immunofluorescence for Ki67 (red). Nuclei were stained with DAPI (blue). Ki67-positive tubular cells in the outer medulla were counted in ten different fields of each section from each of three Ctrl or Mst1/2 dKO mice (right panel). Scale bar: 50 µm. Rpl19 was used as internal Ctrl for real-time PCR. GAPDH was used as loading Ctrl for whole lysates, and LaminB1 was used as loading Ctrl for nuclear extracts. n=4 for (C); n=3 for (D, F, and J); and n=4 for (I). *P<0.05; **P<0.01.
Figure 3.
Figure 3.
Deletion of Mst1/2 in renal tubular cells induced tubular damage in the kidney. (A) Representative images of periodic acid–Schiff (PAS) staining. Paraffin sections from control (Ctrl) and Mst1/2 dKO kidneys at 4 and 8 weeks and 6 and 12 months of age were used for PAS staining. Red asterisks indicate tubules with thickening of tubular basement membrane, yellow asterisks indicate multiple layering of the epithelium and tubular cell sloughing, and black asterisks indicate tubular casts. Scale bars: 50 µm for 4 and 8 weeks and 6 months of age; 100 µm for 12 months of age. (B) Ngal levels in urine. Spot urine samples from Ctrl and Mst1/2 dKO mice at 4 and 8 weeks of age were subjected to western blotting for Ngal. (C) Immunofluorescence for THP. Frozen kidney sections from Ctrl and Mst1/2 dKO mice at 4 weeks of age were used for immunofluorescence for THP (green). Sections were counterstained with 4′,6-diamidino-2-phenylindole (DAPI; blue). Scale bar: 20 µm. (D and E) Representative transmission electron microscopy photographs of mitochondrial morphology in tubular cells of Ctrl and Mst1/2 dKO kidneys at 4 weeks of age. (D) Red arrows indicate swelling, and green arrows indicate loss of cristae. (E) The stripe between the two dotted red lines indicates the area that is supposed to have many mitochondria but actually lacks mitochondria in the interacted cells of Mst1/2 dkO kidneys. DCT, distal convoluted tubule; IC, intercalated cell. Scale bar: 2.0 µm. (F) TUNEL-positive tubular cell numbers in Mst1/2 dKO kidneys. Paraffin kidney sections from Ctrl and Mst1/2 dKO mice at 6 months of age were used for TUNEL staining. Nuclear localization of TUNEL signal was demonstrated by cyan-colored nuclei after merging with DAPI. TUNEL-positive tubular cells in the cortex and medulla were counted in ten different fields of each section from each of three Ctrl or Mst1/2 dKO mice (right panel). Scale bar: 20 µm. *P<0.05; ***P<0.001.
Figure 4.
Figure 4.
Deletion of Mst1/2 in renal tubular cells induced renal inflammation. (A and B) Expression of inflammatory factors in Mst1/2 dKO kidneys. Kidneys collected from male control (Ctrl) and Mst1/2 dKO mice at (A) 4 and (B) 8 weeks of age were analyzed for Tnf-α, Il-1β, Mcp-1, Il-7, Cxcl1, Cxcl2, and Il-6 mRNA levels by real-time PCR. (C) Infiltration of macrophages in the cortex and medulla of Mst1/2 dKO kidneys. Frozen kidney sections from Ctrl and Mst1/2 dKO mice at 8 weeks of age were used for immunofluorescence staining for F4/80 (red). Sections were counterstained with 4′,6-diamidino-2-phenylindole (DAPI; blue). Rpl19 was used as internal Ctrl for real-time PCR. n=4/5 (4/8 weeks). Scale bar: 20 µm. *P<0.05; **P<0.01; ***P<0.001.
Figure 5.
Figure 5.
Deletion of Mst1/Mst2 in renal tubule cells induced kidney fibrosis and functional impairment in mice. (A and B) Expression of α-smooth muscle actin (α-SMA), fibronectin 1 (Fn1), and type 1 collagen α1 (Col1A1). Kidneys from control (Ctrl) and Mst1/2 dKO mice at (A) 4 weeks and (B) 6 months of age were subjected to western blotting for α-SMA, Fn1, and Col1A1 (upper panels). Quantitative analysis of α-SMA, Fn1, and Col1A1 protein levels was performed by densitometry (lower panels). Glyceraldehyde-3-phosphate dehydrogenase (GAPDH) was used as loading Ctrl. (C) Representative photographs of Masson trichrome and Sirius red staining. Paraffin sections from Ctrl and Mst1/2 dKO kidneys at 6 and 12 months of age were used for Masson trichrome and Sirius red staining to assess fibrosis. Photographs for Sirius staining were taken under polarized light with a polarizing microscope. Scale bar: 200 µm. (D–G) Serum creatinine (SCr) and BUN levels. Serum samples from Ctrl and Mst1/2 dKO mice at (D) 4 and (E) 8 weeks and (F) 6 and (G) 12 months of age were measured for creatinine and BUN levels. n=5/4 (Ctrl/dKO) for (D), n=5 for (E), and n=6 for (F and G). *P<0.05; **P<0.01; ***P<0.001.
Figure 6.
Figure 6.
The phenotypes observed in Mst1/2 dKO mice were largely mediated by YAP. (A) YAP and TAZ expression in the kidneys of control (Ctrl), Mst1/2 dKO, and Mst1/Mst2/Yap tKO mice. Kidney lysates from Ctrl, Mst1/2 dKO, and Mst1/Mst2/Yap tKO at 4 weeks of age were used for western blotting for YAP and TAZ (left panel). Quantitative analysis of YAP and TAZ protein levels relative to glyceraldehyde-3-phosphate dehydrogenase (GAPDH) levels was performed (right panels). (B) mRNA levels of the YAP target genes Ankrd1 and Cyr61 in the kidney. Kidneys were used for real-time PCR analysis for Ankrd1 and Cyr61 mRNA levels. (C) Immunofluorescence for Ki67 (red) in Ctrl, Mst1/2 dKO, and Mst1/Mst2/Yap tKO kidneys (left panels). Nuclei were stained with 4′,6-diamidino-2-phenylindole (DAPI; blue). Scale bar: 20 µm. Ki67-positive tubular cells were counted in ten different fields of each section from each mouse (right panel). (D) Ratios of kidney weight to body weight in Ctrl, Mst1/2 dKO, and Mst1/Mst2/Yap tKO mice. Male mice at 4 weeks of age were used to calculate the ratios of kidney weight (KW) to body weight (BW). (E) Representative photographs of hematoxylin and eosin (HE) and periodic acid–Schiff (PAS) staining of the kidneys of Ctrl, Mst1/2 dKO, and Mst1/Mst2/Yap tKO mice. Paraffin sections from the mice at 4 weeks of age were used for HE and PAS staining. Red asterisks indicate tubules with thickening of tubular basement membrane. Scale bar: 25 µm. (F) Urinary Ngal levels. Spot urine samples from Ctrl, Mst1/2 dKO, and Mst1/Mst2/Yap tKO mice at 4 weeks of age were subjected to western blotting for Ngal. Quantitative analysis was performed by densitometry (left panel). (G) mRNA levels of Tnf-α, Mcp-1, Cxcl1, Cxcl2, and Il-6 in the kidneys of Ctrl, Mst1/2 dKO, and Mst1/Mst2/Yap tKO mice. Kidneys of male mice at 4 weeks of age were used for real-time PCR analysis. (H) Expression of α-smooth muscle actin (α-SMA), fibronectin 1 (Fn1), and type 1 collagen α1 (Col1A1) in the kidneys of Ctrl, Mst1/2 dKO, and Mst1/Mst2/Yap tKO mice at 8 weeks of age. Quantitative analysis of α-SMA, Fn1, and Col1A1 protein levels was performed by densitometry (left panels). GAPDH was used as loading Ctrl for western blotting. Rpl19 was used as internal Ctrl for real-time PCR. n=5 for (B and G), n=3 for (C), and n=5/4/4 (Ctrl/dKO/tKO) for (D). ns, no significance. *P<0.05; **P<0.01; ***P<0.001.
Figure 7.
Figure 7.
Mst1/2 deficiency increased Tnf-α expression in tubular cells independently of YAP in 2-week-old mice. (A) mRNA levels of Lif, Ccl20, Tnf-α, Il1rn, Il-4, and Ltb in the kidneys of control (Ctrl) and Mst1/2 dKO mice. Kidneys of male mice at 2 weeks of age were used for real-time PCR analysis. (B) mRNA levels of Lif, Ccl20, Tnf-α, Il1rn, Il-4, and Ltb in IMCD3 cells. Cells were transfected with Ctrl or Mst1/2 siRNAs (siMst1/2). The red box indicates that only Tnf-α was increased in both the kidneys and IMCD3 cells. (C) Immunohistochemistry for TNF-α and CCL20 in Ctrl and Mst1/2 dKO kidneys. Paraffin kidney sections from 2-week-old mice were used for immunohistochemistry with 3,3′-Diaminobenzidine (DAB) staining (brown). Normal rabbit IgG was used negative Ctrl. Scale bar: 20 µm. (D and E) mRNA levels of (D) Tnf-α as well as (E) Ccl20 and Lif in the kidneys of Ctrl, Mst1/2 dKO, and Mst1/Mst2/Yap tKO mice. Kidneys of male mice at 2 weeks of age were used for real-time PCR analysis. (F) Effects of TNF-α on Ccl20 and Lif mRNA levels in IMCD3 cells. Cells were serum starved overnight before they were treated with or without 10 ng/ml TNF-α protein for 6 hours. Cells were collected for analysis for Ccl20 and Lif mRNA levels. (G) Effects of CCL20 and Lif on Tnf-α mRNA levels in IMCD3 cells. Cells were serum starved overnight before they were treated with or without 20 ng/ml CCL20 or 80 ng/ml Lif for 6 hours. Cells were collected for analysis for Tnf-α mRNA levels. n=4/8 (Ctrl/dKO) for (A); n=3 for (B, F, and G); and n=7/9/7 (Ctrl/dKO/tKO) for (D). ns, no significance. *P<0.05; **P<0.01; ***P<0.001.
Figure 8.
Figure 8.
TNF-α and YAP formed a positive feedback loop. (A) Effects of TNF-α treatment on YAP phosphorylation. IMCD3 cells were serum starved overnight before they were treated with or without 10 ng/ml TNF-α protein or treated with complete medium (FBS) for 2 hours. Cell lysates were used for western blotting for phosphorylated YAP (p-YAP; S217) and total YAP. Quantitative analysis of p-YAP relative to YAP and p-YAP relative to β-actin levels was performed by densitometry. (B) Effects of TNF-α treatment on Ankrd1, Cyr61, and Ctgf mRNA levels. IMCD3 cells were serum starved overnight before they were treated with or without 10 ng/ml TNF-α protein or treated with complete medium (FBS) for 6 hours. (C–E) Effects of immunoneutralization of TNF-α on YAP signaling in Mst1/2 dKO mice. Mice at 4 weeks of age were injected with normal IgG or anti–TNF-α antibody (α-TNF-α). Sixteen to 18 hours later, the mice received another injection of the antibodies or normal IgG. Four hours after the second injection, kidneys were harvested (C) for western blotting for phospho-YAP and YAP, (D) for immunofluorescence for YAP (red), or (E) for real-time PCR analysis for Cyr61 mRNA. (C) Quantitative analysis of p-YAP relative to YAP, p-YAP relative to glyceraldehyde-3-phosphate dehydrogenase (GAPDH), and YAP relative to GAPDH was performed by densitometry. (D) Nuclei were stained with 4′,6-diamidino-2-phenylindole (DAPI; blue). Scale bar: 20 µm. (F and G) Effects of wtYAP or caYAP on mRNA levels for Tnf-α, Mcp-1, Cxcl1, Cxcl2, and Ccl20. IMCD3 cells were transfected with increasing amounts of (F) wtYAP or (G) caYAP plasmids. The cells were harvested for real-time PCR analysis for Tnf-α, Mcp-1, Cxcl1, Cxcl2, and Ccl20 mRNA levels. n=4 for (B), n=3 for (F and G), and n=7 for (E). ns, no significance. *P<0.05; **P<0.01; ***P<0.001.

Comment in

  • Tubular MST1/2 Deletion and Renal Fibrosis.
    Chang-Panesso M. Chang-Panesso M. J Am Soc Nephrol. 2020 May;31(5):893-894. doi: 10.1681/ASN.2020030305. Epub 2020 Apr 6. J Am Soc Nephrol. 2020. PMID: 32271714 Free PMC article. No abstract available.

Similar articles

Cited by

References

    1. Zhang L, Wang F, Wang L, Wang W, Liu B, Liu J, et al. .: Prevalence of chronic kidney disease in China: A cross-sectional survey. Lancet 379: 815–822, 2012 - PubMed
    1. Levin A, Tonelli M, Bonventre J, Coresh J, Donner J-A, Fogo AB, et al. .; ISN Global Kidney Health Summit participants: Global kidney health 2017 and beyond: A roadmap for closing gaps in care, research, and policy. Lancet 390: 1888–1917, 2017 - PubMed
    1. Breyer MD, Susztak K: The next generation of therapeutics for chronic kidney disease. Nat Rev Drug Discov 15: 568–588, 2016 - PMC - PubMed
    1. Pan D: The hippo signaling pathway in development and cancer. Dev Cell 19: 491–505, 2010 - PMC - PubMed
    1. Yu FX, Zhao B, Guan KL: Hippo pathway in organ size control, tissue homeostasis, and cancer. Cell 163: 811–828, 2015 - PMC - PubMed

Publication types

MeSH terms