. 2020 Apr;30(4):515-527.
doi: 10.1101/gr.253211.119. Epub 2020 Apr 6.

Redundant and specific roles of cohesin STAG subunits in chromatin looping and transcriptional control

Affiliations

Redundant and specific roles of cohesin STAG subunits in chromatin looping and transcriptional control

Valentina Casa et al. Genome Res. 2020 Apr.

Abstract

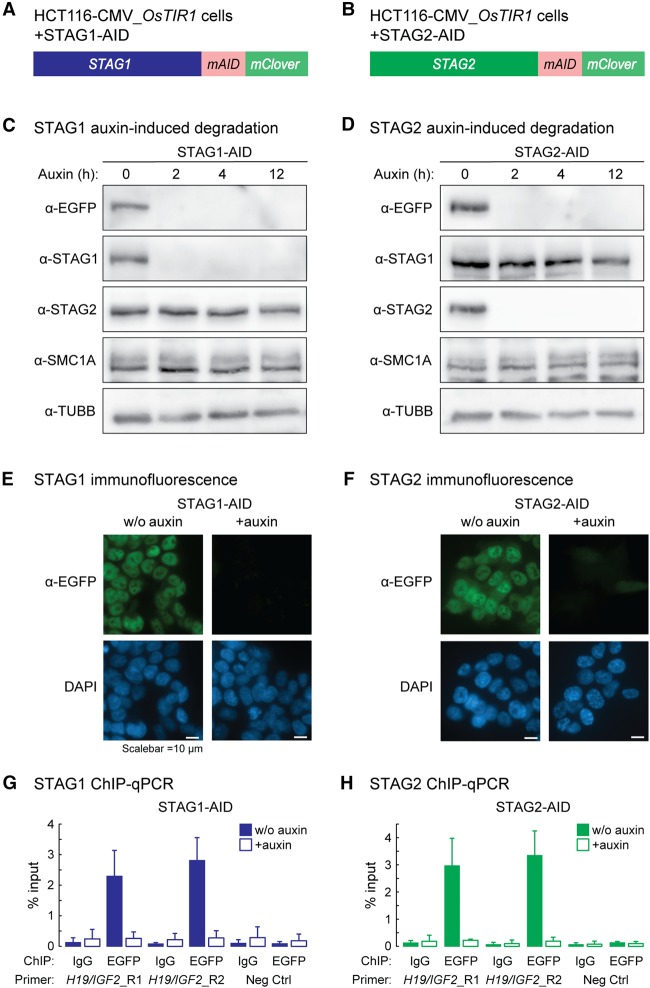
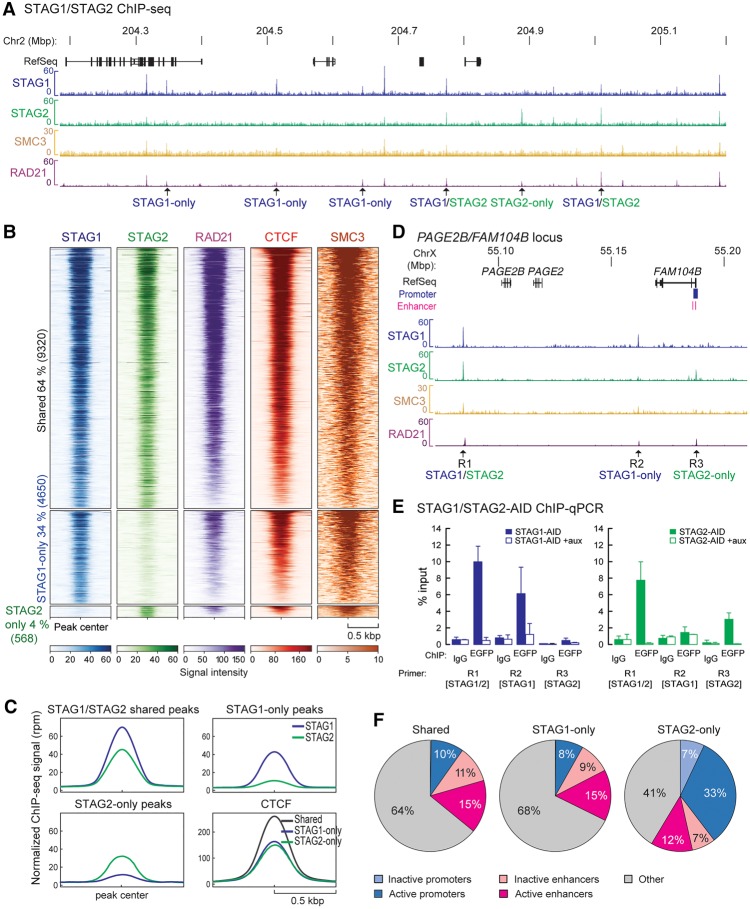
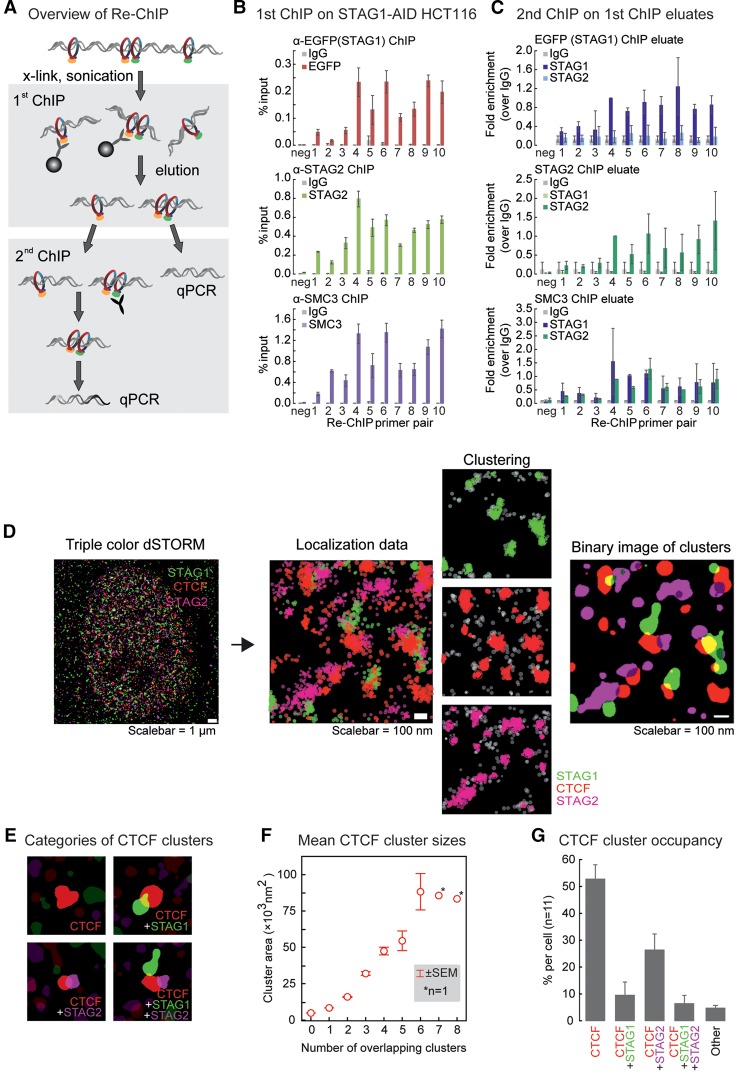
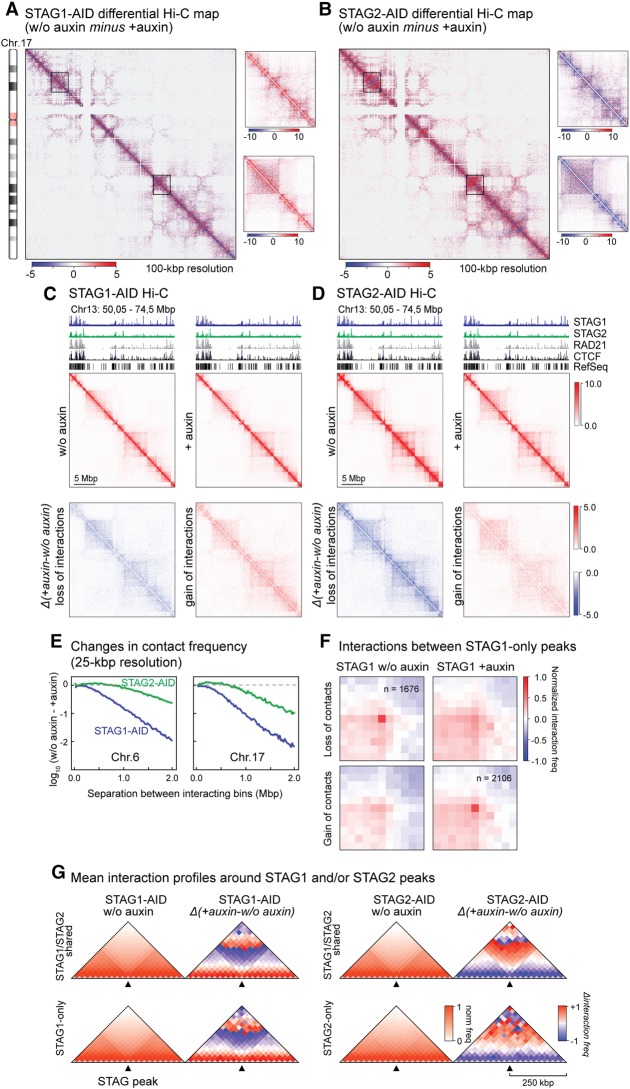
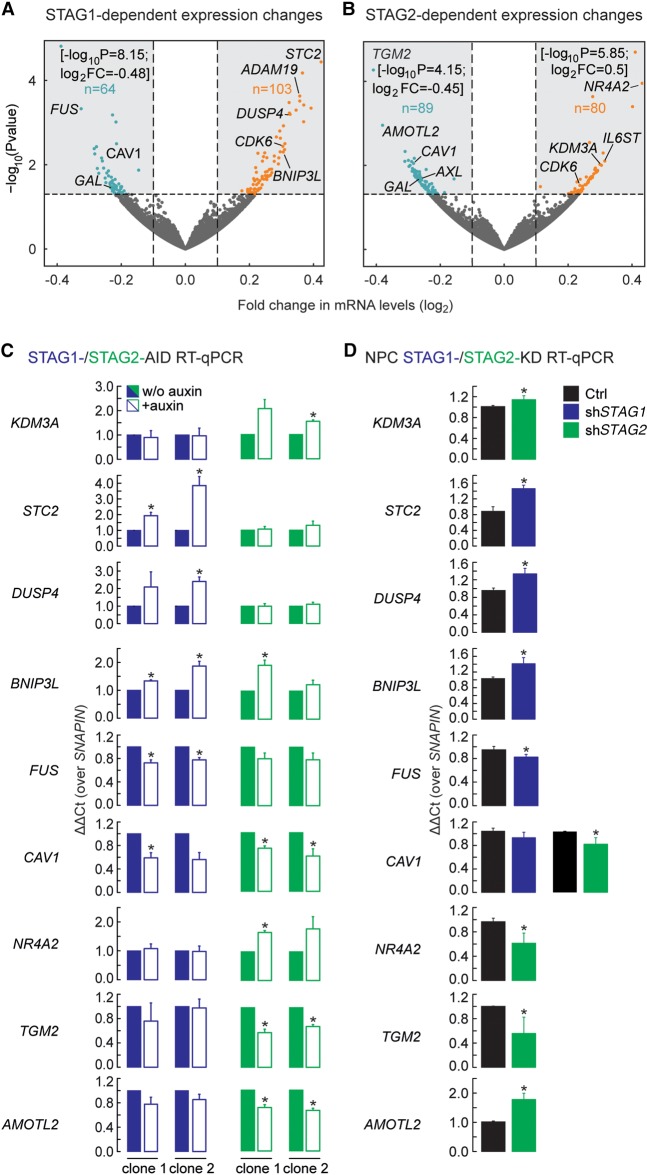
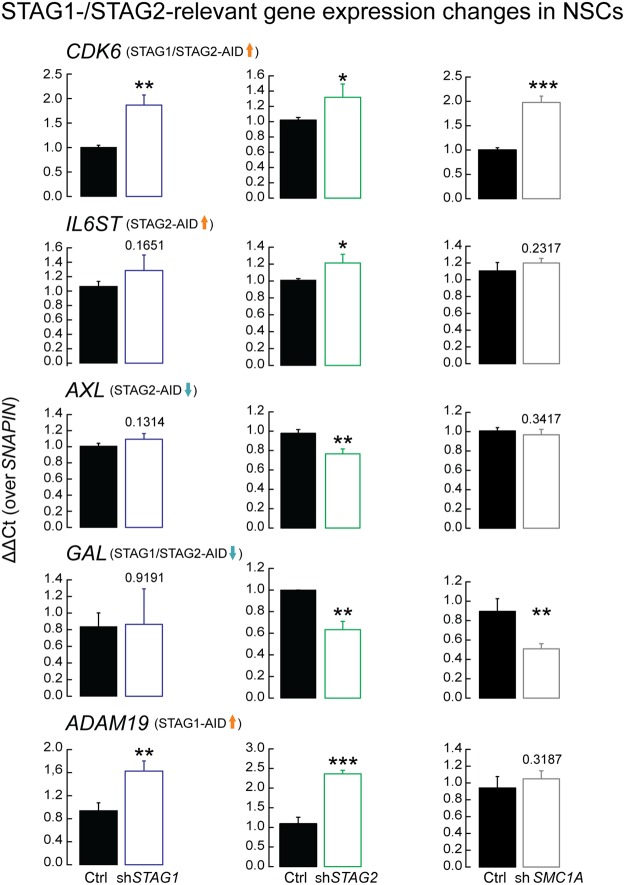
Cohesin is a ring-shaped multiprotein complex that is crucial for 3D genome organization and transcriptional regulation during differentiation and development. It also confers sister chromatid cohesion and facilitates DNA damage repair. Besides its core subunits SMC3, SMC1A, and RAD21, cohesin in somatic cells contains one of two orthologous STAG subunits, STAG1 or STAG2. How these variable subunits affect the function of the cohesin complex is still unclear. STAG1- and STAG2-cohesin were initially proposed to organize cohesion at telomeres and centromeres, respectively. Here, we uncover redundant and specific roles of STAG1 and STAG2 in gene regulation and chromatin looping using HCT116 cells with an auxin-inducible degron (AID) tag fused to either STAG1 or STAG2. Following rapid depletion of either subunit, we perform high-resolution Hi-C, gene expression, and sequential ChIP studies to show that STAG1 and STAG2 do not co-occupy individual binding sites and have distinct ways by which they affect looping and gene expression. These findings are further supported by single-molecule localizations via direct stochastic optical reconstruction microscopy (dSTORM) super-resolution imaging. Since somatic and congenital mutations of the STAG subunits are associated with cancer (STAG2) and intellectual disability syndromes with congenital abnormalities (STAG1 and STAG2), we verified STAG1-/STAG2-dependencies using human neural stem cells, hence highlighting their importance in particular disease contexts.


Figures

Figure 1.
Figure 1.
Acute auxin-inducible degradation of STAG1 and STAG2. (A,B) Schematic of the CRISPR-mediated modification of STAG1 (A) and STAG2 (B) to add a mini auxin-inducible degron tag (mAID) and a mClover tag to the C termini of STAG1 and STAG2 in HCT116-CMV-OsTIR1 cells. (C,D) Addition of auxin leads to a degradation of STAG1-AID (C) and STAG2-AID (D) within 2 h without affecting the protein level of the respective other ortholog. (E,F) Visualization of the STAG1-AID (E) and STAG2-AID (F) degradation 12 h after auxin addition by immunostaining. (G,H) ChIP-qPCR with anti-EGFP antibodies (detects mClover) shows efficient depletion of STAG1-AID (G) and STAG2-AID (H) from cohesin sites in the H19/IGF2 locus.
Figure 2.
Figure 2.
STAG1 and STAG2 have overlapping as well as discrete binding positions on chromatin. (A) ChIP-sequencing profiles of STAG1 and STAG2 from STAG1-AID and STAG2-AID cells using anti-EGFP antibodies (merge of two replicates), SMC3 ChIP-sequencing for STAG1-AID cells and published RAD21 ChIP-seq data from RAD21-AID cells (Rao et al. 2017) are displayed. Examples of STAG1-only, STAG2-only, and STAG1/2 shared sites are indicated. (B) Heat maps showing the ChIP-seq signals for STAG1, STAG2, RAD21, CTCF, and SMC3 in common and -only sites. RAD21 and CTCF ChIP-seq data are from Rao et al. (2017). (C) Averaged signal intensity of STAG1, STAG2 and CTCF (Rao et al. 2017) on STAG1/2 common sites and STAG1-/STAG2-only sites. (D) Examples of STAG1 and STAG2 binding sites in the PAGE2B/FAM104B locus that were tested in (E) by ChIP-qPCR. (E) Efficiency of auxin-mediated degradation was tested by ChIP-qPCR for different STAG1/STAG2 sites. (F) Localization of STAG1/STAG2 common sites or STAG1- or STAG2-only sites to inactive/active promoters or active/inactive enhancers based on the presence of characteristic histone modifications (Supplemental Table S7). The percentage of the sites in the different regions is indicated.
Figure 3.
Figure 3.
STAG1 and STAG2 do not co-occupy individual binding sites. (A) Overview of the Re-ChIP protocol. Please note that in the first ChIP, the antibodies were crosslinked to the beads, allowing for their complete removal from the eluate. (B) First ChIP in the Re-ChIP protocol performed from STAG1-AID cells with antibodies against EGFP (to precipitate STAG1), or STAG2 or against SMC3 as a positive control. For the analysis, qPCR primers for the amplification of one negative and 10 positive cohesin binding sites were used (mean and SD from n = 2). (C) The second ChIP was performed with control IgG, anti-STAG1, and anti-STAG2 antibodies using the eluates from the first ChIP. The same primers as in B were used for the analysis. Data are shown as fold enrichment versus IgG; the replicates are further normalized using the positive site #4 (see Methods; mean and SD from n = 3 for STAG1 and STAG2, n = 2 for SMC3). (D) Analysis pipeline of the dSTORM imaging data. A merged reconstructed triple-color dSTORM image of a single nucleus stained for STAG1 (green), STAG2 (magenta), and CTCF (red) is shown at the left side. For a zoomed region from the same cell, the raw localizations are shown. The result of the kernel density estimation-based clustering algorithm for the individual colors are shown next to it. Not-clustered localizations are depicted in gray. Finally, a binary image of the same region is shown at the right with the clusters for all three proteins represented. (E) Examples of the four most common groups of CTCF cluster with either: none, one STAG1, one STAG2, or both one STAG1 and one STAG2 cluster adhering. (F) The cluster area size (nm2) for CTCF is plotted grouped per number of adherent clusters of STAG1 or STAG2. (G) Frequency of CTCF cluster groups per cell measured for 11 cells. All CTCF clusters falling in other groups are depicted as “Others.” This group contains 18 subgroups, for example, adhering to more than two clusters or two clusters of the same STAG. All error bars show standard error of the mean (± SEM). Note that in Supplemental Figure S7, the same experiment using different secondary antibodies and different fluorophores is shown.
Figure 4.
Figure 4.
Hi-C reveals different contributions of STAG1 and STAG2 to higher-order chromatin structure. (A,B) Differential maps of Chromosome 17 illustrating the chromatin contact changes after auxin-mediated degradation of STAG1 (A, STAG1-AID) or STAG2 (B, STAG2-AID). Examples of changes are encircled. Color key = Balanced (Knight-Ruiz) Hi-C contact frequencies. (C,D) Zoom-in for a region of Chromosome 13 into the contact maps for STAG1-AID (C) and STAG2-AID (D) cells. The maps for untreated cells (w/o auxin), treated cells (+auxin), and the differential interaction maps split in loss of interactions (blue) and gain of interactions (red) are shown. (E) Change of chromatin contact frequency relative to the separation of the contacting bins (25 kb) after STAG1 or STAG2 degradation for the examples of Chromosomes 6 and 17. (F) Aggregate peak analysis of STAG1-only peaks showing that a lot of the sites lose their respective contacts after STAG1 degradations while alternative contacts are formed. (G) Insulation plots showing the averaged Hi-C signals for all STAG1/STAG2 shared peaks as well as all STAG1-only and STAG2-only peaks in the untreated maps (w/o auxin). For the same peaks, the averaged differential Hi-C signals in the different maps are shown. The maps are presented with a bin size of 25 kb and 10 bins to the left and right of each binding site.
Figure 5.
Figure 5.
STAG1 or STAG2 regulate different genes. (A,B) Volcano plots representing the transcriptional changes after STAG1 degradation (A) or STAG2 degradation (B). Significantly changing genes are plotted in blue when down-regulated, in orange when up-regulated. Genes that lie outside of the plotted range are indicated with their fold change and P-value. (C) Validation of genes responding to degradation of STAG1 or STAG2 in two independent clones of the respective AID cells by RT-PCR/qPCR. Genes that respond to STAG1 (STC2, DUSP4, BNIP3L, FUS) or STAG2 (KDM3A, NR4A2, TGM2, AMOTL2) or both (CAV1) were tested. (D) Sensitivity of genes to depletion of STAG1 or STAG2 was recapitulated in neural stem cells using siRNA depletion of STAG1 (shSTAG1) and STAG2 (shSTAG2). Mean of n = 3, t-test P-values are indicated, (*) P < 0.05, (**) P < 0.01.
Figure 6.
Figure 6.
STAG1 and STAG2 are important in the regulation of genes involved in neuronal development. Genes found to be involved in neuronal development and misregulated by STAG1 and STAG2 degradation were tested in neural stem cells under control (Ctrl), STAG1 (shSTAG1), STAG2 (shSTAG2), and SMC1A (shSMC1A) siRNA knockdown to test whether they depend specifically on STAG1 or STAG2 or on the presence of the cohesin complex in general. The tested genes are: CDK6, associated with microcephaly (Faheem et al. 2015); AXL, intellectual disability (Burstyn-Cohen 2017); IL6ST, neural protection and development (März et al. 1997); ADAM19, neurogenesis (Alfandari and Taneyhill 2018); GAL, neuro-regulatory peptide-encoding gene (Borroto-Escuela et al. 2017). Mean of n = 3; t-test P-values are indicated. (*) P < 0.05, (**) P < 0.01, (***) P < 0.001.

References

    1. Alfandari D, Taneyhill LA. 2018. Cut loose and run: the complex role of ADAM proteases during neural crest cell development. Genesis 56: e23095 10.1002/dvg.23095 - DOI - PMC - PubMed
    1. Ay F, Bailey TL, Noble WS. 2014. Statistical confidence estimation for Hi-C data reveals regulatory chromatin contacts. Genome Res 24: 999–1011. 10.1101/gr.160374.113 - DOI - PMC - PubMed
    1. Balbás-Martínez C, Sagrera A, Carrillo-de-Santa-Pau E, Earl J, Márquez M, Vazquez M, Lapi E, Castro-Giner F, Beltran S, Bayés M, et al. 2013. Recurrent inactivation of STAG2 in bladder cancer is not associated with aneuploidy. Nat Genet 45: 1464–1469. 10.1038/ng.2799 - DOI - PMC - PubMed
    1. Benedetti L, Cereda M, Monteverde L, Desai N, Ciccarelli FD. 2017. Synthetic lethal interaction between the tumour suppressor STAG2 and its paralog STAG1. Oncotarget 8: 37619–37632. 10.18632/oncotarget.16838 - DOI - PMC - PubMed
    1. Bisht KK, Daniloski Z, Smith S. 2013. SA1 binds directly to DNA through its unique AT-hook to promote sister chromatid cohesion at telomeres. J Cell Sci 126: 3493–3503. 10.1242/jcs.130872 - DOI - PMC - PubMed

Publication types