. 2020 Apr 21;117(16):9082-9093.
doi: 10.1073/pnas.2000208117. Epub 2020 Apr 6.

A dual effect of ursolic acid to the treatment of multiple sclerosis through both immunomodulation and direct remyelination

Affiliations

A dual effect of ursolic acid to the treatment of multiple sclerosis through both immunomodulation and direct remyelination

Yuan Zhang et al. Proc Natl Acad Sci U S A. .

Abstract

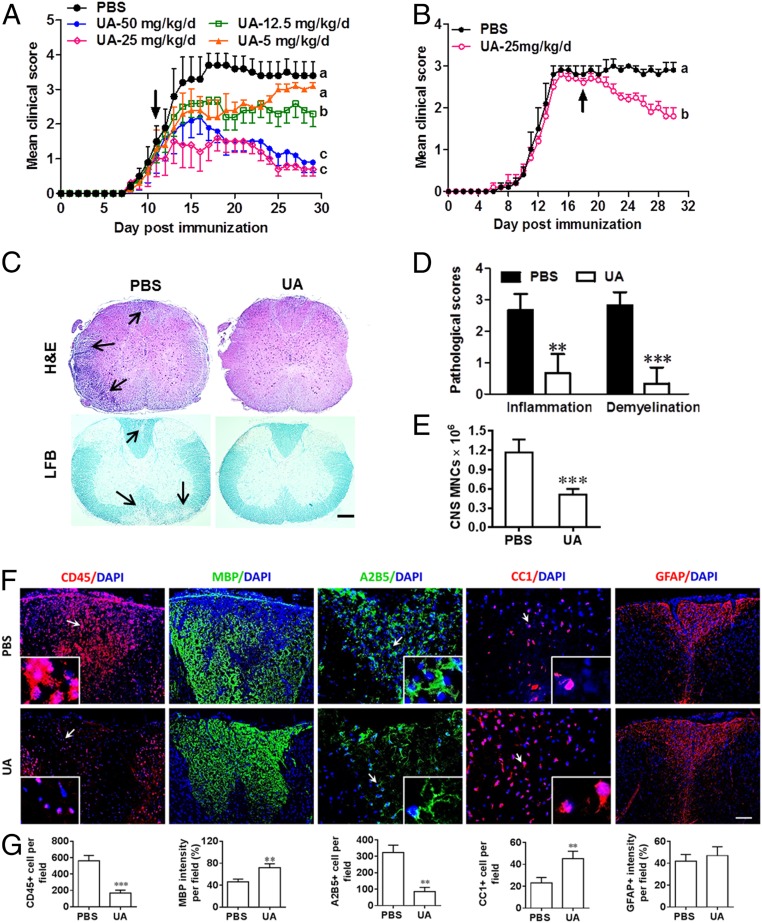
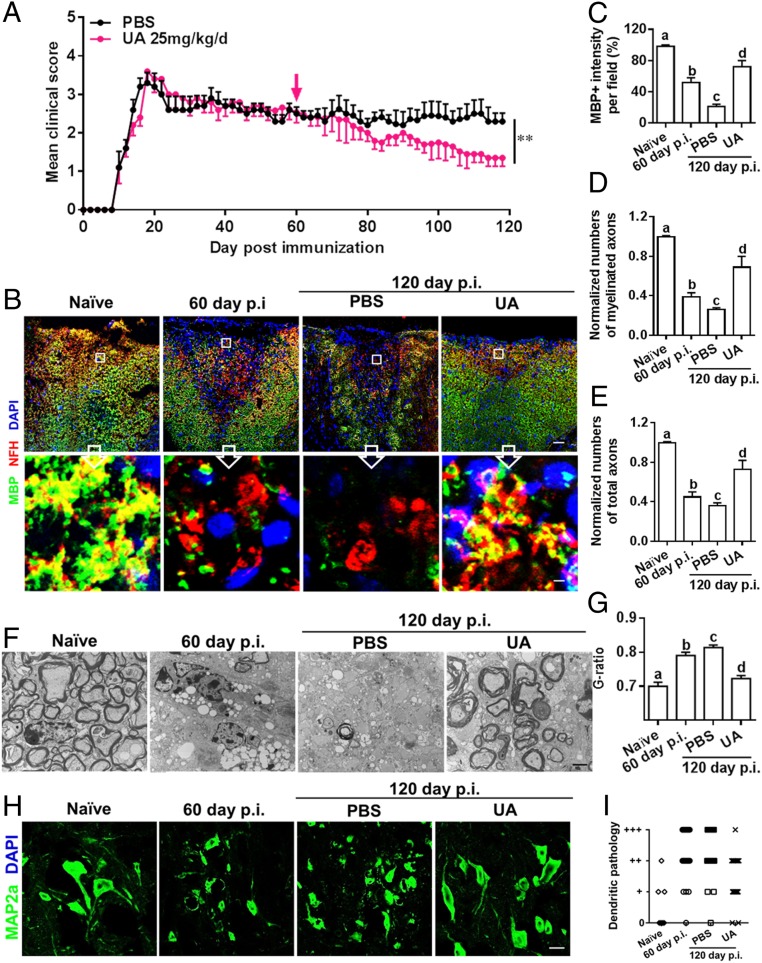
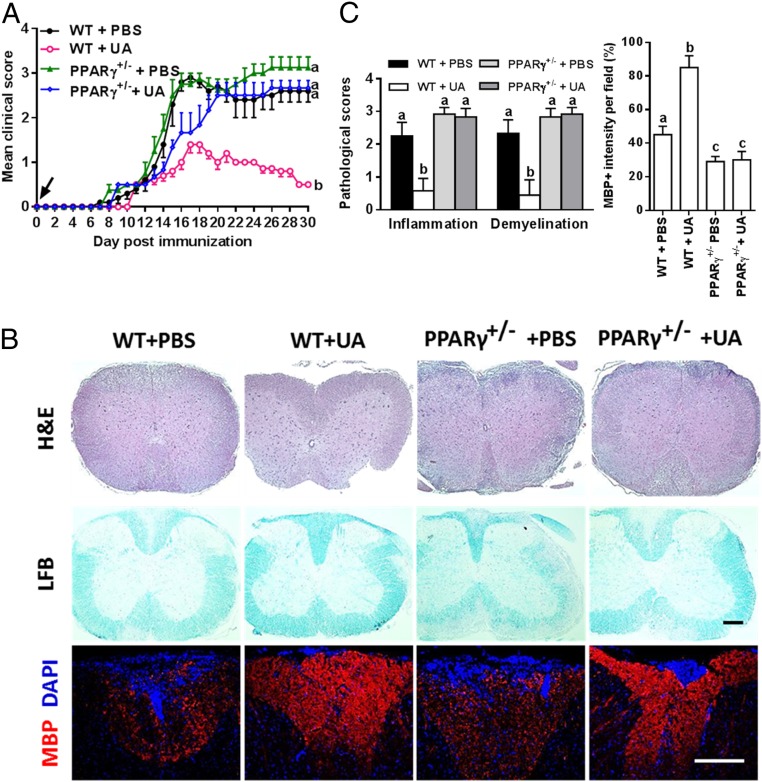
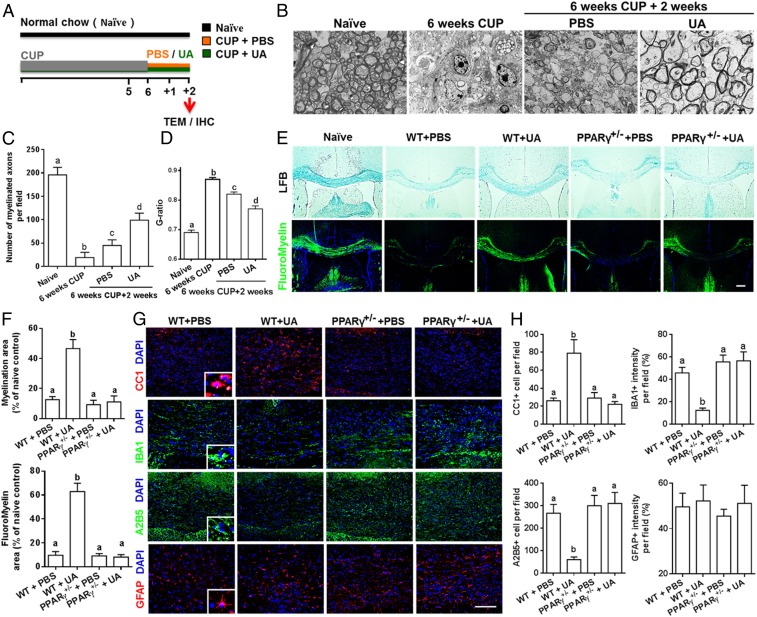
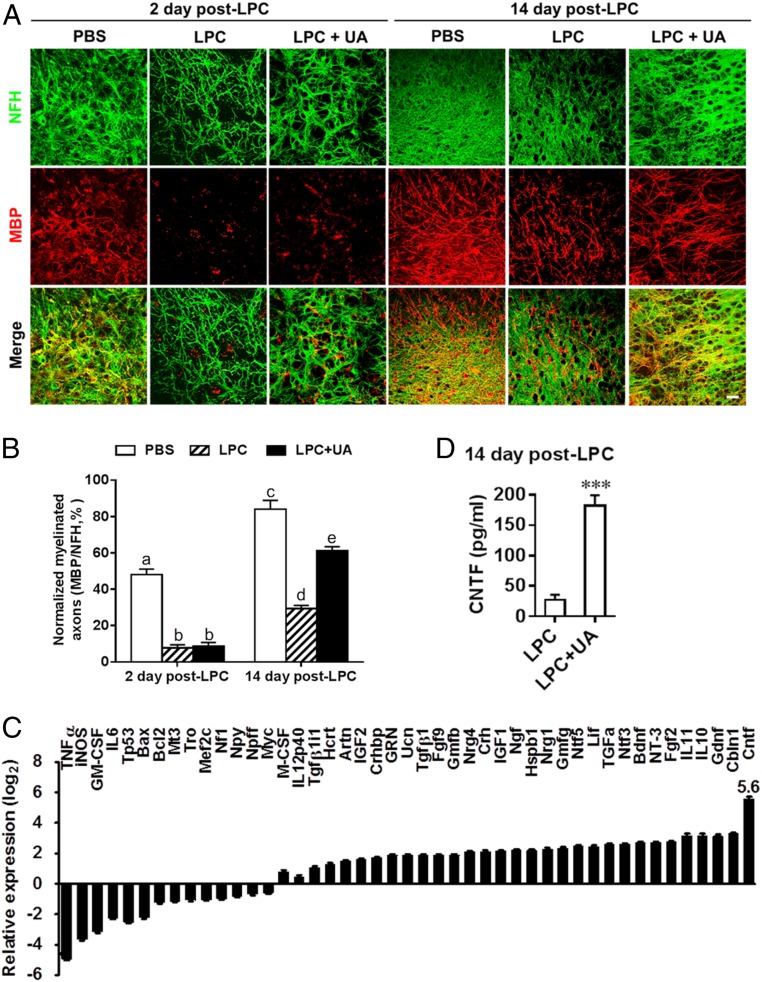
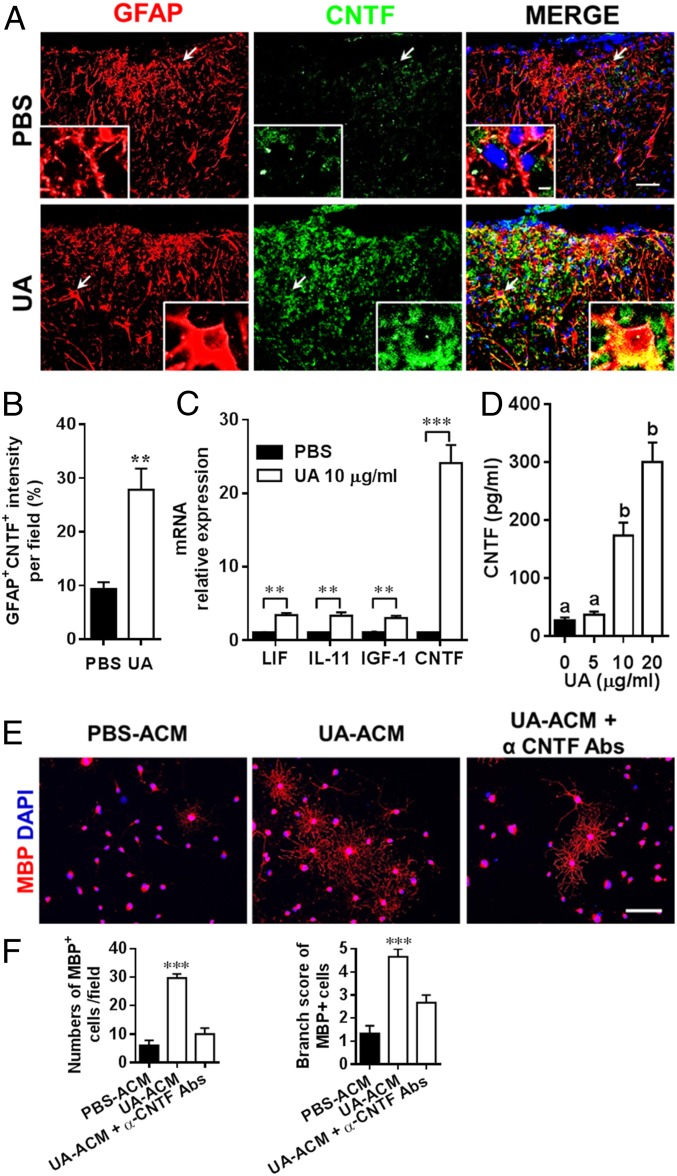
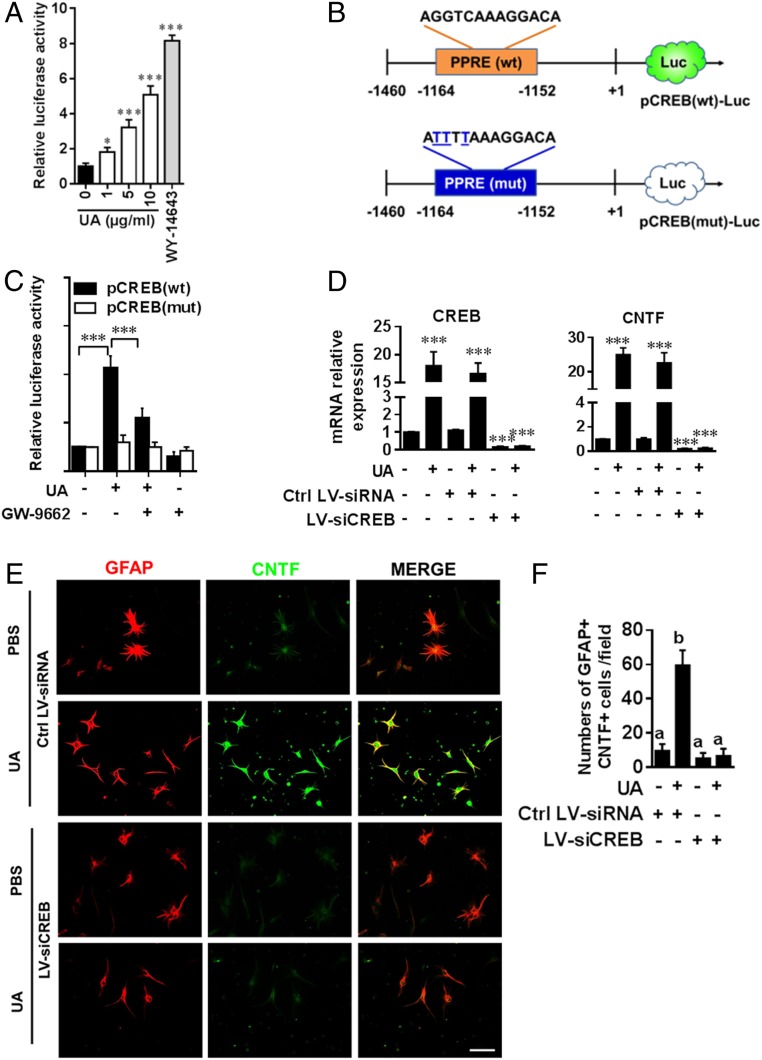
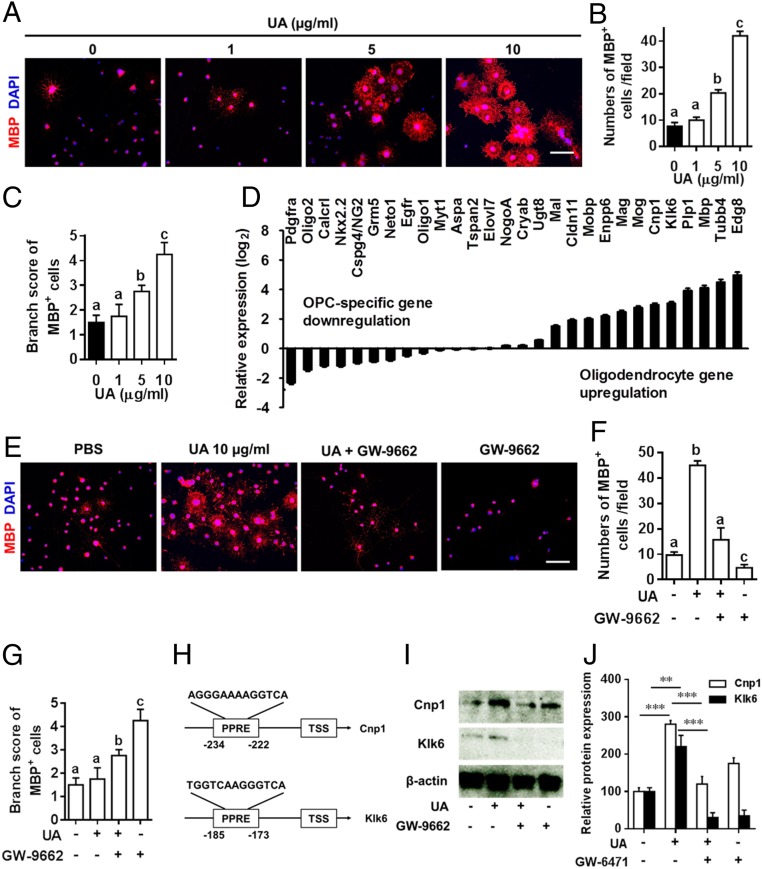
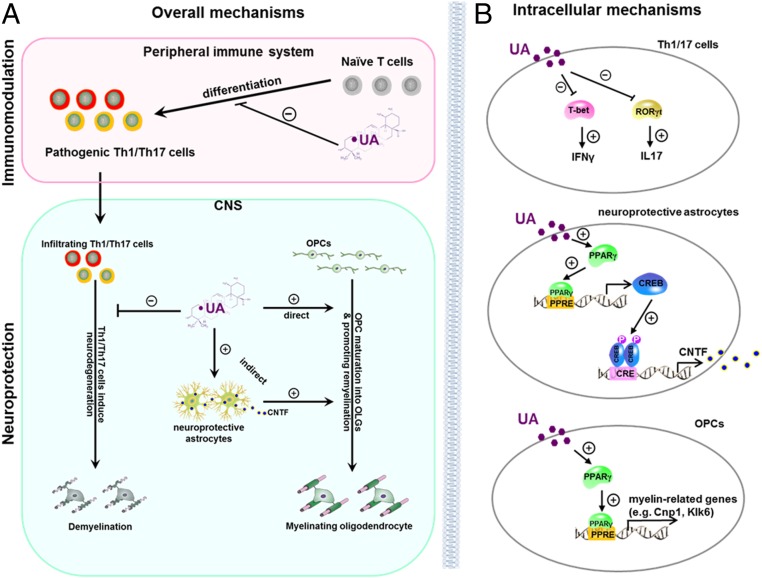
Current multiple sclerosis (MS) medications are mainly immunomodulatory, having little or no effect on neuroregeneration of damaged central nervous system (CNS) tissue; they are thus primarily effective at the acute stage of disease, but much less so at the chronic stage. An MS therapy that has both immunomodulatory and neuroregenerative effects would be highly beneficial. Using multiple in vivo and in vitro strategies, in the present study we demonstrate that ursolic acid (UA), an antiinflammatory natural triterpenoid, also directly promotes oligodendrocyte maturation and CNS myelin repair. Oral treatment with UA significantly decreased disease severity and CNS inflammation and demyelination in experimental autoimmune encephalomyelitis (EAE), an animal model of MS. Importantly, remyelination and neural repair in the CNS were observed even after UA treatment was started on day 60 post immunization when EAE mice had full-blown demyelination and axonal damage. UA treatment also enhanced remyelination in a cuprizone-induced demyelination model in vivo and brain organotypic slice cultures ex vivo and promoted oligodendrocyte maturation in vitro, indicating a direct myelinating capacity. Mechanistically, UA induced promyelinating neurotrophic factor CNTF in astrocytes by peroxisome proliferator-activated receptor γ(PPARγ)/CREB signaling, as well as by up-regulation of myelin-related gene expression during oligodendrocyte maturation via PPARγ activation. Together, our findings demonstrate that UA has significant potential as an oral antiinflammatory and neural repair agent for MS, especially at the chronic-progressive stage.

Keywords: immunomodulation; multiple sclerosis; neural repair; ursolic acid.


Conflict of interest statement

The authors declare no competing interest.

Figures

Fig. 1.
Fig. 1.
Oral UA effectively ameliorates acute CNS autoimmunity. Female, 8- to 10-wk-old C57BL/6J mice were immunized with MOG35–55 and treated with PBS and different doses of UA (Sigma-Aldrich, St. Louis) by oral gavage daily, starting on day 11 p.i. (onset, A) or day 18 p.i. (peak, B). Disease was scored daily on a 0 to 5 scale. Thoracic spinal cord sections of EAE mice were analyzed by immunohistochemistry at different stages of the disease before (days 10 and 18 p.i.) or after treatment (day 30 p.i.). (C) Sections (lumbar spinal cord) were assayed for inflammation by hematoxylin and eosin (H&E) and demyelination by Luxol fast blue (LFB), and (D) CNS pathology was scored on a 0 to 3 scale. (E) Absolute number of MNCs in cell suspension of each spinal cord was counted. (F) Immunohistochemistry on spinal cord sections of PBS- and UA-treated EAE mice in the dorsal funiculus. Dorsal column at the thoracic spinal cord is shown as representative images. (G) Quantitative analysis of CD45, MBP, A2B5, and CC1 expression using Image-Pro. The measured areas included 8 to 10 fields and cover virtually all of the white matter of the spinal cord. Groups designated by the same letter are not significantly different, while those with different letters (a, b, or c) are significantly different, Student’s t test. **P < 0.01, ***P < 0.001, compared to PBS-treated group, one-way ANOVA with Tukey’s multiple comparisons test. All quantifications were made from three independent experiments. Symbols represent mean ± SD; n = 5 to 8 mice in each group. (Scale bar, 100 µm in C; 40 µm in F; and 1 µm in the Insets.)
Fig. 2.
Fig. 2.
UA treatment alleviates chronic EAE, promotes remyelination, and reduces axon degeneration and neuron dendrite disruption. Female, 8- to 10-wk-old C57BL/6J mice were immunized with MOG35–55 and treated with PBS or UA (25 mg/kg/d) by oral gavage daily, starting on day 60 p.i. (late stage of chronic EAE). (A) Disease was scored daily on a 0 to 5 scale (mean ± SD; n = 6 to 10 each group). Lumbar spinal cords of naive and EAE mice were harvested before (day 60 p.i.) or after treatment (day 120 p.i.). (B) Double immunostaining of MBP (green) and NFH (red; for axons) showing significantly increased numbers of myelinated axons in the dorsal column of the spinal cord (MBP+NFH+). (Scale bar, 20 µm for the Upper row, and 1 µm for the Insets in the Lower row). (C) MBP intensity was measured in the white matter of spinal cord using Image-Pro. (D) Quantification of myelinated axons (MBP+NFH +) using Image-Pro. (E) Total axons (NFH +) were quantified using Image-Pro. (F) Electron micrographs for tissues of ventral lumbar spinal cords of PBS- and UA-treated EAE mice. (Scale bar, 2 µm.) (G) Quantification of the G-ratio (axon diameter/fiber diameter) of myelinated fibers in the ventral lumbar spinal cords of vehicle- and UA-treated EAE mice (PBS group, G-ratio = 0.8136 ± 0.006856; UA group, G-ratio = 0.7225 ± 0.008690). (H) MAP2a (green; dendrite marker) immunostaining at lumbar anterior horns of PBS- and UA-treated mice. (Scale bar, 10 µm.) (I) Scoring of MAP2a+ neuron dendritic disruption of different groups following a previously described protocol (16). A score of 0 (normal) was assigned when most or all neuron dendrites were of normal thickness and length. A score of “+” was assigned when the majority of neuron dendrites were thinner than normal, a score of “++” when the majority of neuron dendrites were shortened or fragmented, and a score of “+++” when the majority of neuron dendrites were lost. Groups designated by the same letter are not significantly different, while those with different letters (a, b, c, or d) are significantly different (P < 0.05 to 0.01), one-way ANOVA with Tukey’s multiple comparisons test. **P < 0.01, compared to PBS-treated group, one-way ANOVA with Tukey’s multiple comparisons test. All quantifications were made in three independent experiments. Symbols represent mean ± SD; n = 10 random areas per group.
Fig. 3.
Fig. 3.
The therapeutic effect of UA on CNS autoimmunity is PPARγ dependent. (A) Clinical score of UA- or PBS-treated WT (PPARγ+/+) or PPARγ+/− mice (C57BL/6J background). (B) Sections (lumbar) were assayed for inflammation by H&E, demyelination by LFB, and MBP expression by immunostaining. Dorsal column at the thoracic spinal cord is shown as representative images. (C) CNS pathology was scored on a 0 to 3 scale, and MBP intensity was measured in the white matter of spinal cord using Image-Pro. The measured areas included 8 to 10 fields and covered virtually all of the white matter of the spinal cord. Groups designated by the same letter are not significantly different, while those with different letters (a, b, or c) are significantly different (P < 0.05–0.01). All quantifications were made from three independent experiments. Symbols represent mean ± SD; n = 5 to 8 mice per group. (Scale bar, 100 µm in B.)
Fig. 4.
Fig. 4.
UA enhances remyelination in cuprizone-induced demyelination in a PPARγ-dependent manner. (A) Treatment paradigms. Male, 8- to 10-wk-old C57BL/6J mice were fed with cuprizone (CUP) for 6 wk to achieve complete demyelination, followed by feeding PBS or UA (25 mg/kg/d) for another 2 wk. (B) Representative electron microscopy images of the corpus callosum region isolated from cuprizone-fed mice treated with UA or PBS for 2 wk. (C) Quantification of the myelinated axons. (D) Quantification of the G-ratios (axon diameter/fiber diameter) of myelinated fibers. (E) Representative LFB and FluoroMyelin stains in the body of the corpus callosum of UA- or PBS-treated WT or PPARγ+/− mice at 2 wk after cuprizone withdrawal. (F) Quantitative analysis of myelinated and fluoromyelinated areas measured in the body of the corpus callosum using Image Pro software. (G) Immunohistochemistry on corpus callosum sections of UA- or PBS-treated WT or PPARγ+/− mice at 2 wk after cuprizone withdrawal. (H) Quantitative analysis of GFAP, IBA1, A2B5, and CC1 expression using Image-Pro. Groups designated by the same letter are not significantly different, while those with different letters (a, b, c, or d) are significantly different (P < 0.05 to 0.01), one-way ANOVA with Tukey’s multiple comparisons test. All quantifications were made from three independent experiments. Symbols represent mean ± SD; n = 5 to 8 mice each group. (Scale bar, 2 µm in B, 100 µm in E, and 20 µm in G.)
Fig. 5.
Fig. 5.
UA enhances remyelination following LPC demyelination of organotypic cerebellar slices. Cerebellar slices from postnatal day 1 to 2 mouse pups were cultured for 6 d and then demyelinated using LPC for 16 h. Cultures were then allowed to remyelinate over the next 2 or 14 d in the presence or absence of UA (10 µg/mL), after which remyelination was assessed using specific antibodies. (A) Representative confocal images of slices at days 2 and 14 post LPC-induced demyelination, immunostained against axons (NFH; green) and myelin (MBP; red). (Scale bar, 20 µm.) (B) Quantification of myelinated axons by the alignment of axonal and myelin markers. (C) Expression of neurotrophin genes of organotypic slice cultures treated with vehicle (LPC group) or UA (LPC + UA group) at day 14 post LPC was determined using Custom RT2 Profiler PCR Array (Qiagen, Valencia, CA). (D) Supernatants of organotypic slice cultures treated with vehicle (LPC group) or UA (10 µg/mL, LPC + UA group) at day 14 post LPC were analyzed by ELISA for the level of CNTF. Data are shown as mean values ± SD (n = 5 to 6 per group) and are representative of three experiments. Groups designated by the same letter are not significantly different, while those with different letters are significantly different (P < 0.05 to 0.001), ***P < 0.001, compared to untreated group, one-way ANOVA with Tukey’s multiple comparisons test.
Fig. 6.
Fig. 6.
CNTF secreted by UA-treated astrocytes enhances OPC differentiation in vitro. EAE mice were treated with UA or PBS as shown in Fig. 3A. (A) Thoracic spinal cord sections of EAE mice were analyzed by double immunostaining of GFAP (red) and CNTF (green). (Arrows indicated the area of the inset. Scale bar, 20 µm.) (B) GFAP+ and CNTF+ intensity was measured in the white matter of spinal cord using Image-Pro. (C) Primary mouse astrocytes isolated from 2- to 3-d-old pups were cultured in six-well cell culture plates or glass slide chambers. After 24 h, cells were treated with UA at indicated concentrations. mRNA relative expression of LIF, IL-11, IGF1, and CNTF in astrocytes treated with UA (10 µg/mL) for 6 h was detected by real-time PCR. (D) After 72 h of UA treatment, the protein level of CNTF in the supernatants was assayed by ELISA. (E) Supernatants from UA-treated astrocytes enhanced OPC differentiation. OPCs (5,000 cells/cm2) were cultured in differentiation medium for 3 d, and half of the medium was replaced by culture supernatants (astrocyte-conditioned media) of astrocytes treated with UA (UA-ACM) or PBS (PBS-ACM) in the presence or absence of CNTF-neutralizing antibodies (α-CNTF-Abs) for another 4 d. Mature oligodendrocytes are identified by the specific marker MBP (red). (Scale bar, 50 µm.) One of five representative experiments is shown. (F) Quantitative analysis was performed for numbers or branch score of MBP+ mature oligodendrocytes. Data are shown as mean values ± SD (n = 5 to 6 per group) and are representative of three independent experiments. Groups designated by the same letter are not significantly different, while those with different letters are significantly different (P < 0.05–0.001). **P < 0.01, ***P < 0.001, compared to control group, one-way ANOVA with Tukey’s multiple comparisons test.
Fig. 7.
Fig. 7.
UA induces astroglial CNTF production via PPARγ/CREB signaling. (A) Astrocytes were transfected with tk-PPRE ×3-Luc (Addgene plasmid #1015), a PPRE-dependent luciferase reporter construct. pRLTK, a plasmid encoding Renilla luciferase, was used as transfection efficiency control. After 24 h of transfection, cells were cultured with different concentrations of UA (0, 1, 5, and 10 µg/mL) for 6 h, and activity of firefly and Renilla luciferase was monitored in cell lysates by a Dual-Glo Luciferase Assay kit (Promaga). Data were normalized to an internal control Renilla luciferase (n = 8). (B) Map of wild-type and mutated CREB promoter constructs. (C) Astrocytes were transfected with pCREB(mut) and pCREB(wt) for 24 h followed by treatment with UA (10 µg/mL) or GW-9662 (10 nM) alone and in combination and subjected to luciferase assay. (D) CREB and CNTF expression in astrocytes transfected with CREB-specific or control LV-siRNAs overnight in the presence or absence of UA (10 µg/mL) was detected by real-time PCR. (E) Primary mouse astrocytes isolated from 2- to 3-d-old pups were cultured in glass slide chambers. Double labeling of astrocytes for GFAP and CNTF was performed under indicated treatment: PBS, UA (10 µg/mL) or UA + LV-siCREB/LV-siRNA. (Scale bar, 50 µm.) One of five representative experiments is shown. (F) Quantitative analysis was performed for numbers of GFAP+CNTF+ cells. Data are shown as mean values ± SD (n = 5 to 6 per group) and are representative of three experiments. Groups designated by the same letter are not significantly different, while those with different letters are significantly different (P < 0.05 to 0.001), *P < 0.05, ***P < 0.001, compared to control group, one-way ANOVA with Tukey’s multiple comparisons test.
Fig. 8.
Fig. 8.
UA directly induced OPC differentiation and myelin-related gene expression via PPARγ. (A) UA enhanced oligodendrocyte differentiation in primary OPC cultures. Primary OPCs, prepared from newborn C57BL/6J mouse brains, were cultured in differentiation medium with or without UA (1 to 10 µg/mL) for 5 to 7 d, followed by MBP immunofluorescence staining. Nuclei were stained with DAPI (blue). One of five representative experiments is shown. (Scale bar, 50 µm.) Quantitative analysis was performed for numbers (B) or branch score (C) of MBP+ mature oligodendrocytes. (D) Expression of known genes associated with OPC maturation and myelination. Primary OPCs were cultured in differentiation medium for 5 d with or without UA (10 µg/mL), and OPC/oligodendrocyte-related genes were determined using Custom RT2 Profiler PCR Array (Qiagen, Valencia, CA). (E) Primary OPCs were cultured in differentiation medium with UA (10 µg/mL) alone or pretreated for 30 min with GW-9662 (PPARγ-specific antagonist) before addition of UA, or GW-9662 (10 nM) alone, for 7 d followed by MBP immunofluorescence staining. Nuclei were stained with DAPI (blue). One of five representative experiments is shown. (Scale bar, 50 µm.) Quantitative analysis was performed for numbers (F) or branch score (G) of MBP+ mature oligodendrocytes. (H) Position of PPREs in the promoters of mouse Cnp1 and Klk6. TSS: transcription start site. (I) Cnp1 and Klk6 expression in OPCs treated with UA and/or GW-9662 was detected by Western blot with specific antibodies. (J) Protein expression was standardized using β-actin as a sample loading control; quantification is presented in each panel. Data are shown as mean values ± SD (n = 5 to 6 per group) and are representative of three experiments. Groups designated by the same letter are not significantly different, while those with different letters are significantly different (P < 0.05 to 0.001). **P < 0.01, ***P < 0.001, compared to control group, one-way ANOVA with Tukey’s multiple comparisons test.
Fig. 9.
Fig. 9.
Model of UA-mediated immunomodulation and neuroregeneration effects in EAE. (A) Extracellular effects of UA treatment in the periphery and CNS. In the periphery, UA inhibits Th1/Th17 cell differentiation and decreases Th1/Th17 cell infiltration in the CNS. In the CNS, UA reduces inflammation and demyelination and promotes OPC maturation and remyelination via direct and indirect mechanisms. (B) Intracellular mechanisms of UA effects on Th1/Th17 cells, astrocytes, and OPCs. During T cell differentiation, UA suppresses IFN-γ and IL-17 production by antagonizing the functions of T-bet and RORγt. In astrocytes, UA activates PPARγ, which was recruited to PPRE of CREB promoter and leads to the transcription of CREB. CREB then binds to the CRE site of CNTF promoter to promote expression of CNTF. Activated astrocytes under UA treatment release CNTF, an important neurotrophic factor for OPC differentiation with strong promyelination effect. UA induces CNTF expression in astrocytes that favor the beneficial outcome of reactive astrogliosis and are thus considered neuroprotective. Furthermore, UA directly induces OPC differentiation by activated PPARγ, which binds to PPRE of promoters and leads to expression of different myelin-related genes such as Cnp1 and Klk6.

Similar articles

Cited by

References

    1. Tintore M., Vidal-Jordana A., Sastre-Garriga J., Treatment of multiple sclerosis: Success from bench to bedside. Nat. Rev. Neurol. 15, 53–58 (2019). - PubMed
    1. Correale J., Gaitán M. I., Ysrraelit M. C., Fiol M. P., Progressive multiple sclerosis: From pathogenic mechanisms to treatment. Brain 140, 527–546 (2017). - PubMed
    1. Cunniffe N., Coles A., Promoting remyelination in multiple sclerosis. J. Neurol., 10.1007/s00415-019-09421-x (2019). - DOI - PMC - PubMed
    1. Stangel M., Kuhlmann T., Matthews P. M., Kilpatrick T. J., Achievements and obstacles of remyelinating therapies in multiple sclerosis. Nat. Rev. Neurol. 13, 742–754 (2017). - PubMed
    1. Goldman S. A., Nedergaard M., Windrem M. S., Glial progenitor cell-based treatment and modeling of neurological disease. Science 338, 491–495 (2012). - PMC - PubMed

Publication types

MeSH terms