. 2020 Jun 10;40(24):4622-4643.
doi: 10.1523/JNEUROSCI.2339-19.2020. Epub 2020 Apr 6.

Similar Microglial Cell Densities across Brain Structures and Mammalian Species: Implications for Brain Tissue Function

Affiliations

Similar Microglial Cell Densities across Brain Structures and Mammalian Species: Implications for Brain Tissue Function

Sandra E Dos Santos et al. J Neurosci. .

Abstract

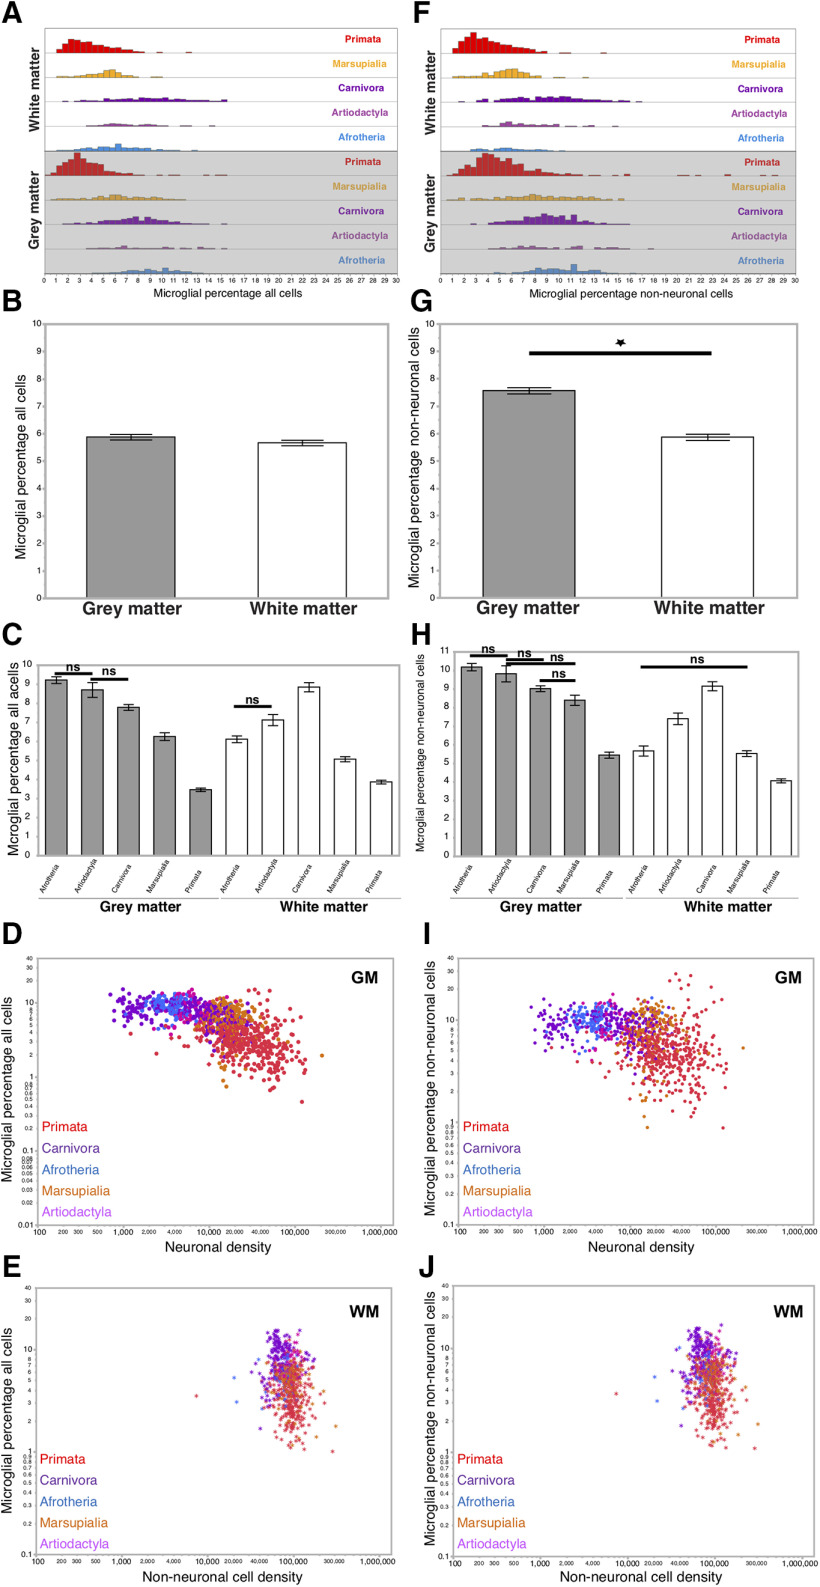
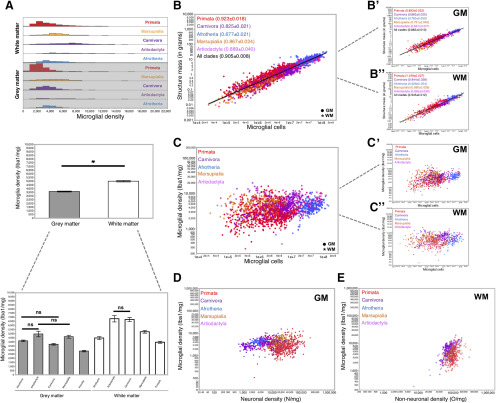
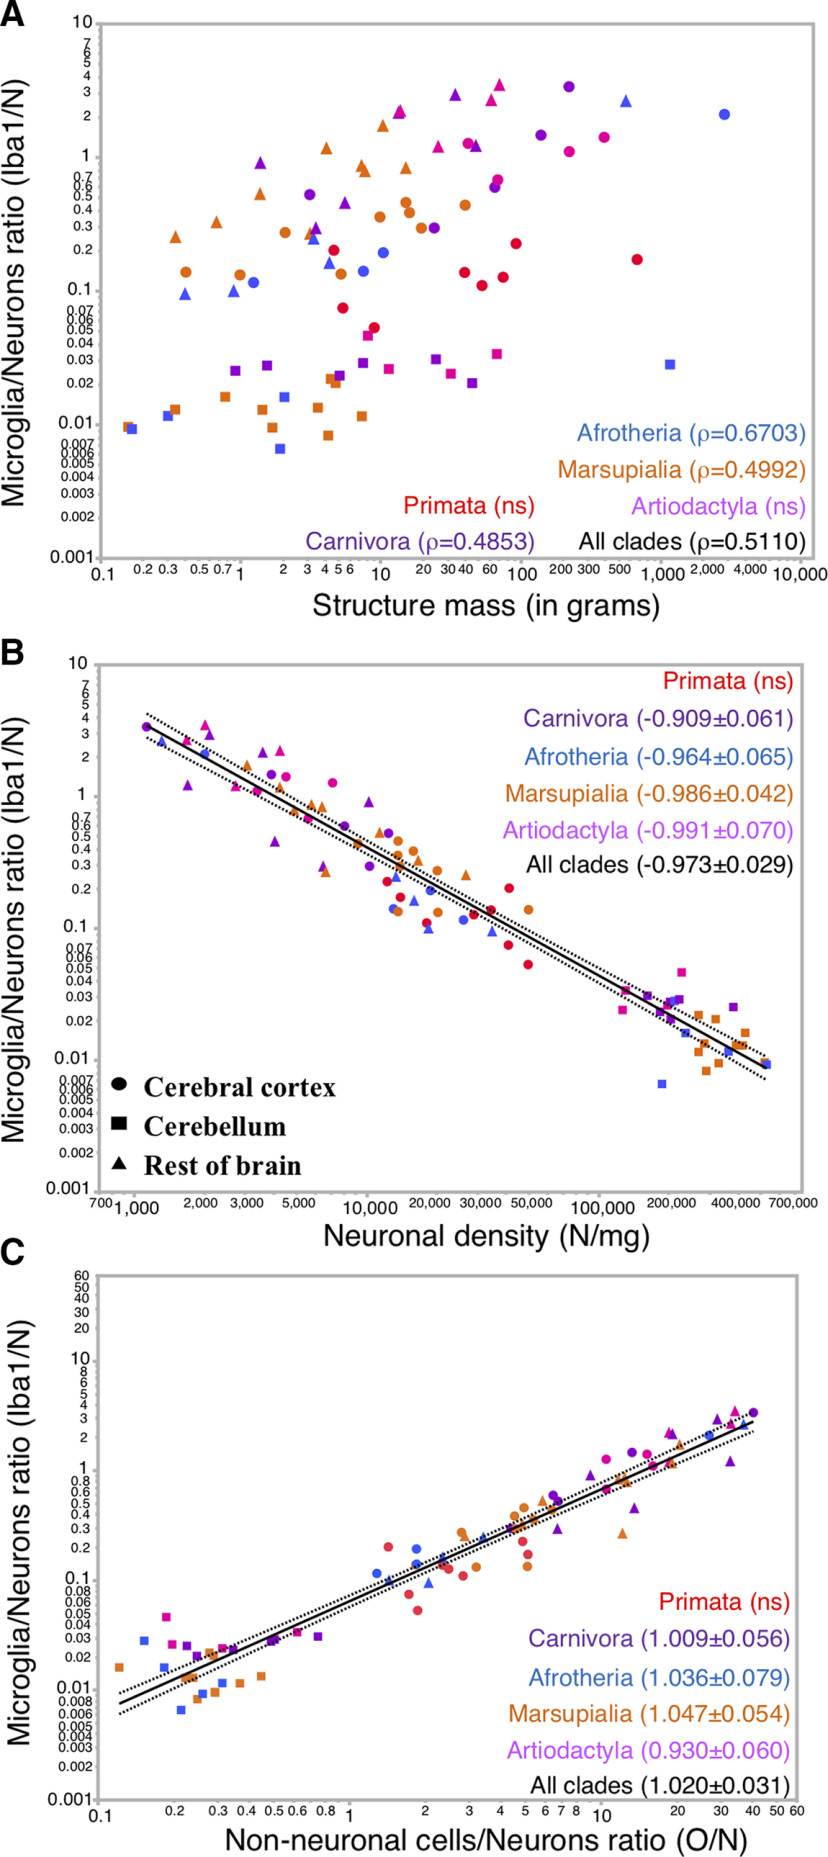
Microglial cells play essential volume-related actions in the brain that contribute to the maturation and plasticity of neural circuits that ultimately shape behavior. Microglia can thus be expected to have similar cell sizes and even distribution both across brain structures and across species with different brain sizes. To test this hypothesis, we determined microglial cell densities (the inverse of cell size) using immunocytochemistry to Iba1 in samples of free cell nuclei prepared with the isotropic fractionator from brain structures of 33 mammalian species belonging to males and females of five different clades. We found that microglial cells constitute ∼7% of non-neuronal cells in different brain structures as well as in the whole brain of all mammalian species examined. Further, they vary little in cell density compared with neuronal cell densities within the cerebral cortex, across brain structures, across species within the same clade, and across mammalian clades. As a consequence, we find that one microglial cell services as few as one and as many as 100 neurons in different brain regions and species, depending on the local neuronal density. We thus conclude that the addition of microglial cells to mammalian brains is governed by mechanisms that constrain the size of these cells and have remained conserved over 200 million years of mammalian evolution. We discuss the probable consequences of such constrained size for brain function in health and disease.SIGNIFICANCE STATEMENT Microglial cells are resident macrophages of the CNS, with key functions in recycling synapses and maintaining the local environment in health and disease. We find that microglial cells occur in similar densities in the brains of different species and in the different structures of each individual brain, which indicates that these cells maintain a similar average size in mammalian evolution, suggesting in turn that the volume monitored by each microglial cell remains constant across mammals. Because the density of neurons is highly variable across the same brain structures and species, our finding implies that microglia-dependent functional recovery may be particularly difficult in those brain structures and species with high neuronal densities and therefore fewer microglial cells per neuron.

Keywords: cell density; cell numbers; comparative; evolution; microglia.


Figures

Figure 1.
Figure 1.
Immunostaining of the microglial Iba1 marker on mammalian cortical tissue sections. Coronal 50-μm-thick sections of the Cx of two marsupial species (D. aurita in A and M. rufogriseus in B), two primate species (O. garnettii in C and A. trivirgatus in D), two afrotherian species (L. africana in E and E. myurus in F), two carnivoran species (M. putorius furo in G and F. catus in H), and two artiodactyl species (A. marsupialis in I and S. scrofa domesticus in J) are shown at 63× magnification with all cell nuclei stained with DAPI (blue) and microglial cells stained for Iba1 (green). Scale bar, 50 μm.
Figure 2.
Figure 2.
Average percentages of PI microglial cells represent 6% of all cortical cells in gray and white matter and correlate only slightly with neuronal and non-neuronal cell densities. A, Distribution of the percentage of all cortical cells that are microglial cells in the gray and white matter per clade. The ranges of distribution and means of the percentage of all cortical cells that are microglia are similar across clades within the cortical gray matter (values in Table 2). B, Average percentages of total cells that are microglia across clades and species represent a constant ∼6% in both cortical gray and white matter. Wilcoxon p = 0.2650 between gray and white matter in all mammalian species. C, Average percentages of total cells that are microglia in gray and white matter across clades and species. In the gray matter, significant differences are found across all pairs of clades (Wilcoxon, p < 0.0001), except between Artiodactyla and both Afrotheria (Wilcoxon, p = 0.1000; nonsignificant) and Carnivora (Wilcoxon, p = 0.0963). In the white matter, significant differences are found across all pairs of clades (p < 0.01 for all pairs), except between Artiodactyla and Afrotheria (p = 0.0121). For each clade individually, we find significant differences in the percentage of all cells that are microglial between white and gray matter samples (Wilcoxon p < 0.0001 for Afrotheria and Marsupialia; p = 0.0037 for Artiodactyla; p = 0.0004 for Carnivora and Primata). D, Percentages of microglial cells among all cells in the gray matter fail to correlate systematically with the neuronal cell density in the sample. Spearman ρ and p values for each clade are given in Table 2. E, Percentages of microglial cells among all cells in the white matter fail to correlate systematically with the non-neuronal cell density in the sample. Spearman ρ and p values for each clade are given in Table 2. F, Distribution of the percentage of cortical non-neuronal cells that are microglial cells in the gray and white matter per clade. Ranges and means are listed in Table 3. G, Microglia are a larger average percentage of all non-neuronal cells in cortical gray matter (7.56 ± 0.11%) than in the white matter (5.86 ± 0.13%, Wilcoxon p < 0.0001). H, Average percentages of non-neuronal cells that are microglia in gray and white matter across clades and species. In the gray matter, significant differences are found across all pairs of clades (Wilcoxon, p < 0.01 for all clades), except between Artiodactyla and Afrotheria, Marsupialia, and Carnivora (p = 0.2645, p = 0.0240, and 0.2106, respectively) and between Marsupialia and Carnivora (p = 0.0837). In the white matter, significant differences are found across all pairs of clades (Wilcoxon, p = 0.0002 between Artiodactyla and Afrotheria; and p < 0.0001 for all other pairs), except between Afrotheria and Marsupialia (p = 0.8582). I, Percentages of microglial cells among non-neuronal cells in the gray matter do not correlate systematically with the non-neuronal cell density in the sample. Spearman correlation ρ and p values are given in Table 3. J, Percentages of microglial cells among non-neuronal cells in the white matter do not correlate systematically with the neuronal cell density in the sample. Spearman correlation ρ and p values are given in Table 3. D, E, I, J, Each data point represents the values found per cortical site examined for each species colored by clade as in the key. Filled circles represent cortical gray matter sites of the Cx, including the hippocampus. *White matter sites. G, *Significance.
Figure 3.
Figure 3.
Little variation of microglial density in cortical gray and white matter. A, Distribution of microglial density in the cortical gray and white matter at individual sites per clade (top), average across all samples (middle), and average per clade (bottom). Values are given in Table 4. Average microglial densities in gray matter cortical sites differ significantly across clades at the p < 0.01 level, except between Artiodactyla and Afrotheria (Wilcoxon, p = 0.1877; not significant), Afrotheria and Marsupialia (p = 0.0442), and Artiodactyla and Marsupialia (p = 0.7454), and in the white matter, between Artiodactyla and Carnivora (p = 0.8260). Differences in microglial cell density between white and gray matter are significant (Wilcoxon p < 0.01) in all clades (see Table 4), except Afrotheria (p = 0.2835) and Marsupialia (p = 0.0151). B, Relationship between structure mass and number of microglial cells across cortical sites and mammalian species. C, Function plotted applies to all species and gray and white matter together with exponent (0.905 ± 0.008, p < 0.0001, r2 = 0.878). B′, B′′, This same relationship for gray (B′) and white (B′′) matter sites separately. Spearman correlations, p values, and other fit values in each clade and species are listed in Table 4. C, Relationship between the density of microglial cells and the number of microglial cells across cortical sites and mammalian species. C′, C′′, This same relationship for gray (C′) and white (C′′) matter sites separately. Spearman correlation ρ and p values are given in Table 4. D, Relationship between microglial density and neuronal cell density across cortical gray matter sites and mammalian species. Spearman coefficients and p values as well as exponents and p values for each clade and species are listed in Table 4. E, Relationship between microglial density and non-neuronal density across cortical white matter sites and mammalian species. Spearman coefficients and p values as well as exponents and p values for each clade and species are listed in Table 4. B, B′, B′′, C, C′, C′′, D, E, Each data point represents the values found per cortical site examined for each species colored by clade as in the key. Filled circles represent cortical gray matter sites of the Cx, including the hippocampus (GM). *White matter sites (WM). A, *Significance.
Figure 4.
Figure 4.
Microglia/neuron ratio varies uniformly with neuronal density, but not with microglial density across cortical gray matter sites. A, Non-neuronal cells/neuron ratio (O/N) is plotted as a function of neuronal density in the gray matter sites across species and clades. p value for Spearman correlation for all clades together is p < 0.0001. Exponent, p value, and r2 for the relationship plotted in A (−0.793 ± 0.009, p < 0.0001, 0.888). B, Microglia/neuron ratio is plotted as a function of neuronal density in the gray matter sites across species and clades. p values for Spearman correlations are all p < 0.0001, except for Artiodactyla (p = 0.1819). The power function plotted in B applies to all gray matter sites together and mammalian species with exponent (−1.020 ± 0.016, p < 0.0001, r2 = 0.799). Exponents and p values for each clade and species are listed in Table 4. C, Microglia/neuron ratio is plotted as a function of microglial density in the gray matter sites across species and clades. p values for Spearman correlations are as follows: p < 0.0001 for all clades together and each clade separately except for Carnivora (p = 0.8414). Exponents and p values for each clade and species are listed in Table 4. Each data point represents the values found per cortical gray matter site examined for each species colored by clade as in the key.
Figure 5.
Figure 5.
Average percentages of microglial cells vary across brain structures but correlate with numbers of non-neuronal cells of which they represent a constant ∼7%. A, Distribution of the percentage of all cells that are microglial cells in the three main brain structures per clade. The ranges of distribution and means of the percentage of all cells that are microglia differ across clades and brain structures (values in Table 5). B, Average percentages of total cells that are microglia differ across brain structures. Wilcoxon p < 0.0001 between Cb and both Cx and RoB in all mammalian species. Wilcoxon p = 0.4283 between Cx and RoB in all mammalian species. C, Average percentages of total cells that are microglia in brain structures across clades and species. In the Cb, significant differences are found between Marsupialia and both Artiodactyla and Carnivora (Wilcoxon, p = 0.0058 and p = 0.0020, respectively). In the Cx and RoB, no significant differences are found between clades, Wilcoxon p values of all pairs being ≥0.01. Within clades, significant differences are also found between the Cb and the Cx and RoB for each clade, except Afrotheria and Artiodactyla: Carnivora, between Cb and Cx Wilcoxon p = 0.0081 and between Cb and RoB Wilcoxon p = 0.0051; and Marsupialia, between Cb and Cx Wilcoxon p = 0.0003 and between Cb and RoB Wilcoxon p = 0.0003. D, Percentages of microglial cells among all cells across all brain structures and species correlate strongly with the neuronal cell density in the sample. The power function plotted in D applies to brain structures together and mammalian species with exponent (−0.378 ± 0.028, p < 0.0001, r2 = 0.709). Spearman ρ values are indicated between brackets for each clade when significant (otherwise, indicated as nonsignificant) with respective p values falling to <0.01, except for Artiodactyla (p = 0.0386; nonsignificant) and Primata (p = 0.6932). E, Distribution of the percentage of non-neuronal cells that are microglial cells in the three main brain structures per clade. The ranges of distribution and means of the percentage of non-neuronal cells that are microglia are similar across clades and brain structures (values in Table 5). F, Average percentages of non-neuronal cells that are microglia represent a constant ∼7% across brain structures and clades in all mammalian species. Wilcoxon p values >0.01 for all pairs of structures. G, Average percentages of non-neuronal cells that are microglia in brain structures across clades and species. Across each structure, all Wilcoxon, p > 0.01. Within each structure across all clades, all Wilcoxon, p > 0.01. H, Percentages of microglial cells among non-neuronal cells across all brain structures and species fail to correlate significantly with the neuronal cell density in the sample. Spearman, all p values >0.01. D, H, Each data point represents the values found per brain structure examined for each species colored by clade as in the key. Filled circles represent the Cx (including the hippocampus). Squares represent the Cb. Triangles represent the RoB. B, C, *Significance.
Figure 6.
Figure 6.
Constant average microglial density across brain structures, mammalian clades, and species. A, Distribution of microglial density in the different brain structures per clade (top), average across all samples (middle), and average per clade (bottom). Values are given in Table 5. Densities vary 8.5-, 5.0-, and 5.3-fold across species in Cb, Cx, and RoB, respectively (top; values in Table 1). Invariant average microglial density across brain structures in all mammalian species together (middle; Wilcoxon p values >0.01 for each pair) and across mammalian clades (bottom; Wilcoxon p values across clades are >0.01 across brain structures and clades). B, Relationship between the density of microglial cells and the number of microglial cells across brain structures and mammalian species. p values for Spearman correlations when all structures are analyzed together, except for Primata, Cx only, are all >0.01. C, Relationship between structure mass and number of microglial cells across brain structures and mammalian species. Function plotted in C applies to all structures and species with exponent (0.962 ± 0.024, p < 0.0001, r2 = 0.952). p values for each clade separately are all p < 0.0001. p values for Spearman correlations all fall to <0.01. D, Relationship between microglial density and structure mass across brain structures and mammalian species. p values for Spearman correlations when all structures are analyzed together, except for Primata, Cx only, are all superior to 0.01. E, Relationship between microglial density and neuronal density across brain structures and mammalian species. p values for Spearman correlations when all structures are analyzed together, except for Primata, Cx only, are all nonsignificant (p > 0.01). D, E, Each data point represents the values found per brain structure examined for each species colored by clade as in the key. Filled circles represent the Cx (including the hippocampus). Squares represent the Cb. Triangles represent the RoB. C, Values are exponent ± SE.
Figure 7.
Figure 7.
Microglial cell/neuron ratio varies uniformly with neuronal density but not with structure mass across brain structures and mammalian species. Microglial cell/neuron ratio is plotted as a function of the brain structure mass (A), neuronal density (B), or non-neuronal cell/neuron ratio (C). A, p values for Spearman correlations when all structures are analyzed together, except for Primata, Cx only, fall below p < 0.01 for all clades together and individually, except for Carnivora (p = 0.0483; not significant), Primata (p = 0.3851), and Artiodactyla (p = 0.2453). Spearman p values when Cb is analyzed individually are nonsignificant, except when all clades are analyzed together (p = 0.0006). Spearman p values when Cx is analyzed individually are nonsignificant, except when all clades are analyzed together (p = 0. 0015) and for Afrotheria (p < 0.0001). Spearman p values when RoB is analyzed individually are nonsignificant, except when all clades are analyzed together (p < 0.0001). B, p values for Spearman correlations when all structures are analyzed together, except for Primata, Cx only, fall below p < 0.01 for all clades together and individually, except for Primata (p = 0.1600) and Artiodactyla (p = 0.0016). The power function plotted in B has an exponent of −0.973 ± 0.029 (p < 0.0001; r2 = 0.936) and applies to all mammalian species and brain structures. Exponents and p values for each clade individually are listed in Table 5. C, p values for Spearman correlations when all structures are analyzed together, except for Primata, Cx only, fall all below 0.01, except for Primata (p = 0.4198). The power function plotted in C has an exponent of 1.020 ± 0.031 (p < 0.0001; r2 = 0.932) and applies to all brain structures and mammalian species. All clades have a significant relationship, except Primata (p = 0.2252). Each data point represents the values found per brain structure examined for each species colored by clade as in the key. Filled circles represent the Cx, including the hippocampus. Squares represent the Cb. Triangles represent the RoB. B, C, Values are exponent ± SE.

Similar articles

Cited by

References

    1. Ali S, Liu X, Queen NS, Patel RS, Wilkins RK, Mo X, Cao L (2019) Long-term environmental enrichment affects microglial morphology in middle age mice. Aging 11:2388–2402. 10.18632/aging.101923 - DOI - PMC - PubMed
    1. Ashwell K. (1991) The distribution of microglia and cell death in the fetal rat forebrain. Dev Brain Res 58:1–12. 10.1016/0165-3806(91)90231-7 - DOI - PubMed
    1. Askew K, Li K, Olmos-Alonso A, Garcia-Moreno F, Liang Y, Richardson P, Tipton T, Chapman MA, Riecken K, Beccari S, Sierra A, Molnár Z, Cragg MS, Garaschuk O, Perry HV, Gomez-Nicola D (2017) Coupled proliferation and apoptosis maintain the rapid turnover of microglia in the adult brain. Cell Rep 18:391–405. 10.1016/j.celrep.2016.12.041 - DOI - PMC - PubMed
    1. Bininda-Emonds OR, Cardillo M, Jones KE, MacPhee RD, Beck R, Grenyer R, Price SA, Vos RA, Gittleman JL, Purvis A (2007) The delayed rise of present-day mammals. Nature 446:507–512. 10.1038/nature05634 - DOI - PubMed
    1. Braak H, Braak E, Bohl J (1993) Staging of Alzheimer-related cortical destruction. Eur Neurol 33:403–408. 10.1159/000116984 - DOI - PubMed

Publication types