. 2020 May;94(5):1673-1686.
doi: 10.1007/s00204-020-02732-3. Epub 2020 Apr 6.

Impairment of bile acid metabolism by perfluorooctanoic acid (PFOA) and perfluorooctanesulfonic acid (PFOS) in human HepaRG hepatoma cells

Affiliations

Impairment of bile acid metabolism by perfluorooctanoic acid (PFOA) and perfluorooctanesulfonic acid (PFOS) in human HepaRG hepatoma cells

Anne-Cathrin Behr et al. Arch Toxicol. 2020 May.

Erratum in

Abstract

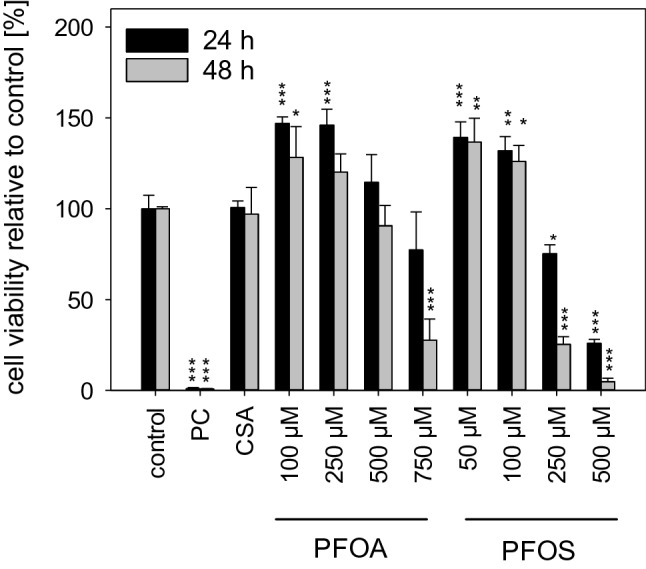
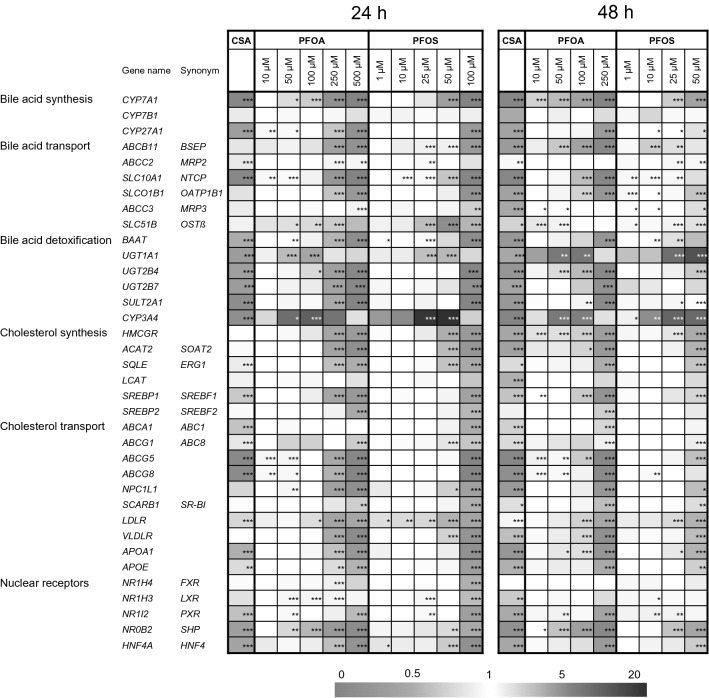
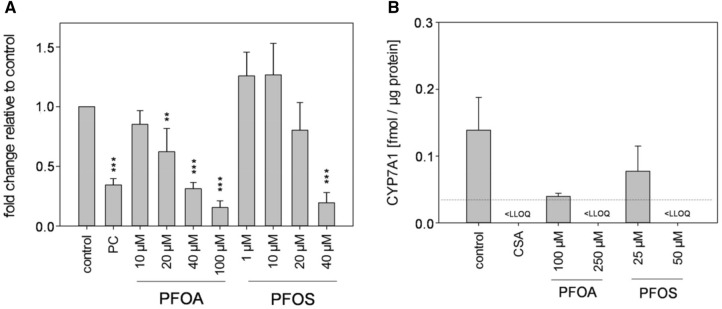
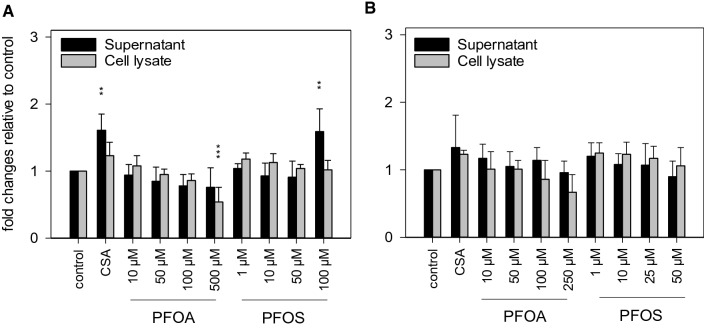
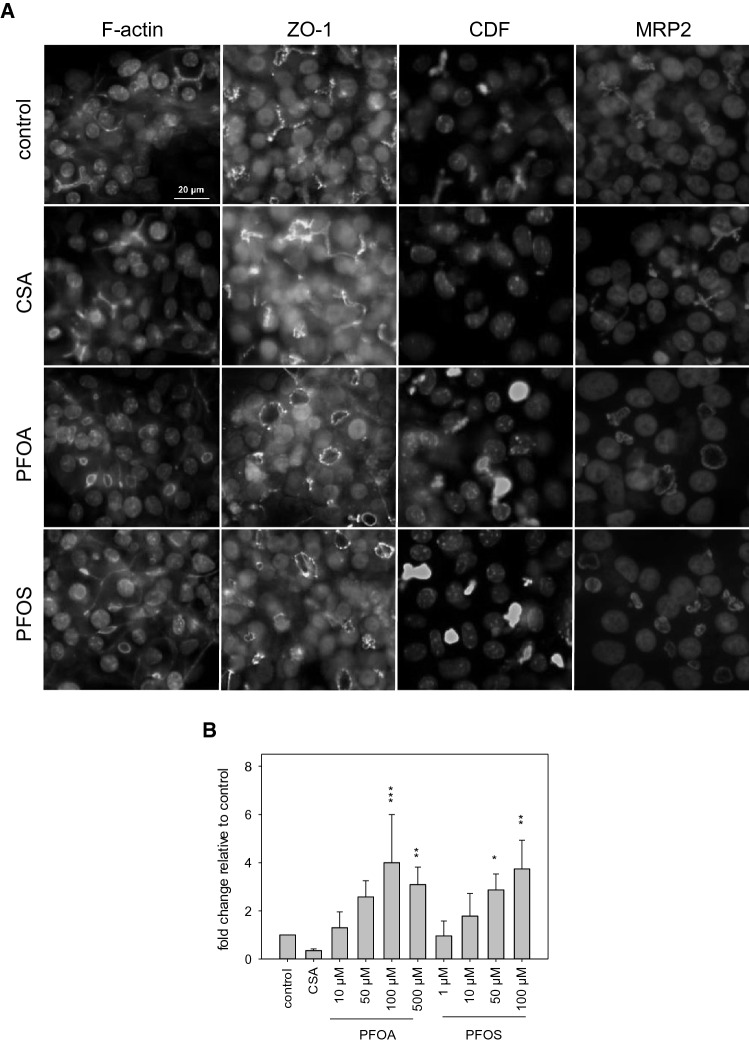
Perfluorooctanoic acid (PFOA) and perfluorooctanesulfonic acid (PFOS) are man-made chemicals that are used for the fabrication of many products with water- and dirt-repellent properties. The toxicological potential of both substances is currently under debate. In a recent Scientific Opinion, the European Food Safety Authority (EFSA) has identified increased serum total cholesterol levels in humans as one major critical effect being associated with exposure to PFOA or PFOS. In animal studies, both substances induced a decrease of serum cholesterol levels, and the underlying molecular mechanism(s) for these opposed effects are unclear so far. In the present study, we examined the impact of PFOA and PFOS on cholesterol homoeostasis in the human HepaRG cell line as a model for human hepatocytes. Cholesterol levels in HepaRG cells were not affected by PFOA or PFOS, but both substances strongly decreased synthesis of a number of bile acids. The expression of numerous genes whose products are involved in synthesis, metabolism and transport of cholesterol and bile acids was strongly affected by PFOA and PFOS at concentrations above 10 µM. Notably, both substances led to a strong decrease of CYP7A1, the key enzyme catalyzing the rate-limiting step in the synthesis of bile acids from cholesterol, both at the protein level and at the level of gene expression. Moreover, both substances led to a dilatation of bile canaliculi that are formed by differentiated HepaRG cells in vitro. Similar morphological changes are known to be induced by cholestatic agents in vivo. Thus, the strong impact of PFOA and PFOS on bile acid synthesis and bile canalicular morphology in our in vitro experiments may allow the notion that both substances have a cholestatic potential that is connected to the observed increased serum cholesterol levels in humans in epidemiological studies.

Keywords: Bile flow; Cholesterol; Contaminants; Hepatocytes; Liver toxicity.


Conflict of interest statement

The authors declare that they have no conflict of interest.

Figures

Fig. 1
Fig. 1
Cell viability of HepaRG cells. The cells were exposed to various concentrations of PFOA or PFOS, or to 20 µM CSA, for 24 h or 48 h, and cellular viability was measured using the MTT assay. Viability is represented as percentage, compared to untreated cells (control) set to 100%. In each experiment, Triton X-100 (0.01%) served as positive control (PC). Data are presented as mean + SD. ***p < 0.001, **p < 0.01, *p < 0.05; one-way ANOVA with Dunnett’s post hoc test
Fig. 2
Fig. 2
Gene expression analysis of genes related to cholesterol homeostasis. HepaRG cells were exposed to various concentrations of PFOA or PFOS, or to 20 µM CSA, for 24 h or 48 h. Untreated cells served as control. mRNA levels were normalized to GAPDH expression. Fold changes relative to untreated cells (mean of three individual experiments) are presented in the heat map. ***p < 0.001, **p < 0.01, *p < 0.05; one-way ANOVA with Dunnett’s post hoc test
Fig. 3
Fig. 3
Promotor activity and protein level of CYP7A1. a HepG2 cells were transfected with the promotor plasmid pGL4.14–CYP7A1-Prom and the Renilla-luciferase construct pcDNA3-Rluc. Luciferase activity was measured after 24-h exposure to various concentrations of PFOA or PFOS. Transfected cells treated with 1 µM phorbol 12-myristate 13-acetate (PMA) served as a positive control (PC). Values were normalized to Renilla reniformis luciferase activities and compared to untreated cells (control). Data are represented as mean + SD. ***p < 0.001, **p < 0.01; one-way ANOVA with Dunnett’s post hoc test. b HepaRG cells were exposed to various concentrations of PFOA or PFOS, or to 20 µM CSA for 48 h. CYP7A1 protein was analyzed via mass spectrometry-based immunoassay. The dashed line indicates the lower limit of quantification (LLOQ) for this protein quantification method. Data are presented as mean + SD relative to untreated cells (control) from three replicate wells per condition
Fig. 4
Fig. 4
Cholesterol content in cell lysates and cell culture supernatants. HepaRG cells were treated with various concentrations of PFOA or PFOS, or 20 µM CSA, for (a) or 48 h (b). Cholesterol levels in cell lysates and supernatants were quantified using the fluorescence-based AmplexRed Cholesterol Assay. Data are presented as mean + SD. ***p < 0.001, **p < 0.01; one-way ANOVA with Dunnett’s post hoc test
Fig. 5
Fig. 5
Bile acid profiles in cell lysates and cell culture supernatants. HepaRG cells were treated with the indicated concentrations of PFOA or PFOS, or with 20 µM CSA, for 48 h. Quantification of bile acids was conducted using ultra performance liquid chromatography (UPLC) coupled to tandem mass spectrometry. Data are presented as mean + SD out of three biological replicates with three replicate wells per condition. ***p < 0.001, **p < 0.01, *p < 0.05; one-way ANOVA with Dunnett’s post hoc test
Fig. 6
Fig. 6
Effects of PFOA and PFOS on the distribution of cytoskeletal proteins and on bile flow. HepaRG cells were treated with various concentrations of PFOA or PFOS, or with 20 µM CSA. Immunostaining was performed using antibodies directed against F-actin, ZO-1 and MRP2 together with the respective secondary antibody (F-actin = green, ZO-1 = yellow, MRP2 = red). Nuclei were stained with DAPI (blue). CDF accumulation (green) in bile canaliculi was quantified; nuclei were stained with Hoechst33342 (blue). a Representative microscopic images for untreated control cells and for the treatments with 20 µM CSA, 100 µM PFOA, or 50 µM PFOS. b Quantification of CDF fluorescence intensity. Fold changes relative to untreated cells (mean + SD of four individual experiments) are presented. ***p < 0.001, **p < 0.01, *p < 0.05; one-way ANOVA with Dunnett’s post hoc test (color figure online)

References

    1. Abrahamsson A, Gustafsson U, Ellis E, Nilsson L-M, Sahlin S, Björkhem I, Einarsson C. Feedback regulation of bile acid synthesis in human liver: importance of HNF-4α for regulation of CYP7A1. Biochem Biophys Res Commun. 2005;330:395–399. - PubMed
    1. Alnouti Y. Bile acid sulfation: a pathway of bile acid elimination and detoxification. Toxicol Sci. 2009;108:225–246. - PubMed
    1. Antherieu S, Chesne C, Li R, Camus S, Lahoz A, Picazo L, Turpeinen M, Tolonen A, Uusitalo J, Guguen-Guillouzo C, Guillouzo A. Stable expression, activity, and inducibility of cytochromes P450 in differentiated HepaRG cells. Drug Metab Dispos. 2010;38:516–525. - PubMed
    1. Anthérieu S, Azzi PBE, Dumont J, Abdel-Razzak Z, Guguen-Guillouzo C, Fromenty B, Robin MA, Guillouzo A. Oxidative stress plays a major role in chlorpromazine-induced cholestasis in human HepaRG cells. Hepatology. 2013;57:1518–1529. - PubMed
    1. Bachour-El Azzi P, Pamela AS, Burban A, Li R, Le Guével R, Abdel-Razzak Z, Stieger B, Guguen-Guillouzo C, Guillouzo A. Comparative localization and functional activity of the main hepatobiliary transporters in HepaRG cells and primary human hepatocytes. Toxicol Sci. 2015;145:157–168. - PMC - PubMed

Publication types

LinkOut - more resources