

Spatial organization of occipital white matter tracts in the common marmoset
- PMID: 32253509
- PMCID: PMC7577349
- DOI: 10.1007/s00429-020-02060-3
Spatial organization of occipital white matter tracts in the common marmoset
Abstract
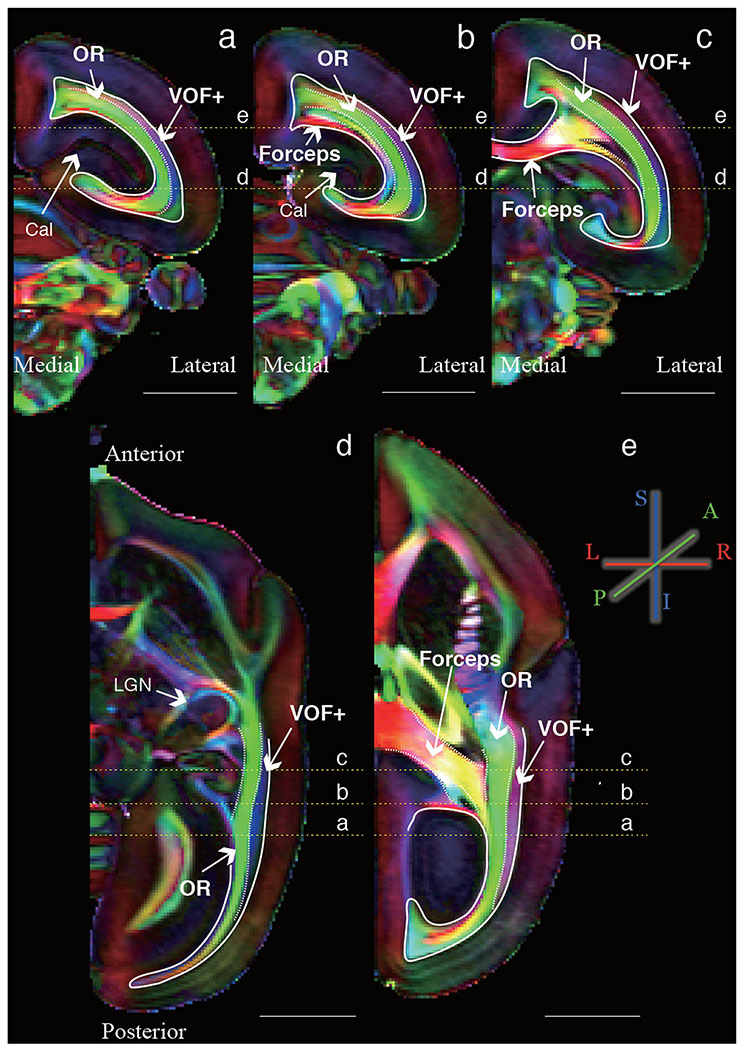
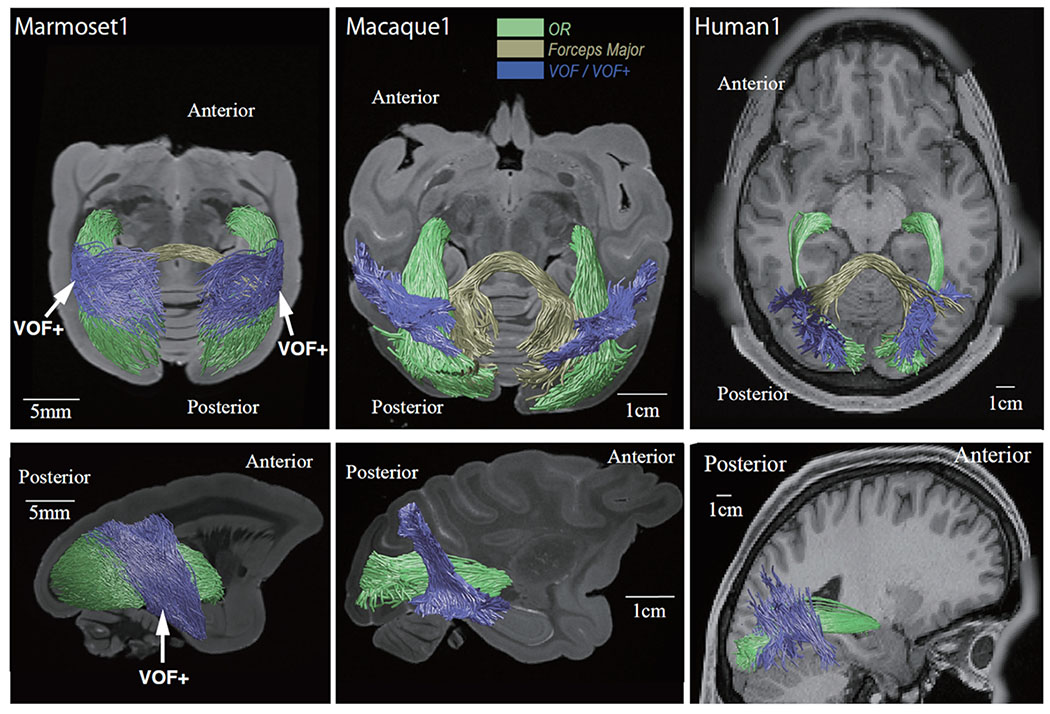
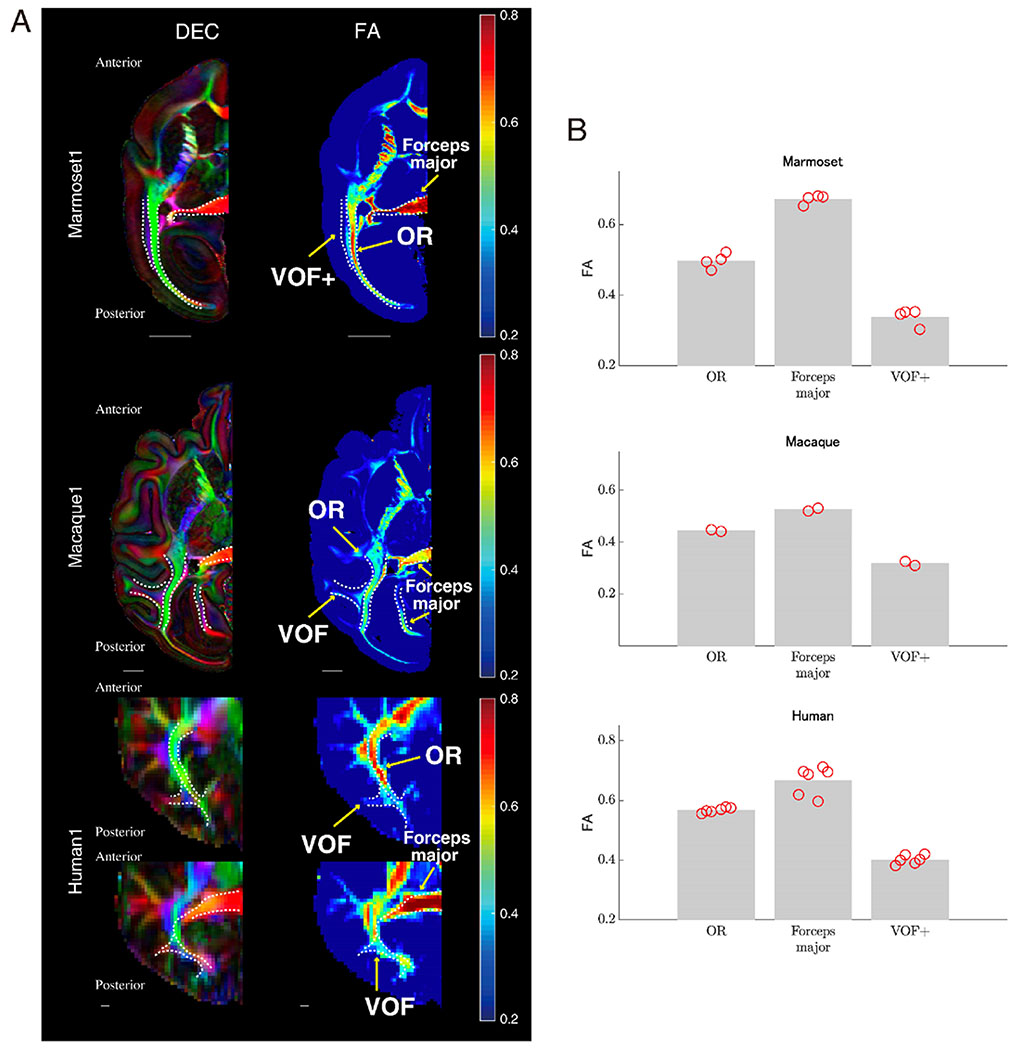
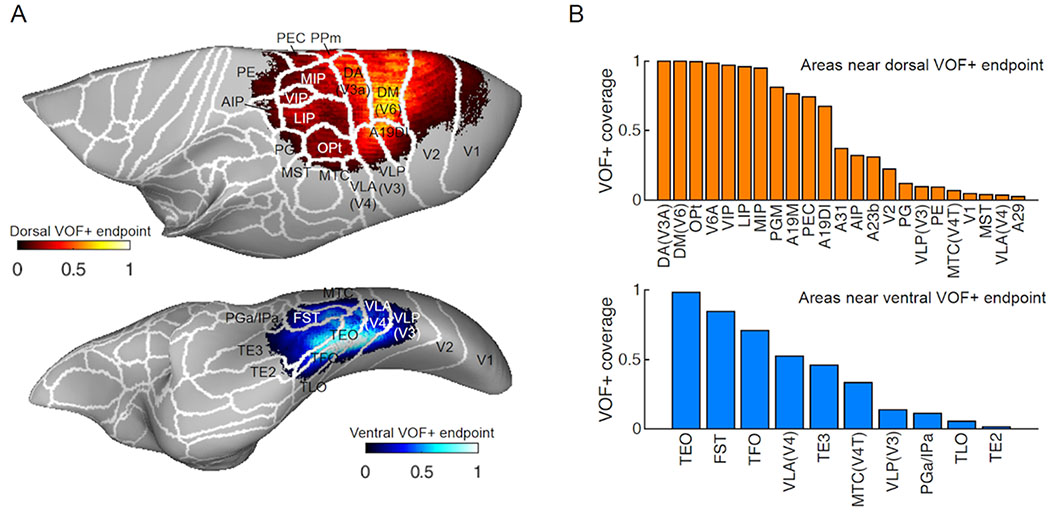
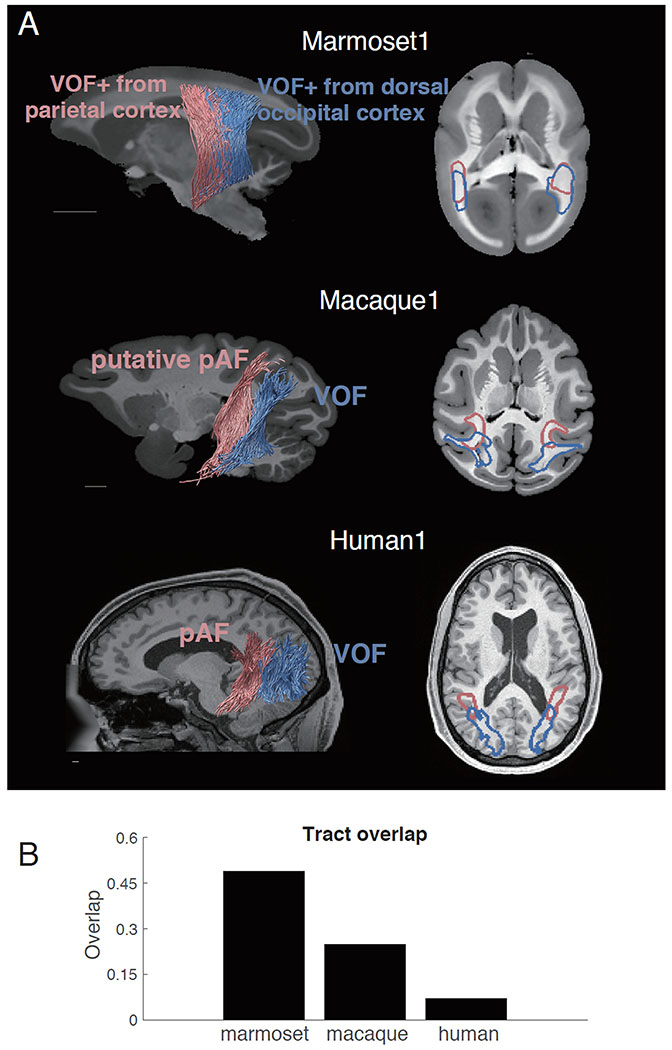
The primate brain contains a large number of interconnected visual areas, whose spatial organization and intracortical projections show a high level of conservation across species. One fiber pathway of recent interest is the vertical occipital fasciculus (VOF), which is thought to support communication between dorsal and ventral visual areas in the occipital lobe. A recent comparative diffusion MRI (dMRI) study reported that the VOF in the macaque brain bears a similar topology to that of the human, running superficial and roughly perpendicular to the optic radiation. The present study reports a comparative investigation of the VOF in the common marmoset, a small New World monkey whose lissencephalic brain is approximately tenfold smaller than the macaque and 150-fold smaller than the human. High-resolution ex vivo dMRI of two marmoset brains revealed an occipital white matter structure that closely resembles that of the larger primate species, with one notable difference. Namely, unlike in the macaque and the human, the VOF in the marmoset is spatially fused with other, more anterior vertical tracts, extending anteriorly between the parietal and temporal cortices. We compare several aspects of this continuous structure, which we term the VOF complex (VOF +), and neighboring fasciculi to those of macaques and humans. We hypothesize that the essential topology of the VOF+ is a conserved feature of the posterior cortex in anthropoid primates, with a clearer fragmentation into multiple named fasciculi in larger, more gyrified brains.
Keywords: Comparative anatomy; Diffusion MRI; Marmoset; Vertical occipital fasciculus; Visual cortex; White matter.
Conflict of interest statement
Figures
Similar articles
-
A prominent vertical occipital white matter fasciculus unique to primate brains.Curr Biol. 2024 Aug 19;34(16):3632-3643.e4. doi: 10.1016/j.cub.2024.06.034. Epub 2024 Jul 10. Curr Biol. 2024. PMID: 38991613 Free PMC article.
-
Occipital White Matter Tracts in Human and Macaque.Cereb Cortex. 2017 Jun 1;27(6):3346-3359. doi: 10.1093/cercor/bhx070. Cereb Cortex. 2017. PMID: 28369290 Free PMC article.
-
The vertical occipital fasciculus: a century of controversy resolved by in vivo measurements.Proc Natl Acad Sci U S A. 2014 Dec 2;111(48):E5214-23. doi: 10.1073/pnas.1418503111. Epub 2014 Nov 17. Proc Natl Acad Sci U S A. 2014. PMID: 25404310 Free PMC article.
-
The vertical superior longitudinal fascicle and the vertical occipital fascicle.J Neurosurg Sci. 2021 Dec;65(6):581-589. doi: 10.23736/S0390-5616.21.05368-6. J Neurosurg Sci. 2021. PMID: 35128919 Review.
-
Comparative neuroanatomy: Integrating classic and modern methods to understand association fibers connecting dorsal and ventral visual cortex.Neurosci Res. 2019 Sep;146:1-12. doi: 10.1016/j.neures.2018.10.011. Epub 2018 Oct 30. Neurosci Res. 2019. PMID: 30389574 Free PMC article. Review.
Cited by
-
Occipital Intralobar fasciculi: a description, through tractography, of three forgotten tracts.Commun Biol. 2021 Mar 30;4(1):433. doi: 10.1038/s42003-021-01935-3. Commun Biol. 2021. PMID: 33785859 Free PMC article.
-
White matter tracts adjacent to the human cingulate sulcus visual area (CSv).PLoS One. 2024 Apr 5;19(4):e0300575. doi: 10.1371/journal.pone.0300575. eCollection 2024. PLoS One. 2024. PMID: 38578743 Free PMC article.
-
Parvalbumin as a neurochemical marker of the primate optic radiation.iScience. 2023 Apr 8;26(5):106608. doi: 10.1016/j.isci.2023.106608. eCollection 2023 May 19. iScience. 2023. PMID: 37168578 Free PMC article.
-
Cortical neural dynamics unveil the rhythm of natural visual behavior in marmosets.Commun Biol. 2022 Feb 3;5(1):108. doi: 10.1038/s42003-022-03052-1. Commun Biol. 2022. PMID: 35115680 Free PMC article.
-
White matter connections of human ventral temporal cortex are organized by cytoarchitecture, eccentricity and category-selectivity from birth.Nat Hum Behav. 2025 May;9(5):955-970. doi: 10.1038/s41562-025-02116-6. Epub 2025 Mar 17. Nat Hum Behav. 2025. PMID: 40097802
References
-
- Basser PJ, Pierpaoli C (1996) Microstructural and physiological features of tissues elucidated by quantitative-diffusion-tensor MRI. J Magn Reson B 111:209–219 - PubMed
-
- Brewer AA, Liu J, Wade AR, Wandell BA (2005) Visual field maps and stimulus selectivity in human ventral occipital cortex. Nat Neurosci 8:1102–1109 - PubMed
MeSH terms
Grants and funding
LinkOut - more resources
Full Text Sources
