. 2020 Aug 15;202(4):535-548.
doi: 10.1164/rccm.201906-1123OC.

Human Lung Conventional Dendritic Cells Orchestrate Lymphoid Neogenesis during Chronic Obstructive Pulmonary Disease

Affiliations

Human Lung Conventional Dendritic Cells Orchestrate Lymphoid Neogenesis during Chronic Obstructive Pulmonary Disease

Thomas Naessens et al. Am J Respir Crit Care Med. .

Abstract

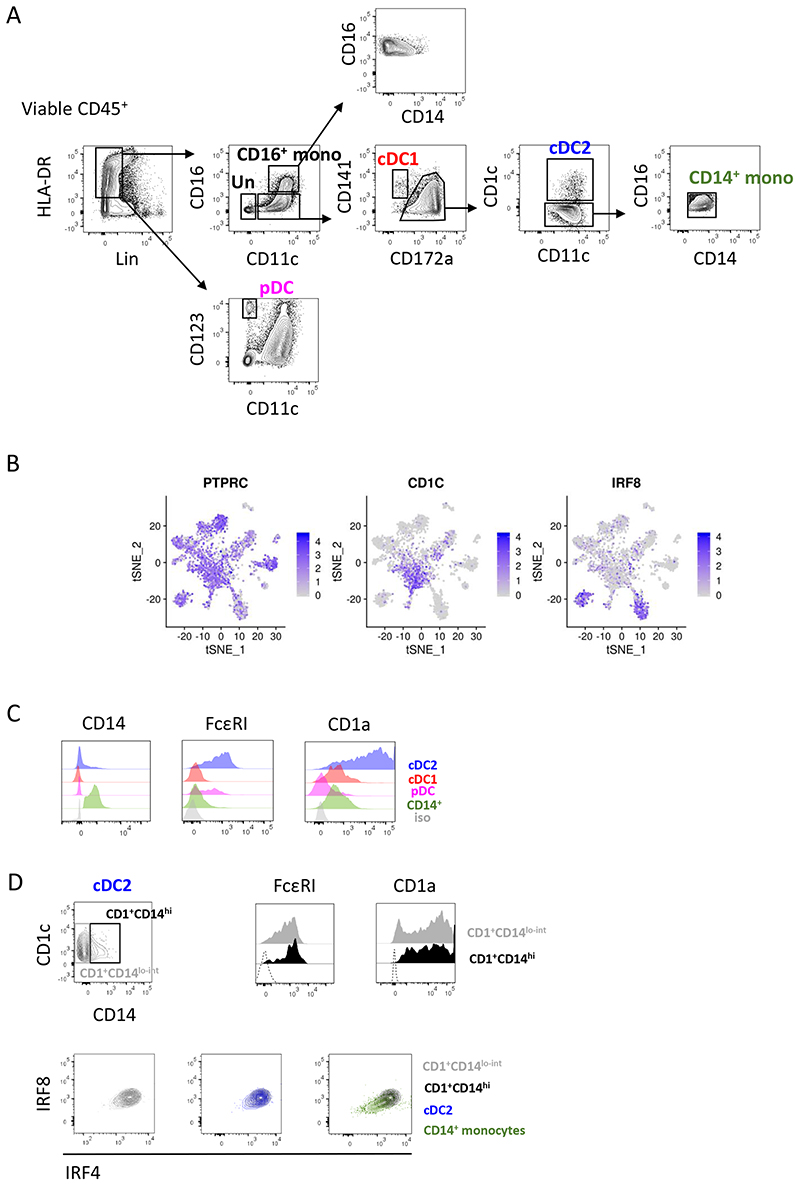
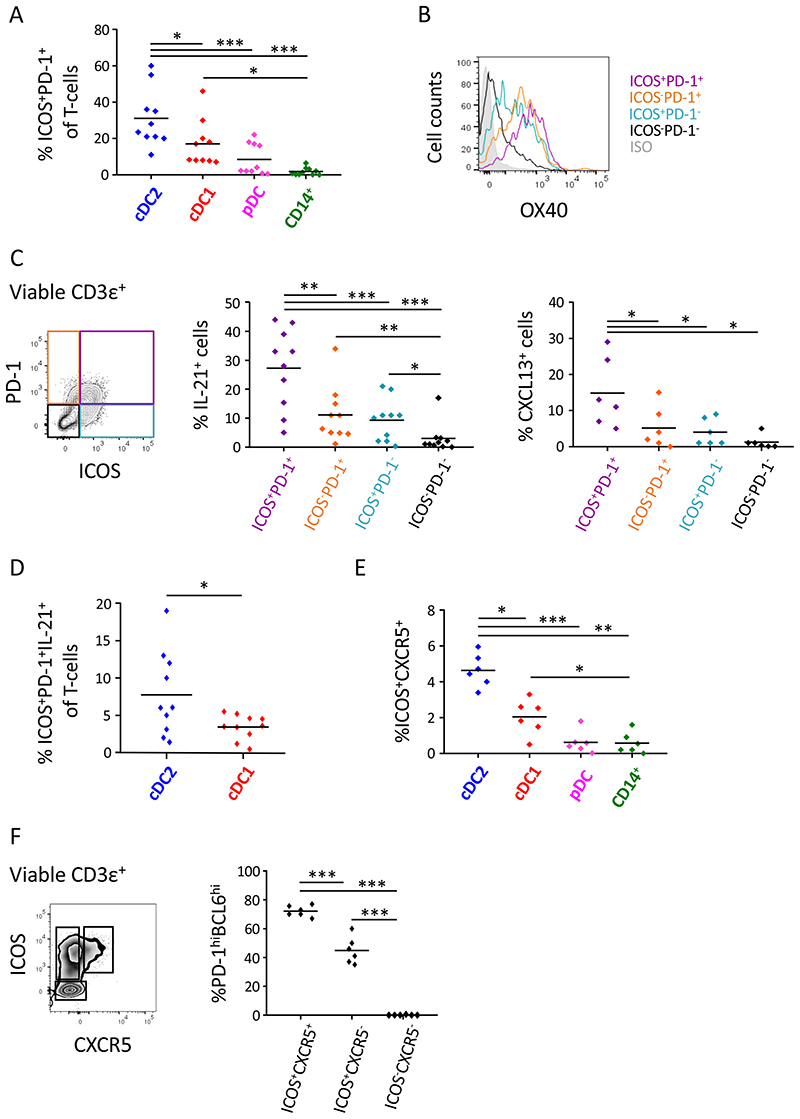
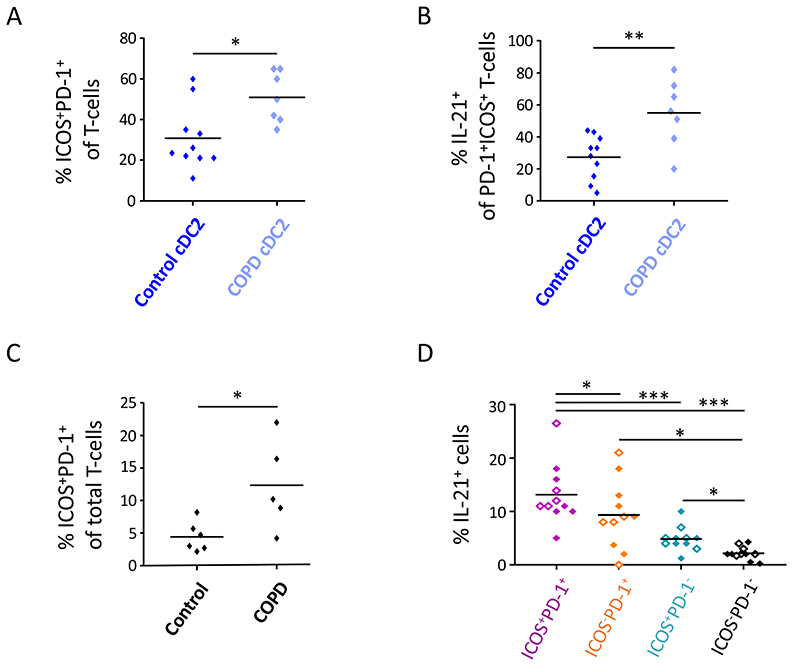
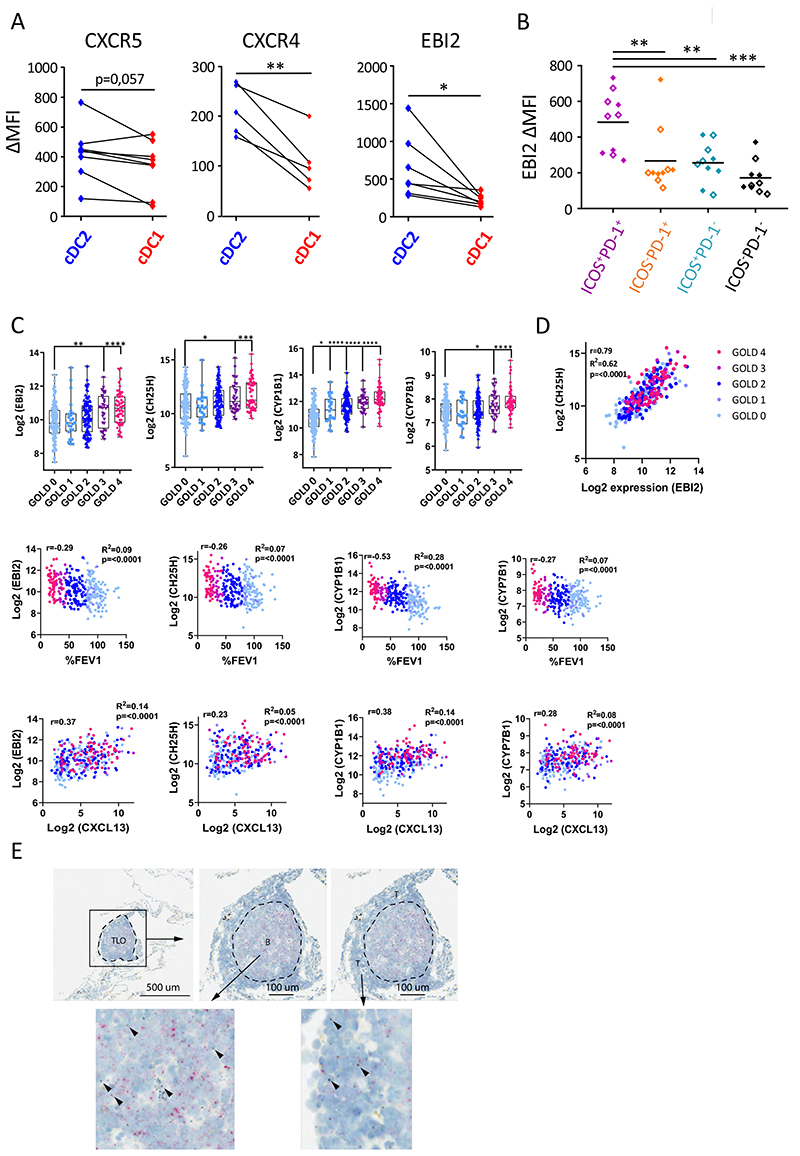
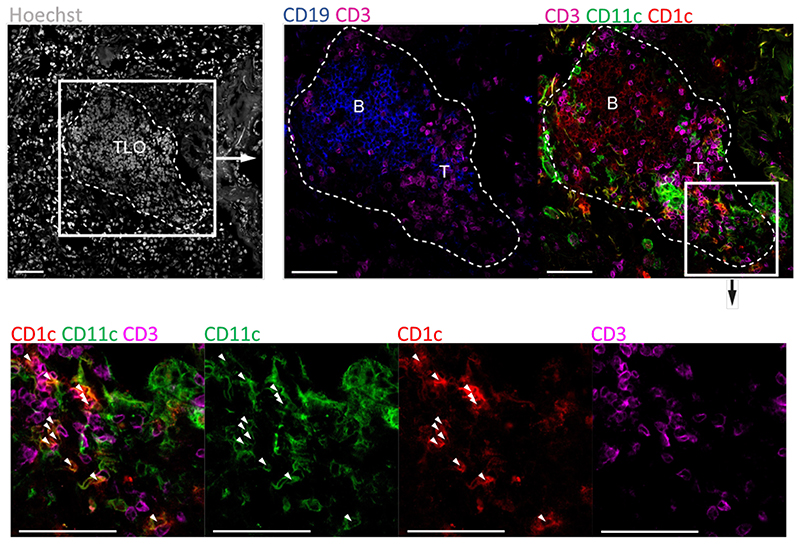
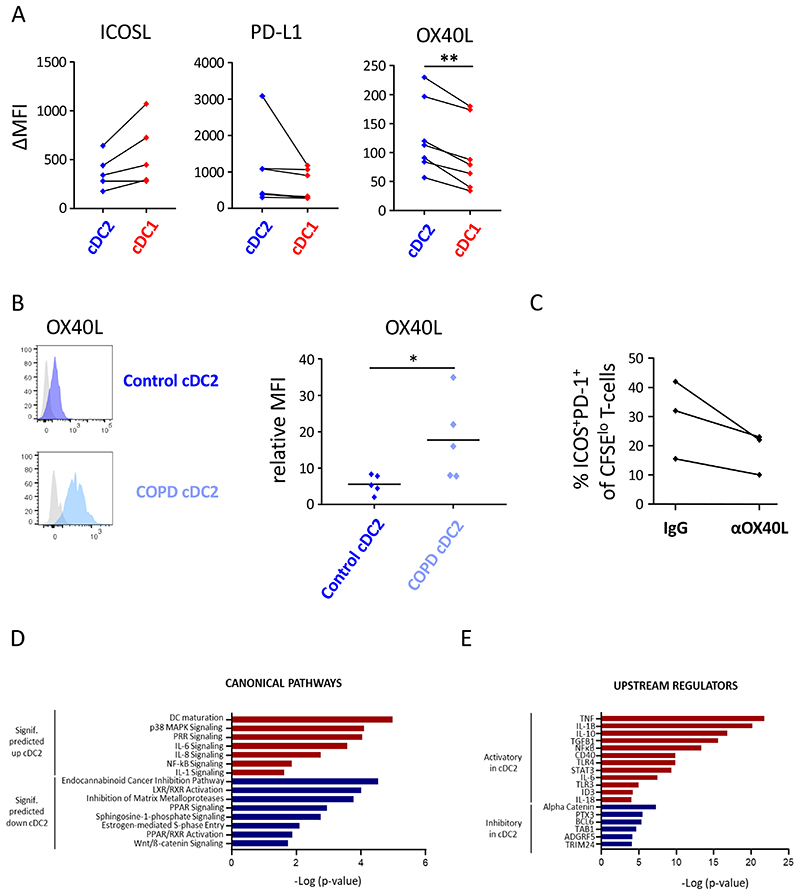
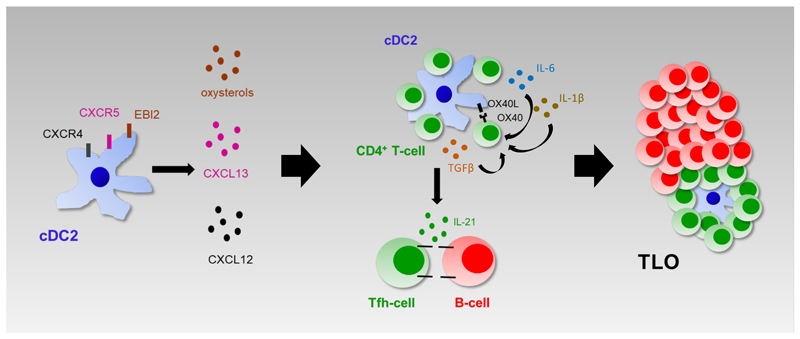
Rationale: Emerging evidence supports a crucial role for tertiary lymphoid organs (TLOs) in chronic obstructive pulmonary disease (COPD) progression. However, mechanisms of immune cell activation leading to TLOs in COPD remain to be defined.Objectives: To examine the role of lung dendritic cells (DCs) in T follicular helper (Tfh)-cell induction, a T-cell subset critically implicated in lymphoid organ formation, in COPD.Methods: Myeloid cell heterogeneity and phenotype were studied in an unbiased manner via single-cell RNA sequencing on HLA-DR+ cells sorted from human lungs. We measured the in vitro capability of control and COPD lung DC subsets, sorted using a fluorescence-activated cell sorter, to polarize IL-21+CXCL13+ (IL-21-positive and C-X-C chemokine ligand type 13-positive) Tfh-like cells. In situ imaging analysis was performed on Global Initiative for Chronic Obstructive Lung Disease stage IV COPD lungs with TLOs.Measurements and Main Results: Single-cell RNA-sequencing analysis revealed a high degree of heterogeneity among human lung myeloid cells. Among these, conventional dendritic type 2 cells (cDC2s) showed increased induction of IL-21+CXCL13+ Tfh-like cells. Importantly, the capacity to induce IL-21+ Tfh-like cells was higher in cDC2s from patients with COPD than in those from control patients. Increased Tfh-cell induction by COPD cDC2s correlated with increased presence of Tfh-like cells in COPD lungs as compared with those in control lungs, and cDC2s colocalized with Tfh-like cells in TLOs of COPD lungs. Mechanistically, cDC2s exhibited a unique migratory signature and (transcriptional) expression of several pathways and genes related to DC-induced Tfh-cell priming. Importantly, blocking the costimulatory OX40L (OX40 ligand)-OX40 axis reduced Tfh-cell induction by control lung cDC2s.Conclusions: In COPD lungs, we found lung EBI2+ (Epstein-Barr virus-induced gene 2-positive) OX-40L-expressing cDC2s that induced IL-21+ Tfh-like cells, suggesting an involvement of these cells in TLO formation.

Keywords: T follicular helper cells; chronic obstructive pulmonary disease (COPD); dendritic cells; tertiary lymphoid organs.


Figures

Figure 1
Figure 1. Human non-obstructed lungs contain a highly heterogeneous myeloid cell compartment.
Myeloid cells, purified from non-obstructed human peritumoral lung tissues (n=3), were analyzed by single-cell RNA sequencing using the Seurat package. Combined single-cell transcriptomes were analyzed. (A) t-SNE representation of cell clusters identified using unsupervised clustering. Each dot represents an individual cell. Colors represent identified clusters. (B) Heatmap of scaled expression of (log values of Unique Molecular Identifiers (UMI)) for the top 20 differentially expressed genes of each cluster (based on log fold change). (C) Signature scores (arbitrary units) of individual cells for indicated gene signatures.
Figure 2
Figure 2. Lung cDC2 are the most potent inducers of Tfh-like cell polarization.
DC subsets were purified from non-obstructed peritumoral lung tissue and co-cultured with allogeneic naive blood CD4+ T-cells. (A) Percentages of ICOS+PD-1+ T-cells in the different DC/T-cell co-cultures were determined at d7 of the co-culture via flow cytometry. Summary data graph with each symbol representing an individual donor (n=10). (B) Flow cytometry histogram of OX40 staining on ICOS+PD-1+ (purple), ICOSPD-1+ (orange), ICOS+PD-1 (blue) and ICOS PD-1 (black) T-cell subsets in cDC2/T-cell co-cultures. Representative data from 3 donors is shown. (C) Intracellular IL-21 (n=10) and CXCL13 (n=6) staining of ICOS+PD-1+ (purple), ICOSPD-1+ (orange), ICOS+PD-1 (blue) and ICOSPD-1 (black) T-cell subsets in cDC2/T-cell co-cultures after restimulation with PMA and ionomycin in the presence of Golgi-plug and Golgi-stop. Summary data graph in which each symbol represents an individual donor. (D) Percentages of ICOS+PD-1+IL-21+ T-cells in cDC2/T-cell and cDC1/T-cell co-cultures were determined. Summary data graph in which each symbol represents an individual donor (n=10). (E) Proportions of ICOS+CXCR5+ T-cells in the different DC/T-cell co-cultures were determined at day 4. Summary data graph in which each symbol represents an individual donor (n=6). (F) Percentages of PD-1hiBCL6hi cells in ICOS+CXCR5+, ICOS+CXCR5 and ICOS CXCR5 T-cell subsets in the cDC2/T-cell co-cultures were determined via flow cytometry. Summary data graph in which each symbol represents an individual donor (n=6). *p<0.05, **p<0.01, ***p<0.001, Tukey’s multiple comparison test (A, C, E and F) and paired student’s t-test (D).
Figure 3
Figure 3. cDC2 from COPD GOLD II lungs display increased potential to promote Tfh-like cell skewing which is associated with the increased presence of Tfh-like cells in the COPD lung.
(A) and (B) cDC2 were isolated from COPD GOLD II peritumoral lung tissues (n=7) and co-cultured with allogeneic naïve CD4+ T-cells. Proportions of ICOS+PD-1+ T-cells (A) and ICOS+PD-1+IL-21+ T-cells (B) were determined at day 7 and compared to the respective T-cell proportions induced by cDC2 from non-obstructed peritumoral lung tissues as previously shown in Figure 2 (n=10). Shown is summary data graphs in which each symbol represents an individual donor. (C) Percentages of ICOS+PD-1+ Tfh-like cells were determined in peritumoral lung tissue resections of COPD and non-obstructed control subjects via flow cytometry. Shown is summary data graph in which each symbol represents an individual donor (n=6 for controls and n=5 for COPD subjects). (D) Intracellular IL-21 staining of lung tissue ICOS+PD-1+ (purple), ICOSPD-1+ (orange), ICOS+PD-1 (blue) and ICOSPD-1 (black) T-cell subsets after PMA/ionomycin restimulation (+ Golgi-plug/Golgi-stop) in DC-free in vitro cultures. Shown are pooled data from control (full diamonds) and COPD (open diamonds) lung resections (n=11). Each symbol represents an individual donor. *p<0.05, **p<0.01, ***p<0.001, Student’s t-test (A-C) and Tukey’s multiple comparison test (D).
Figure 4
Figure 4. cDC2 exhibit a unique migratory pattern.
(A) Surface levels of CXCR5, CXCR4 and EBI2 were measured on cDC2 and cDC1 from non-obstructed peritumoral lung resections via flow cytometry (n=7 for CXCR5, n=5 for CXCR4 and n=7 for EBI2). Summary data graphs (mean MFI corrected for background intensity) for the indicated markers are shown. Each symbol represents an individual donor. (B) Surface EBI2 levels on ICOS+PD-1+ (purple), ICOS PD-1+ (orange), ICOS+PD-1 (blue) and ICOSPD-1 (black) T-cell subsets in the lung measured via flow cytometry. Summary data graph (mean MFI corrected for background intensity) of pooled control (full diamonds) and COPD (open diamonds) lung samples (n=10). Each symbol represents an individual donor. (C) Correlations of whole lung EBI2, CH25H, CYP1B1 and CYP7B1 mRNA expression with COPD disease severity (GOLD stage and %FEV1) and whole lung CXCL13 mRNA as a marker for TLO formation. (D) Correlation of whole lung CH25H mRNA expression with whole lung EBI2 mRNA expression. Data in C and D are derived from a publicly available GSE-set (GSE47460). Healthy control subjects n=116; GOLD I n=24; GOLD II n=97; GOLD III n=32 and GOLD IV n=54. (E) In situ visualization of CH25HmRNA (brown) in COPD GOLD IV explanted lung tissue TLOs via RNAscope duplex technology (n=5). CD19 mRNA (red) is used to delineate the B-cell follicle of the TLO. *p<0.05, **p<0.01, ***p<0.001, (A) Student’s t-test, (B) Tukey’s multiple comparison test (C) and Holm-Sidak’s multiple test correction was used. To test for correlation of expression for the indicated genes within all study subjects, linear regression analysis and Pearson’s correlation test were used to calculate the correlation coefficient r, R2 and p-value of correlation.
Figure 5
Figure 5. cDC2 reside in the follicular T-cell zone of established COPD GOLD IV TLO.
Representative confocal fluorescence images of TLOs located in COPD GOLD IV explanted lungs (n=5). CD19 (blue) (AF594) and CD3ε (purple) (AF647) was used to define the B- and T-cell zone of the TLO respectively. CD11c (green) (FITC) and CD1c (red) (AF542) were used to identify cDC2 (white arrows). Hoechst was used as nuclear counter staining (grey). Scale bars 100μm.
Figure 6
Figure 6. cDC2 express increased levels of OX40L and transcriptional signatures related to Tfh-cell priming.
Surface levels of ICOSL, PD-L1 and OX40L were measured on cDC2 and cDC1 from (A) non-obstructed and (B) COPD GOLDII (OX40L) peritumoral lung tissue via flow cytometry. Summary data graphs of the indicated co-stimulatory markers are depicted in A and representative flow cytometry histograms and summary data graph for OX40L is shown in B. Each symbol represents an individual donor (n=5 for ICOSL, n=6 for PD-L1, n=7 for control OX40L control and n=5 for COPD OX40L). *p<0.05, **p<0.01, Student’s t-test. (C) cDC2 were isolated from non-obstructed peritumoral lung resections (n=3) and co-cultured with allogeneic naïve CD4+ T-cells in the presence of an OX40L blocking antibody (oxelumab) or an IgG isotype control. Proportions of ICOS+PD-1+ T-cells were determined at day 7. Shown is the combined data graph in which each symbol represents an individual donor. (D) and (E) cDC2 and cDC1 were FACS-sorted from non-obstructed peritumoral lung resections (n=5) and the RNA transcriptomic profile of these subsets was generated via NGS. (D) Canonical pathways significantly (signif) upregulated (red) and downregulated (blue) (Fisher’s exact test, -log10 P values for each represented pathway are shown) in transcriptional signatures in cDC2 vs cDC1 as predicted by Ingenuity Pathway Analysis (IPA). (E) Significant putative regulators with predicted activating (red) or inhibitory (blue) influence on transcriptional signatures in cDC2 vs cDC1 from non-obstructed lungs, as determined by IPA.
Figure 7
Figure 7. cDC2 drive lymphoid neogenesis during COPD; a working model.
Elevated pulmonary levels of CXCL12, CXCL13 and cholesterol metabolites, produced during COPD, attract cDC2 and CD4+ T-cells to the site of TLO formation. Upon encounter, cDC2 drive IL-21+ Tfh-like cell polarization via the OX40L-OX40 axis and the secretion of cytokines like IL-6, IL-1β and TGF-β. The chronicity of this self-amplifying loop results in the formation of well-established TLOs during late-stage COPD in which Tfh-like cell clonality and proliferation is further sustained by cDC2.

Comment in

References

    1. Collaborators GBDCoD. Global, regional, and national age-sex specific mortality for 264 causes of death, 1980-2016: a systematic analysis for the Global Burden of Disease Study 2016. Lancet. 2017;390:1151–1210. doi: 10.1016/S0140-6736(17)32152-9. - DOI - PMC - PubMed
    1. Hogg JC, Chu F, Utokaparch S, Woods R, Elliott WM, Buzatu L, Cherniack RM, Rogers RM, Sciurba FC, Coxson HO, Pare PD. The nature of small-airway obstruction in chronic obstructive pulmonary disease. N Engl J Med. 2004;350:2645–2653. - PubMed
    1. Ladjemi MZ, Martin C, Lecocq M, Detry B, Aboubakar Nana F, Moulin C, Weynand B, Fregimilicka C, Bouzin C, Thurion P, Carlier F, et al. Increased IgA Expression in Lung Lymphoid Follicles in Severe COPD. Am J Respir Crit Care Med. 2018 - PubMed
    1. Polverino F, Cosio BG, Pons J, Laucho-Contreras M, Tejera P, Iglesias A, Rios A, Jahn A, Sauleda J, Divo M, Pinto-Plata V, et al. B Cell-Activating Factor. An Orchestrator of Lymphoid Follicles in Severe Chronic Obstructive Pulmonary Disease. Am J Respir Crit Care Med. 2015;192:695–705. doi: 10.1164/rccm.201501-0107OC. - DOI - PMC - PubMed
    1. Randall TD. Bronchus-associated lymphoid tissue (BALT) structure and function. Adv Immunol. 2010;107:187–241. doi: 10.1016/B978-0-12-381300-8.00007-1. - DOI - PMC - PubMed

Publication types