. 2020 Jun;295(3):626-637.
doi: 10.1148/radiol.2020190283. Epub 2020 Apr 7.

Artificial Intelligence System Approaching Neuroradiologist-level Differential Diagnosis Accuracy at Brain MRI

Affiliations

Artificial Intelligence System Approaching Neuroradiologist-level Differential Diagnosis Accuracy at Brain MRI

Andreas M Rauschecker et al. Radiology. 2020 Jun.

Abstract

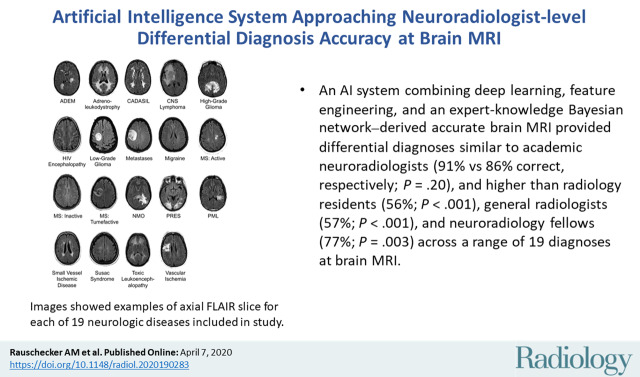
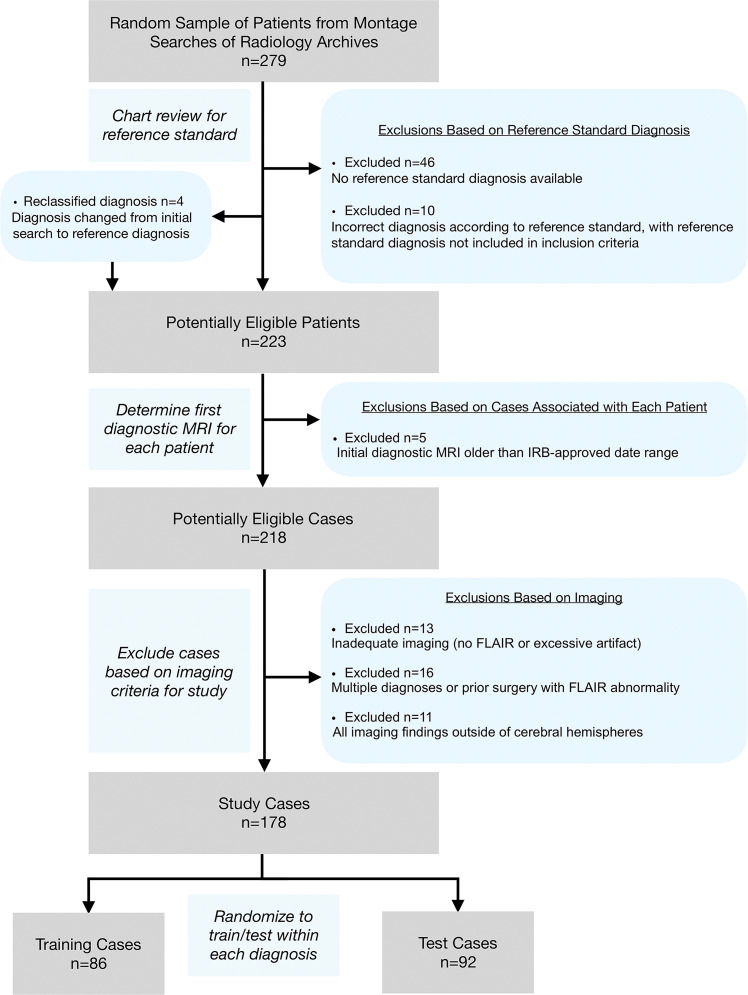
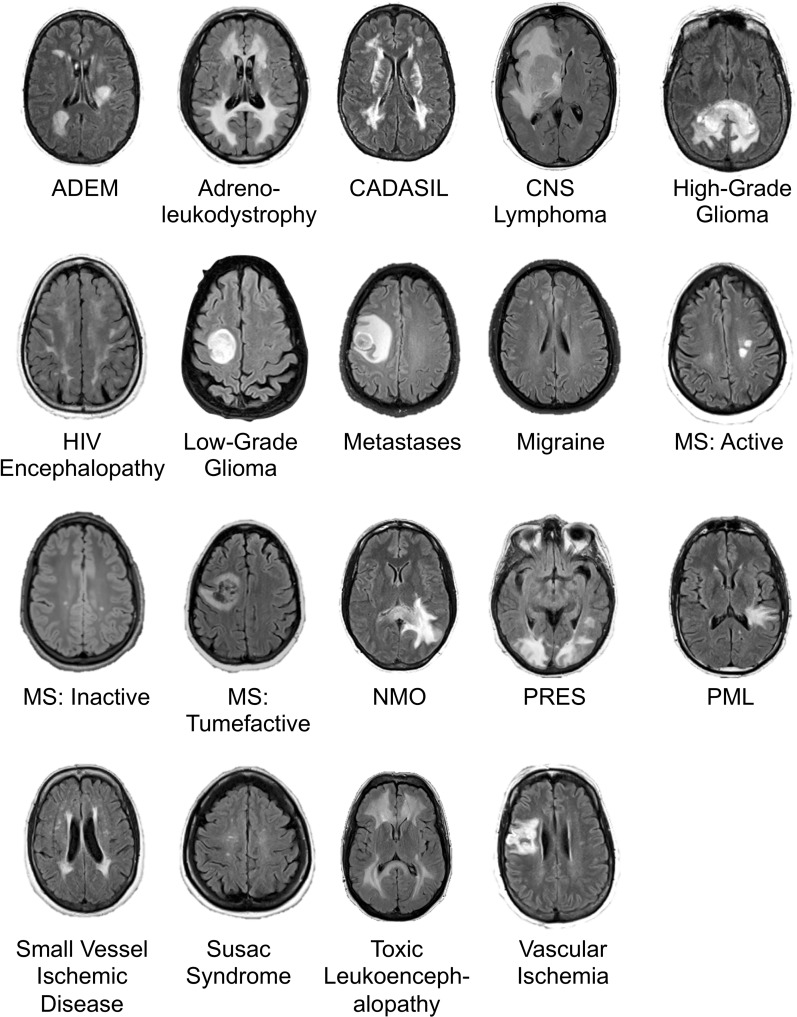
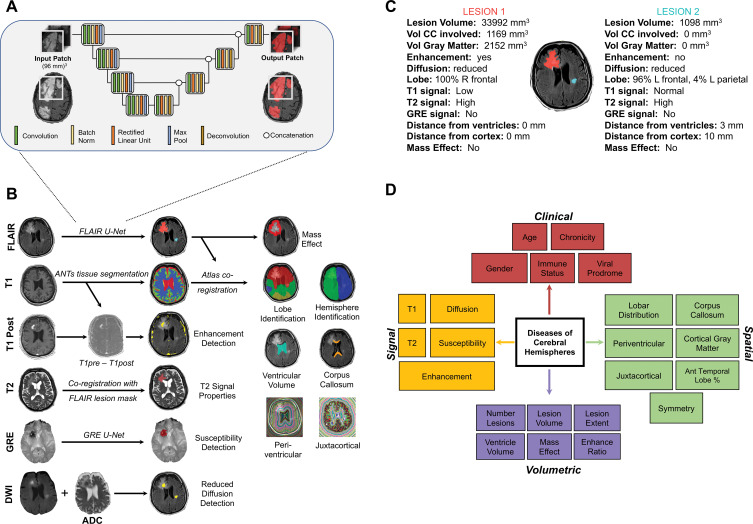
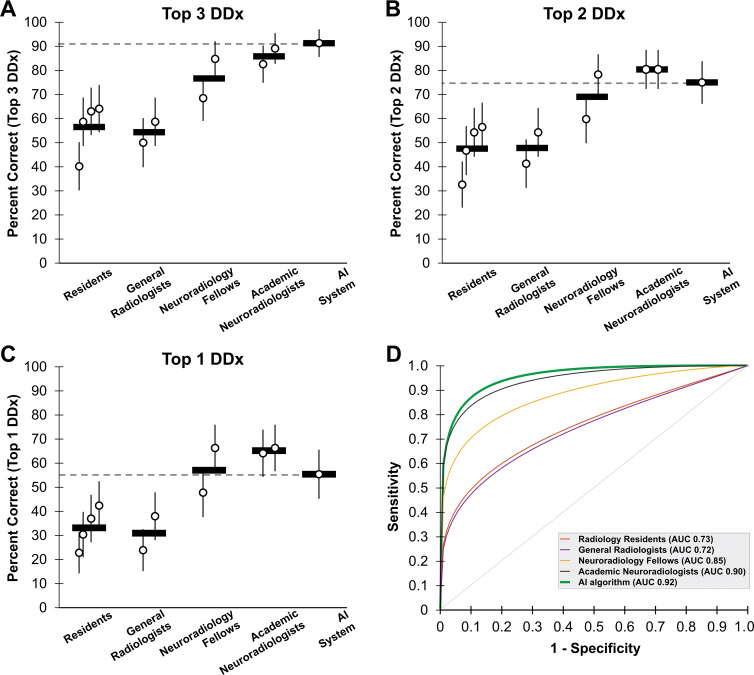
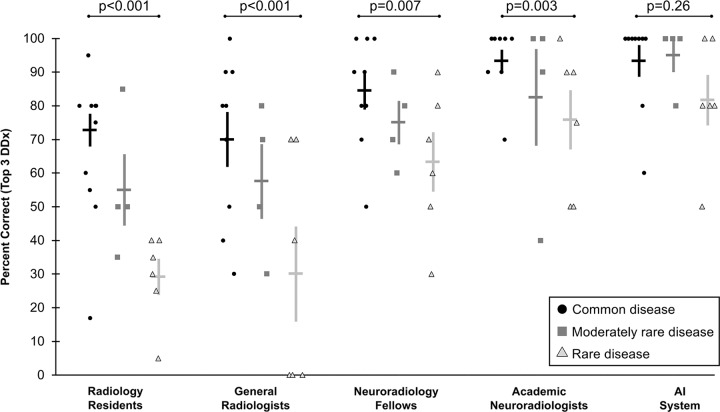
Background Although artificial intelligence (AI) shows promise across many aspects of radiology, the use of AI to create differential diagnoses for rare and common diseases at brain MRI has not been demonstrated. Purpose To evaluate an AI system for generation of differential diagnoses at brain MRI compared with radiologists. Materials and Methods This retrospective study tested performance of an AI system for probabilistic diagnosis in patients with 19 common and rare diagnoses at brain MRI acquired between January 2008 and January 2018. The AI system combines data-driven and domain-expertise methodologies, including deep learning and Bayesian networks. First, lesions were detected by using deep learning. Then, 18 quantitative imaging features were extracted by using atlas-based coregistration and segmentation. Third, these image features were combined with five clinical features by using Bayesian inference to develop probability-ranked differential diagnoses. Quantitative feature extraction algorithms and conditional probabilities were fine-tuned on a training set of 86 patients (mean age, 49 years ± 16 [standard deviation]; 53 women). Accuracy was compared with radiology residents, general radiologists, neuroradiology fellows, and academic neuroradiologists by using accuracy of top one, top two, and top three differential diagnoses in 92 independent test set patients (mean age, 47 years ± 18; 52 women). Results For accuracy of top three differential diagnoses, the AI system (91% correct) performed similarly to academic neuroradiologists (86% correct; P = .20), and better than radiology residents (56%; P < .001), general radiologists (57%; P < .001), and neuroradiology fellows (77%; P = .003). The performance of the AI system was not affected by disease prevalence (93% accuracy for common vs 85% for rare diseases; P = .26). Radiologists were more accurate at diagnosing common versus rare diagnoses (78% vs 47% across all radiologists; P < .001). Conclusion An artificial intelligence system for brain MRI approached overall top one, top two, and top three differential diagnoses accuracy of neuroradiologists and exceeded that of less-specialized radiologists. © RSNA, 2020 Online supplemental material is available for this article. See also the editorial by Zaharchuk in this issue.


Figures

None
Graphical abstract
Flowchart shows study selection according to exclusion criteria, from
initial patient search to training set and test set randomization. FLAIR
= fluid-attenuated inversion recovery, IRB = institutional review
board.
Figure 1:
Flowchart shows study selection according to exclusion criteria, from initial patient search to training set and test set randomization. FLAIR = fluid-attenuated inversion recovery, IRB = institutional review board.
Image shows example axial fluid-attenuated inversion recovery (FLAIR)
slice for each of 19 neurologic diseases included in study. ADEM =
acute disseminated encephalomyelitis, CADASIL = cerebral autosomal
dominant arteriopathy with subcortical infarcts and leukoencephalopathy, CNS
= primary central nervous system, HIV = human immunodeficiency
virus, MS = multiple sclerosis, NMO = neuromyelitis optica, PML
= progressive multifocal leukoencephalopathy, PRES = posterior
reversible encephalopathy syndrome. Range of repetition time and echo time
values are given in Table 2.
Figure 2:
Image shows example axial fluid-attenuated inversion recovery (FLAIR) slice for each of 19 neurologic diseases included in study. ADEM = acute disseminated encephalomyelitis, CADASIL = cerebral autosomal dominant arteriopathy with subcortical infarcts and leukoencephalopathy, CNS = primary central nervous system, HIV = human immunodeficiency virus, MS = multiple sclerosis, NMO = neuromyelitis optica, PML = progressive multifocal leukoencephalopathy, PRES = posterior reversible encephalopathy syndrome. Range of repetition time and echo time values are given in Table 2.
Image shows overview of artificial intelligence (AI) system. A,
Schematic of three-dimensional U-Net architecture used for abnormal signal
detection. B, Illustration of automatically extracted features by using
image processing. All examples except gradient-echo (GRE) susceptibility
detection are from patient with primary central nervous system lymphoma. See
Materials and Methods section for details on how each feature is extracted.
C, Multiple quantitative features are calculated for every lesion in every
patient, including those shown in this example. These features are stored,
providing rich quantitative description of the lesions. For developing
differential diagnosis, thresholded features are then probabilistically
combined in Bayesian network. D, Schematic of Bayesian network demonstrates
naive Bayesian architecture with complete set of features used by AI system
to differentiate diseases of cerebral hemispheres, divided into four
categories: clinical, signal, spatial, and volumetric. ADC = apparent
diffusion coefficient, ANTs = Advanced Normalization Tools, CC =
corpus callosum, DWI = diffusion-weighted imaging, FLAIR =
fluid-attenuated inversion recovery, vol = volume.
Figure 3:
Image shows overview of artificial intelligence (AI) system. A, Schematic of three-dimensional U-Net architecture used for abnormal signal detection. B, Illustration of automatically extracted features by using image processing. All examples except gradient-echo (GRE) susceptibility detection are from patient with primary central nervous system lymphoma. See Materials and Methods section for details on how each feature is extracted. C, Multiple quantitative features are calculated for every lesion in every patient, including those shown in this example. These features are stored, providing rich quantitative description of the lesions. For developing differential diagnosis, thresholded features are then probabilistically combined in Bayesian network. D, Schematic of Bayesian network demonstrates naive Bayesian architecture with complete set of features used by AI system to differentiate diseases of cerebral hemispheres, divided into four categories: clinical, signal, spatial, and volumetric. ADC = apparent diffusion coefficient, ANTs = Advanced Normalization Tools, CC = corpus callosum, DWI = diffusion-weighted imaging, FLAIR = fluid-attenuated inversion recovery, vol = volume.
Graphs show performance of composite artificial intelligence (AI)
system compared with radiologists with various levels of specialization. A,
Performance is measured as percent correct by listing correct diagnosis
within top three differential diagnoses (DDx) across 92 test studies (19
diseases). Each circle represents a single radiologist, and horizontal line
represents mean across each radiologist group. Horizontal dashed line is
performance of AI system. Error bars represent 95% binomial probability
confidence intervals. B, Accuracy (percent correct) within top two
diagnoses. C, Accuracy (percent correct) only using top diagnosis. D,
Receiver operating characteristic (ROC) curves for AI system (green)
compared with radiologists (other colors). AI system has similar area under
the curve (AUC) to that of academic neuroradiologists (black). ROC curves
are based on top one, top two, and top three most probable diagnoses
provided by each radiologist. See Materials and Methods section for further
details. Reported AUCs are nonparametric.
Figure 4:
Graphs show performance of composite artificial intelligence (AI) system compared with radiologists with various levels of specialization. A, Performance is measured as percent correct by listing correct diagnosis within top three differential diagnoses (DDx) across 92 test studies (19 diseases). Each circle represents a single radiologist, and horizontal line represents mean across each radiologist group. Horizontal dashed line is performance of AI system. Error bars represent 95% binomial probability confidence intervals. B, Accuracy (percent correct) within top two diagnoses. C, Accuracy (percent correct) only using top diagnosis. D, Receiver operating characteristic (ROC) curves for AI system (green) compared with radiologists (other colors). AI system has similar area under the curve (AUC) to that of academic neuroradiologists (black). ROC curves are based on top one, top two, and top three most probable diagnoses provided by each radiologist. See Materials and Methods section for further details. Reported AUCs are nonparametric.
Graphs show performance of artificial intelligence (AI) system and
radiologists depending on disease prevalence. Radiologists at all levels
more often correctly diagnosed common diseases than rare diseases, with the
effect less pronounced with increasing experience with rare diseases. For AI
system, there was no significant difference in performance on common versus
rare diseases. Individual shapes indicate top three diagnostic accuracy
(percent correct) for an individual disease across radiologists of each
category, with diseases categorized by their prevalence. Horizontal bars
demonstrate mean across individual data points, with corresponding standard
error of mean indicated by the error bars. P values shown are based on
χ2 test comparing common and rare disease performance. DDx =
differential diagnosis.
Figure 5:
Graphs show performance of artificial intelligence (AI) system and radiologists depending on disease prevalence. Radiologists at all levels more often correctly diagnosed common diseases than rare diseases, with the effect less pronounced with increasing experience with rare diseases. For AI system, there was no significant difference in performance on common versus rare diseases. Individual shapes indicate top three diagnostic accuracy (percent correct) for an individual disease across radiologists of each category, with diseases categorized by their prevalence. Horizontal bars demonstrate mean across individual data points, with corresponding standard error of mean indicated by the error bars. P values shown are based on χ2 test comparing common and rare disease performance. DDx = differential diagnosis.
Confusion matrices show sources of diagnostic errors for artificial
intelligence (AI) system and individual radiologists for each disease. By
convention, true disease labels are shown along x-axis, and predictions are
shown along y-axis, with color bar representing fraction of patients of true
diagnosis where predicted disease was listed as top diagnosis (ie, columns
add up to one). Perfect diagnostic algorithm would result in yellow squares
along diagonal from top left to bottom right. At least two types of mistakes
are seen both among radiologists and AI system, exemplified by white
rectangles for AI system: confusion between similarly appearing diseases,
and overdiagnosing certain diseases. Different individuals within a group
make different mistakes, and fewer errors occur with increasing
specialization. Act = active, ADEM = acute disseminated
encephalomyelitis, ALD = adrenoleukodystrophy, CADASIL = cerebral
autosomal dominant arteriopathy with subcortical infarcts and
leukoencephalopathy, CNS = central nervous system, HG =
high-grade, HIV enceph = human immunodeficiency virus encephalopathy,
Inact = inactive, LG = low-grade, MS = multiple sclerosis,
NMO = neuromyelitis optica, PML = progressive multifocal
leukoencephalopathy, PRES = posterior reversible encephalopathy
syndrome, SVID = small vessel ischemic disease, TLE = toxic
leukoencephalopathy, tumef = tumefactive.
Figure 6:
Confusion matrices show sources of diagnostic errors for artificial intelligence (AI) system and individual radiologists for each disease. By convention, true disease labels are shown along x-axis, and predictions are shown along y-axis, with color bar representing fraction of patients of true diagnosis where predicted disease was listed as top diagnosis (ie, columns add up to one). Perfect diagnostic algorithm would result in yellow squares along diagonal from top left to bottom right. At least two types of mistakes are seen both among radiologists and AI system, exemplified by white rectangles for AI system: confusion between similarly appearing diseases, and overdiagnosing certain diseases. Different individuals within a group make different mistakes, and fewer errors occur with increasing specialization. Act = active, ADEM = acute disseminated encephalomyelitis, ALD = adrenoleukodystrophy, CADASIL = cerebral autosomal dominant arteriopathy with subcortical infarcts and leukoencephalopathy, CNS = central nervous system, HG = high-grade, HIV enceph = human immunodeficiency virus encephalopathy, Inact = inactive, LG = low-grade, MS = multiple sclerosis, NMO = neuromyelitis optica, PML = progressive multifocal leukoencephalopathy, PRES = posterior reversible encephalopathy syndrome, SVID = small vessel ischemic disease, TLE = toxic leukoencephalopathy, tumef = tumefactive.

Comment in

References

    1. McBee MP, Awan OA, Colucci AT, et al . Deep Learning in Radiology . Acad Radiol 2018. ; 25 ( 11 ): 1472 – 1480 . - PubMed
    1. Shen D, Wu G, Suk HI. . Deep Learning in Medical Image Analysis . Annu Rev Biomed Eng 2017. ; 19 ( 1 ): 221 – 248 . - PMC - PubMed
    1. Chang PD, Kuoy E, Grinband J, et al . Hybrid 3D/2D Convolutional Neural Network for Hemorrhage Evaluation on Head CT . AJNR Am J Neuroradiol 2018. ; 39 ( 9 ): 1609 – 1616 . - PMC - PubMed
    1. Chilamkurthy S, Ghosh R, Tanamala S, et al . Deep learning algorithms for detection of critical findings in head CT scans: a retrospective study . Lancet 2018. ; 392 ( 10162 ): 2388 – 2396 . - PubMed
    1. Kuo W, Hӓne C, Mukherjee P, Malik J, Yuh EL. . Expert-level detection of acute intracranial hemorrhage on head computed tomography using deep learning . Proc Natl Acad Sci U S A 2019. ; 116 ( 45 ): 22737 – 22745 . - PMC - PubMed

Publication types