. 2020 Apr 7:9:e54100.
doi: 10.7554/eLife.54100.

Evolution of multifunctionality through a pleiotropic substitution in the innate immune protein S100A9

Affiliations

Evolution of multifunctionality through a pleiotropic substitution in the innate immune protein S100A9

Joseph L Harman et al. Elife. .

Abstract

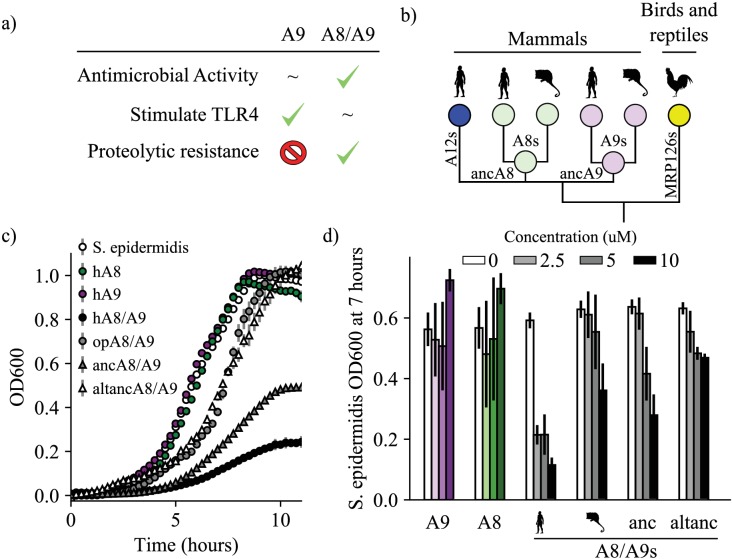
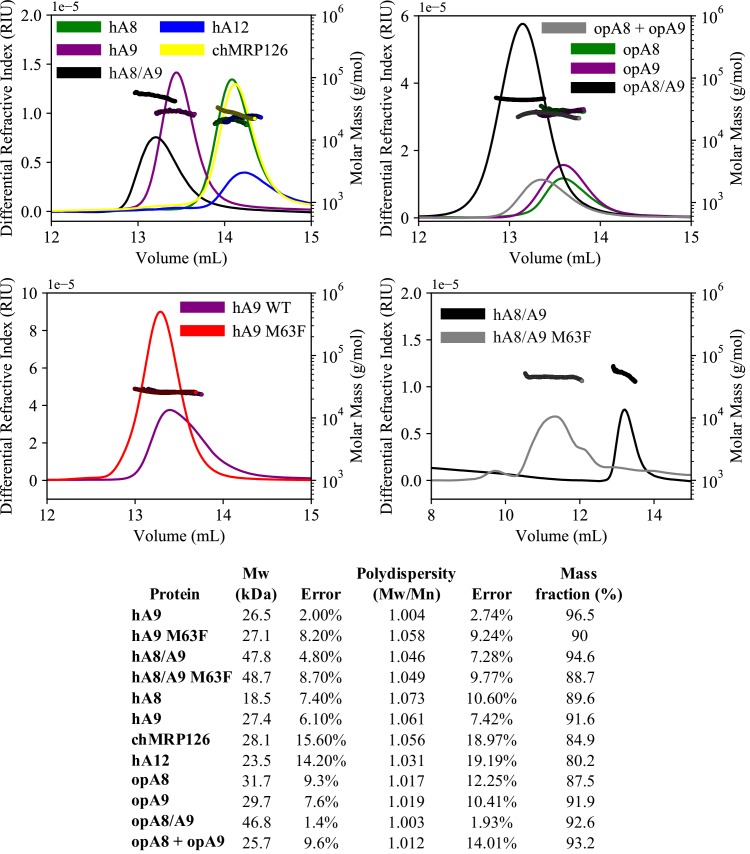
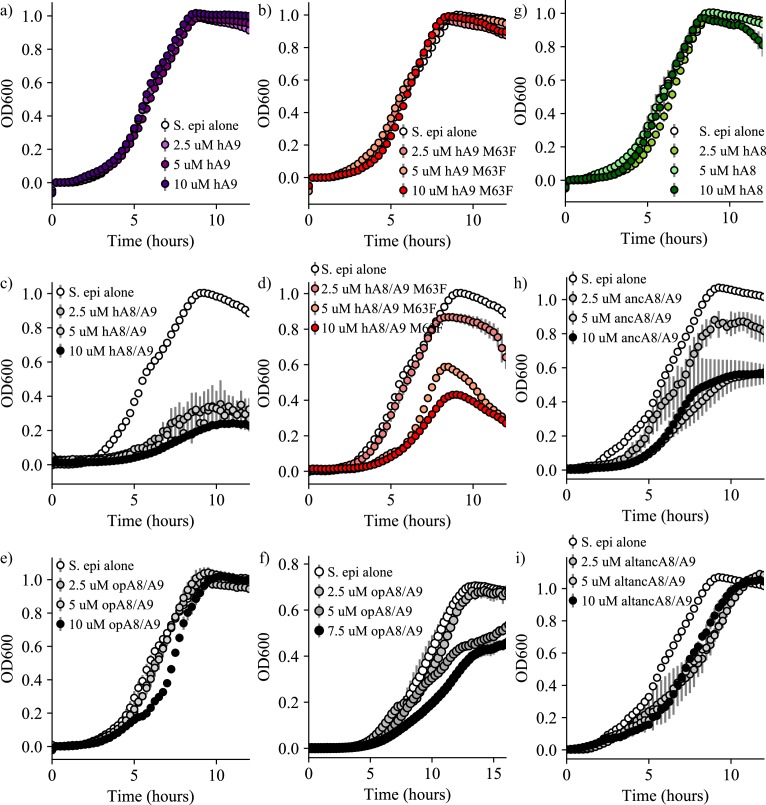
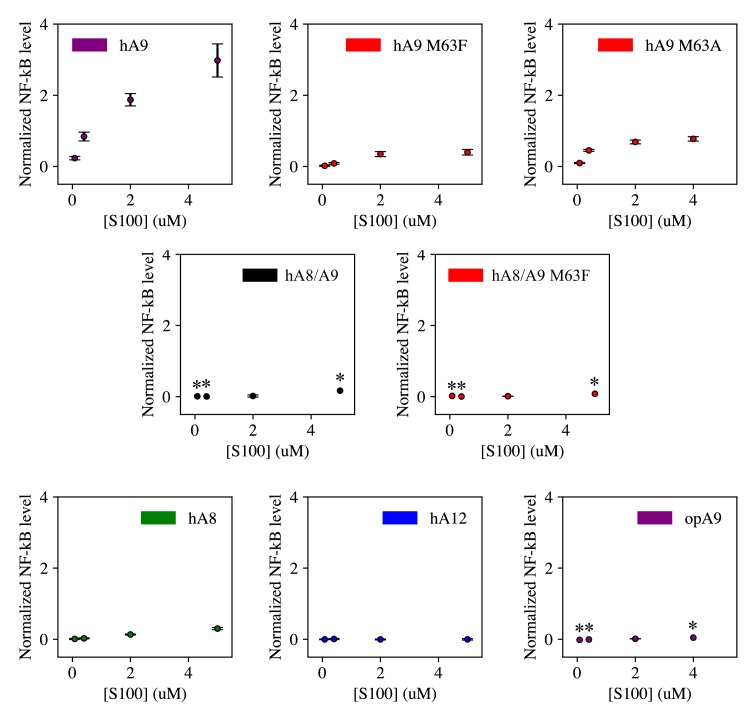
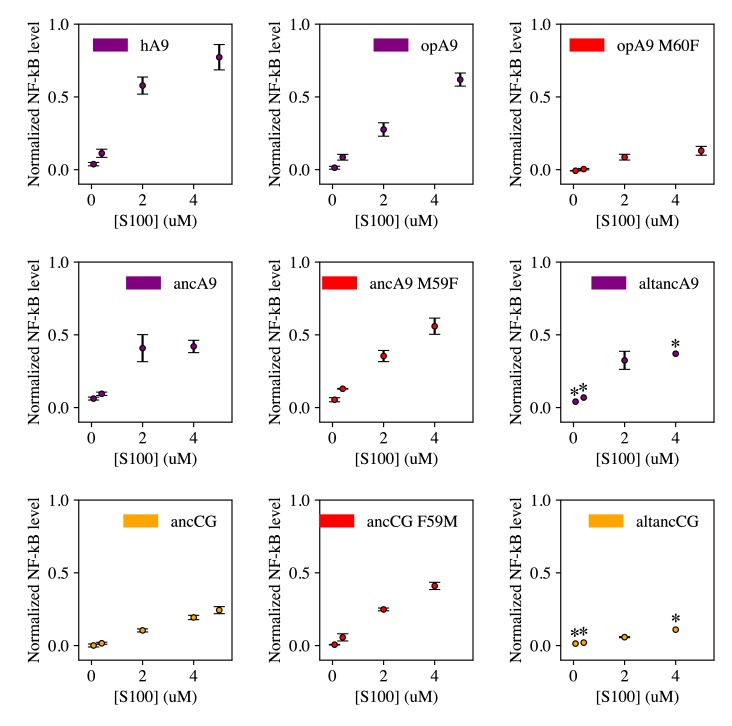
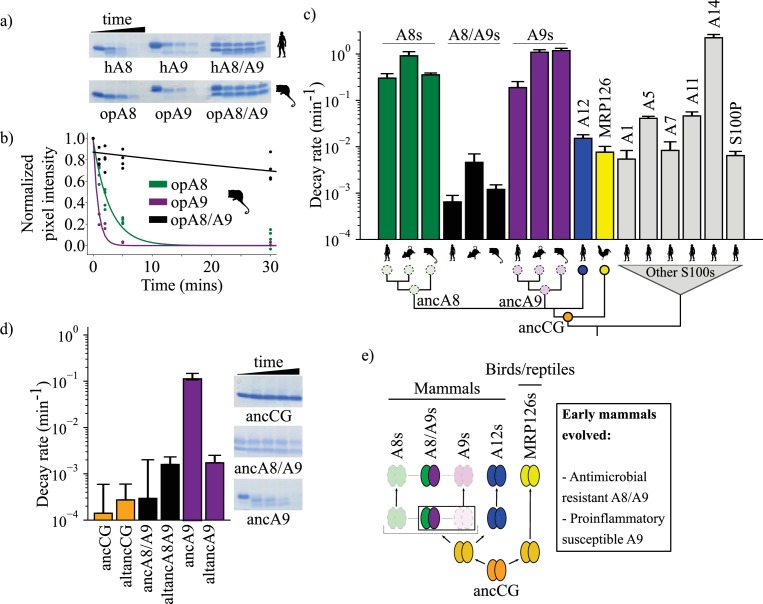
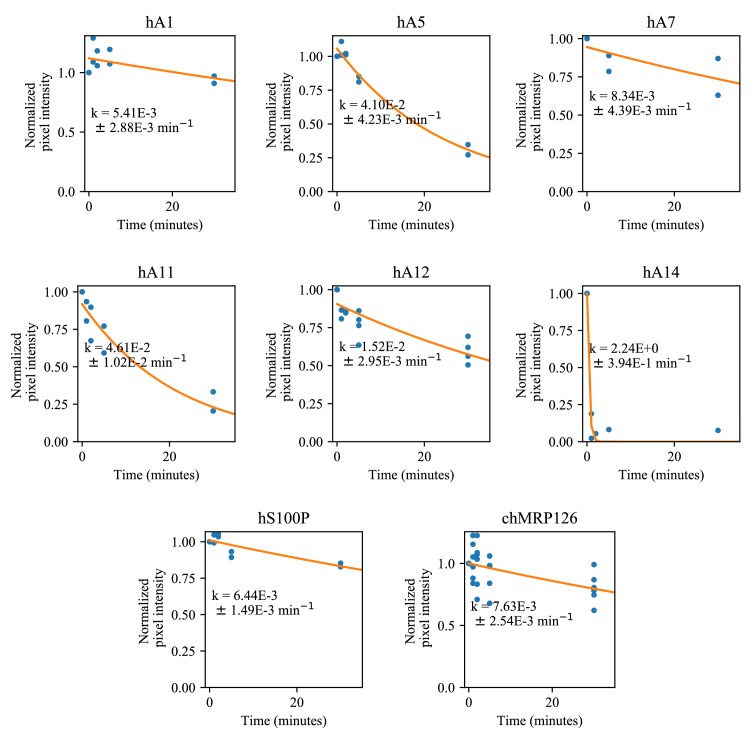
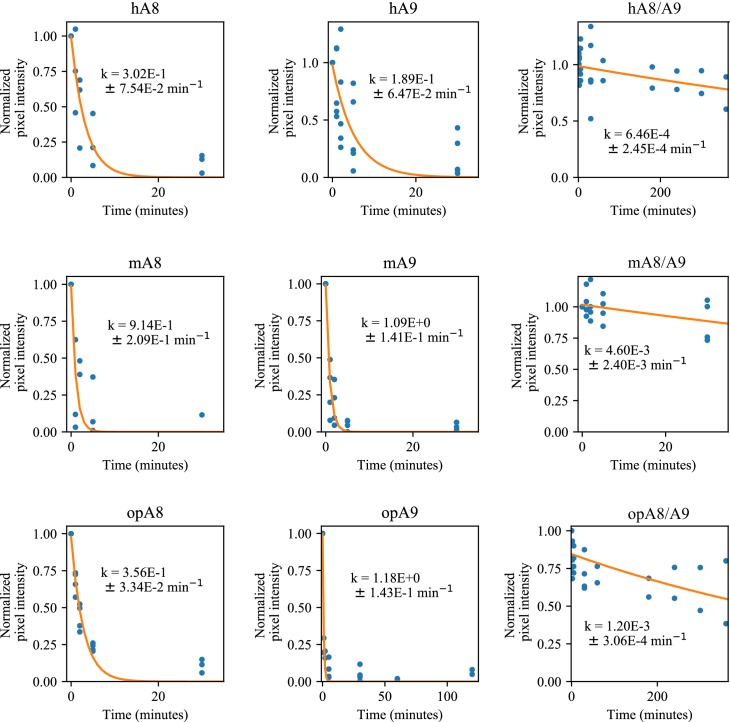
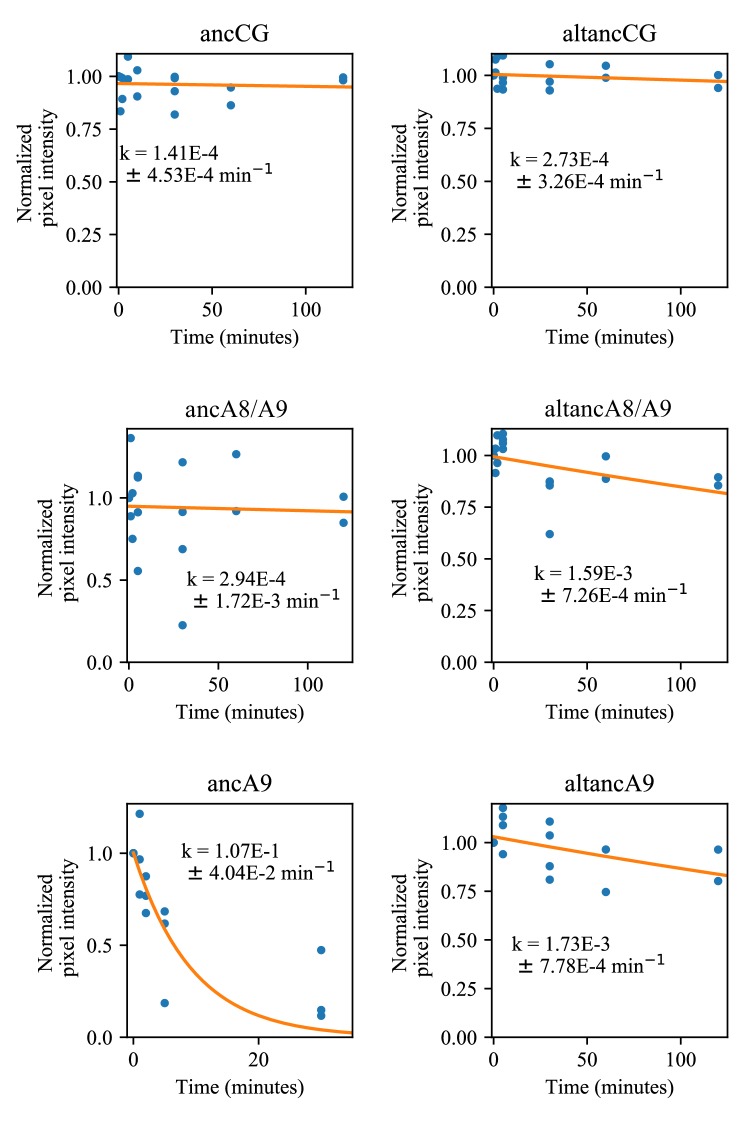
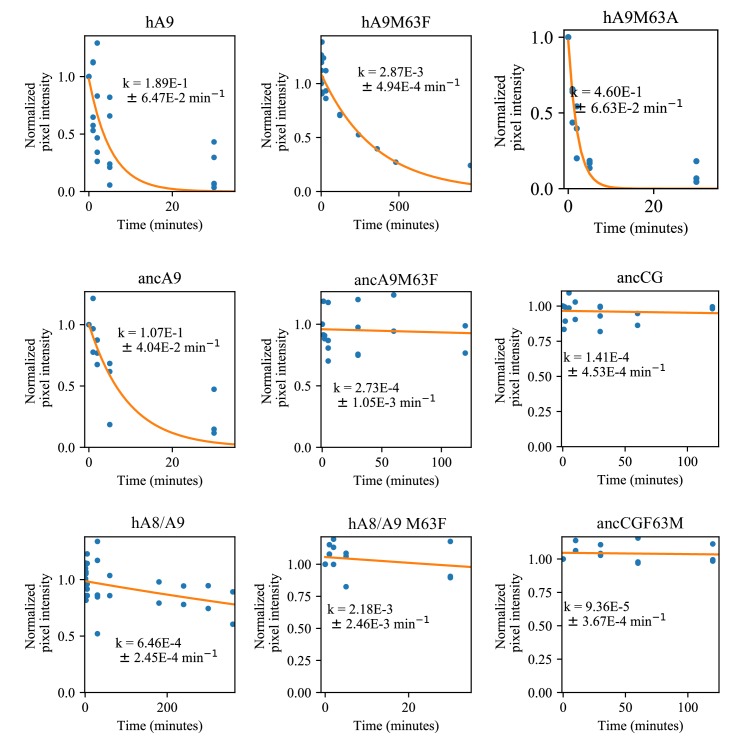
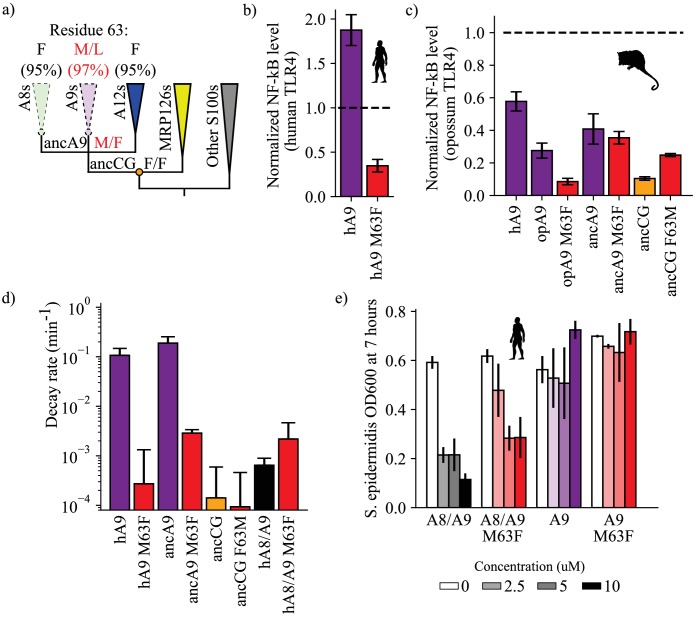
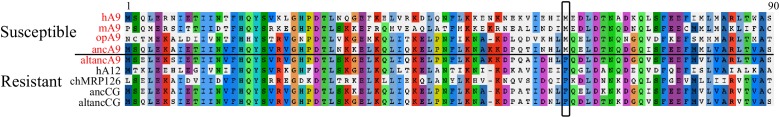
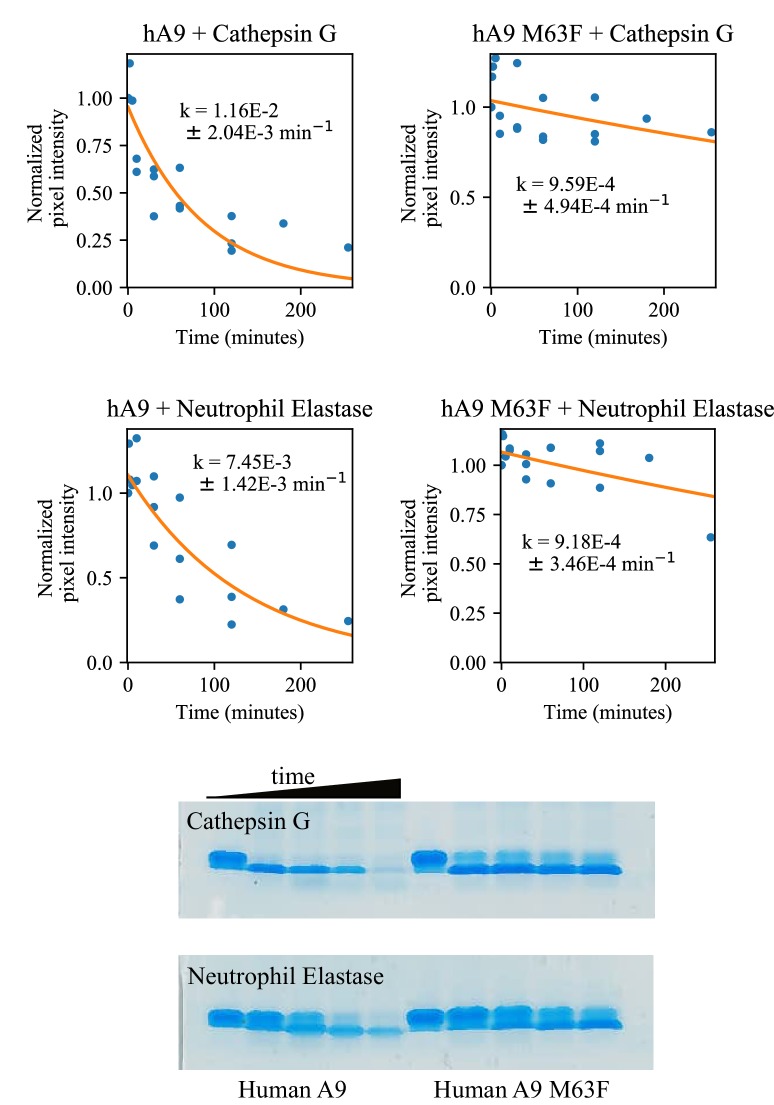
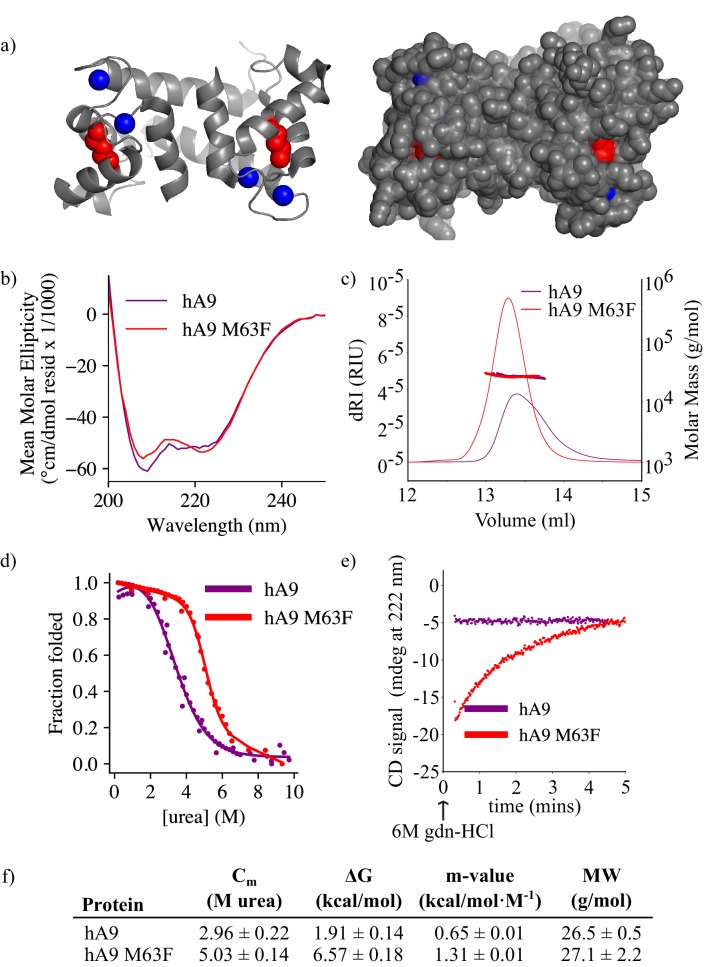
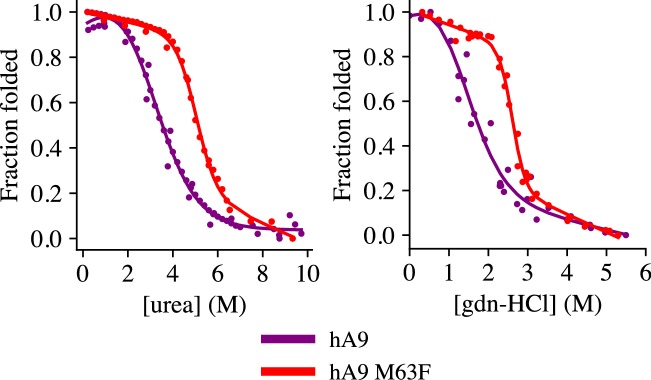
Multifunctional proteins are evolutionary puzzles: how do proteins evolve to satisfy multiple functional constraints? S100A9 is one such multifunctional protein. It potently amplifies inflammation via Toll-like receptor four and is antimicrobial as part of a heterocomplex with S100A8. These two functions are seemingly regulated by proteolysis: S100A9 is readily degraded, while S100A8/S100A9 is resistant. We take an evolutionary biochemical approach to show that S100A9 evolved both functions and lost proteolytic resistance from a weakly proinflammatory, proteolytically resistant amniote ancestor. We identify a historical substitution that has pleiotropic effects on S100A9 proinflammatory activity and proteolytic resistance but has little effect on S100A8/S100A9 antimicrobial activity. We thus propose that mammals evolved S100A8/S100A9 antimicrobial and S100A9 proinflammatory activities concomitantly with a proteolytic 'timer' to selectively regulate S100A9. This highlights how the same mutation can have pleiotropic effects on one functional state of a protein but not another, thus facilitating the evolution of multifunctionality.

Keywords: ancestral sequence reconstruction; antimicrobial activity; biochemistry; chemical biology; evolutionary biology; inflammation; mammals; none; pleiotropy; protein evolution.

Plain language summary

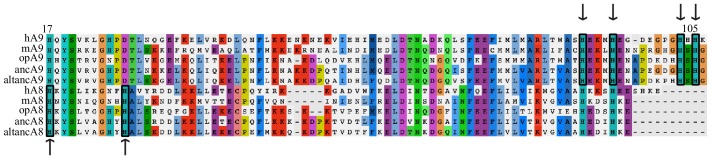
A single protein sometimes does multiple jobs. For instance, our immune system uses a small number of multipurpose proteins to respond quickly to a large number of threats. One example is the protein S100A9. It acts as an antimicrobial by preventing microbes from getting the nutrients they need, while also stimulating inflammation by inducing the release of molecules that recruit white blood cells. S100A9, like all proteins, is made up of a chain of small building blocks. These building blocks interact with each other and with other molecules in the environment. The sequence of the building blocks thus determines what jobs the protein can do. Therefore, a single change to the sequence of building blocks can have a dramatic effect: one change might render the protein faulty, while another change might allow it to do a new job. Proteins face similar challenges humans do when trying to do several things at once. A person driving a car while using their phone will not do either task well. Likewise, a protein that does two jobs faces challenges a single-purpose protein does not. Harman et al. were interested in how S100A9 was able to evolve and maintain its dual functionality, despite this potential problem. They started by asking when S100A9 acquired its two purposes. They measured the antimicrobial and inflammatory activity of S100A9 proteins from humans, mice and opossums. The activities of S100A9 in these species was similar, suggesting that S100A9 acquired its different jobs in the ancestor of mammals, some 160 million years ago. Next, Harman et al. computationally reconstructed ancestral forms of S100A9 by comparing hundreds of similar proteins and building an evolutionary tree. They then measured the antimicrobial and inflammatory activity of these ancestral proteins. By comparing the last ancestor that did not have these activities to the first ancestor that did, they identified the sequence changes that gave S100A9 its dual activity. Importantly, these changes are located in separate regions of the protein, meaning they could occur independently, without affecting each other. Further, the same sequence change that converted S100A9 into an inflammatory signal also introduced a mechanism to regulate this activity. The results suggest that a small number of sequence changes – or even a single change – can make a protein more versatile. This means that evolving multipurpose proteins may not be as difficult as is often thought.


Conflict of interest statement

JH, AL, GW, MH, KL, MH No competing interests declared

Figures

Figure 1.
Figure 1.. A9s evolved to form the antimicrobial A8/A9 complex early in mammals.
(a) Table of A9 and A8/A9 properties. ‘~” represents weak or ambiguously characterized function, check marks and red ‘X’ represent confirmed property (check) or lack thereof (‘x’). (b) Schematic of previously published S100 protein tree. Colored nodes represent single protein sequences. Species cartoons shown are human, opossum, and chicken. Ancestrally reconstructed protein nodes are labeled. Branch lengths not to scale. (c) Representative growth curves for Staphylococcus epidermidis in the presence or absence of 10 μM S100 proteins. Each point represents optical density at 600 nm. S. epidermidis growth alone and in the presence of modern proteins are shown as circles, growth in the presence of ancestrally reconstructed proteins shown as triangles. Error bars are standard deviation of three technical replicates. (d) Percent of untreated S. epidermidis growth at 12 hr with S100 protein treatments. Data are average of three biological replicates. Error bars are standard error of the mean. Species cartoon labels are the same as in (b).
Figure 1—figure supplement 1.
Figure 1—figure supplement 1.. The residues composing the A8/A9 hexastidine site are conserved across mammalian and ancestrally reconstructed A8s and A9s.
Human (h), mouse (m), opossum (op), maximum likelihood therian mammalian ancestors (anc), and AltAll ancestors (altanc) shown. Alignment truncated to show conservation of key hexahistidine site metal- binding residues (boxed + arrows). A8s conserve two (positions 17 and 27 in human A8), while A9s conserve four (positions 91, 95, 103, and 105 of human A9). Consensus residues for alignment are highlighted.
Figure 1—figure supplement 2.
Figure 1—figure supplement 2.. Analysis of protein oligomeric state using SECMALS.
Differential refractive index (left y-axis, lines) and calculated molecular weights from light scattering detectors (right y-axis, points) for modern S100 proteins used in this study. h = human, op = opossum, ch = chicken species. Opossum A8 + A9 sample is an equimolar mixture of opossum A8 and A9 homodimers. Table below shows summary data calculated using Wyatt Astra software.
Figure 1—figure supplement 3.
Figure 1—figure supplement 3.. Bacterial growth in the presence of S100 proteins.
Representative S. epidermidis growth curves in the presence of (a) human A9, (b) human A9 M63F, (c) human A8/A9, (d) human A8/A9 M63F, (e) opossum A8/A9 (cysteine-free), (f) opossum A8/A9 (containing cysteines), (g) ancA8/A9, and h) altancA8/A9. Error bars are the standard deviation for three technical replicates, points show one representative biological replicate for each protein at four different concentrations.
Figure 1—figure supplement 4.
Figure 1—figure supplement 4.. Statistics for ancestrally reconstructed proteins.
Figure 1—figure supplement 5.
Figure 1—figure supplement 5.. Secondary structure characterization of ancestrally reconstructed S100s by CD spectroscopy.
Data shown are the average of 3 scans. Solid lines are maximum likelihood ancestral proteins, dotted lines are alt-all ancestors (colored the same as matching maximum likelihood ancestor for comparison).
Figure 2.
Figure 2.. A9s gained proinflammatory activity from a weakly proinflammatory ancestor.
(a) Schematic of previously measured proinflammatory activity of S100s against various TLR4s. Species labels on x and y-axes of heatmap are the same as Figure 1. Heatmap coloring is scaled to match 2 μM S100 activity levels measured in supplementary figure S2 of Loes et al. (2018). (b) and (c) NF-κB production of human and opossum TLR4 in response to treatment with modern and ancestral S100 proteins. Bars represent average of >3 biological replicates, error bars are standard error of the mean. All values are background-subtracted and normalized to LPS positive control (see methods).
Figure 2—figure supplement 1.
Figure 2—figure supplement 1.. Analysis of S100 protein LPS contamination.
Top panel: Activity of LPS (0.2 ng/µl) against human (left) and opossum TLR4 (right) is inhibited by the addition of Polymyxin B (PB, 0.2 µg/µl). Middle and bottom panels: S100 activation of human (middle) and opossum (bottom) TLR4 with no PB, 0.2 µg/µl PB (+) and 0.25 µg/µl PB (++). No-PB data were not collected for hA9, opA9, and opA9 M60F against opossum TLR4 (bottom panel). Data were background-subtracted using the LPS + PB control and normalized to LPS activity against either human or opossum TLR4. Error bars are standard deviation.
Figure 2—figure supplement 2.
Figure 2—figure supplement 2.. Dose curves for S100 activation of human TLR4.
Points are the average of >3 biological replicates each consisting of 3 technical triplicates, error bars are standard error of the mean. An asterisk (*) indicates a concentration at which a single biological replicate was measured. Data were background-subtracted using the LPS + PB control and normalized to LPS activity against human TLR4.
Figure 2—figure supplement 3.
Figure 2—figure supplement 3.. Dose curves for S100 activation of opossum TLR4.
Points are the average of >3 biological replicates each consisting of 3 technical triplicates, error bars are standard error of the mean. An asterisk (*) indicates a concentration at which a single biological replicate was measured. Data were background-subtracted using the LPS + PB control and normalized to LPS activity against opossum TLR4.
Figure 3.
Figure 3.. A9s lost proteolytic resistance from a proteolytically resistant amniote ancestor.
(a) In vitro proteolytic resistance assay showing SDS-PAGE gel of S100 protein degradation via proteinase K over time. Gels were quantified using densitometry and normalized to the undigested protein band intensity. (b) A single exponential decay model was globally fit to the data to quantify decay rates. Points are biological replicates, lines are model fit to data. (c) S100 protein proteolysis rates mapped onto schematized S100 phylogeny. X-axis cartoon labels same as in Figure 1. Circles indicate proteolytic susceptibility (faded/dashed) and resistance (solid), with predicted resistance shown for ancA8, ancA9, and ancCG nodes. (d) Decay rates for ancestrally reconstructed proteins, with gels shown on the right. For panels (c) and (d), error bars are the square root of the diagonalized covariance matrix from the fit and the y-axis is in log scale. (e) Summary model for proposed evolution of A9 and A8/A9 innate immune properties. Box around A8/A9 and A9 indicate location in tree (ancestor of therian mammals) where immune functions evolved.
Figure 3—figure supplement 1.
Figure 3—figure supplement 1.. Survey of proteolytic susceptibility across modern S100 proteins.
Blue dots are biological replicates, orange line is a single exponential decay fit (see methods). Protein is listed at the top. Pixel intensity was quantified by densitometry from SDS-PAGE gels.
Figure 3—figure supplement 2.
Figure 3—figure supplement 2.. Comparison of proteolytic susceptibility for A8s, A9s, and A8/A9 complexes across mammals.
Blue dots are biological replicates, orange line is a single exponential decay fit (see methods). Protein is listed at the top. Pixel intensity was quantified by densitometry from SDS-PAGE gels. Longer time points were collected for proteins with slower degradation rates (see x-axis).
Figure 3—figure supplement 3.
Figure 3—figure supplement 3.. Comparison of proteolytic susceptibility for ancestrally reconstructed S100s.
Blue dots are biological replicates, orange line is a single exponential decay fit (see methods). Protein is listed at the top. Pixel intensity was quantified by densitometry from SDS-PAGE gels. Longer time points were collected for proteins with slower degradation rates (see x-axis).
Figure 3—figure supplement 4.
Figure 3—figure supplement 4.. Comparison of proteolytic S100 protein mutants at position 63.
Blue dots are biological replicates, orange line is a single exponential decay fit (see methods). Protein is listed at the top. Pixel intensity was quantified by densitometry from SDS-PAGE gels. Longer time points were collected for proteins with slower degradation rates (see x-axis).
Figure 4.
Figure 4.. A single historical substitution affects A9 proinflammatory activity and proteolytic resistance without affecting A8/A9 proteolytic resistance or antimicrobial activity.
(a) Schematic S100 phylogenetic tree with the amino acid state of position 63 shown at key nodes. Wedges represent clades, colored as in Figure 1. Lines indicate proteolytic susceptibility (faded/dashed) and resistance (solid). Circles indicate characterized ancestors. Amino acid labels represent maximum likelihood state/alternate amino acid state for position 63 at ancestral nodes, while labels at clade tips represent percent conservation across modern S100 protein sequences. (b–c) NF-κB production of S100 point mutants at position 63 against human (b) and opossum (c) TLR4. (d) Proteolysis rates for S100 point mutants at position 63 (human A9 numbering). Error bars and y-axis are the same as in Figure 1. (e) Antimicrobial activity of hA9 and hA8/A9 with and without M63F mutation against S. epidermidis. Axes and error bars same as in Figure 1d.
Figure 4—figure supplement 1.
Figure 4—figure supplement 1.. Changes at position 63 correlate with A9 proinflammatory activity and proteolytic resistance.
S100 protein sequences are grouped into proteolytically susceptible (top) or resistant and potently proinflammatory (red text) or not (black text). Only the first 90 residues out of 114 total were examined as the disordered A9 tail (residues ~ 93–114) are highly variable and the tail is dispensable for A9 proinflammatory activity. Residues are colored when found to be the consensus residue for a column.
Figure 4—figure supplement 2.
Figure 4—figure supplement 2.. Comparison of human A9 and human A9 M63F proteolytic resistance against human proteases.
Blue dots are biological replicates, orange line is a single exponential decay fit (see methods). Protein is listed at the top of each graph. Pixel intensity was quantified by densitometry from SDS-PAGE gels. Longer time points were collected for proteins with slower degradation rates (see x-axis). Representative SDS-PAGE gels are shown for 0–120 min digestion with each protease.
Figure 5.
Figure 5.. M63F increases human A9 apparent stability by decreasing its unfolding rate.
(a) Crystal structure of hA9 (PDB entry 1irj) (Itou et al., 2002). Cartoon depiction left, surface view right. Calcium ions are blue spheres. M63 is highlighted in red – two total for homodimeric A9. (b) Far-UV circular dichroism (CD) spectroscopy scans of hA9 and hA9 M63F. Data represent average of 3 scans. (c) SEC MALS analysis of hA9 and hA9 M63F oligomeric state. Solid lines are refractive index (left y-axis), points and molecular weights in table below represent molar mass calculated from light scattering detectors using ASTRA software (right y-axis - see methods). (d) Equilibrium chemical denaturation (urea) of 5 µM hA9 and hA9 M63F monitored by CD at 222 nm. Solid lines represent two-state unfolding model fit to data. (e) Kinetics of hA9 and hA9 M63F unfolding via chemical denaturation (guanidinium hydrochloride). Graph depicts one representative unfolding experiment. (f) Thermodynamic parameters estimated from (d) and molecular weights estimated from (c). Errors are standard deviations calculated from fit (see methods).
Figure 5—figure supplement 1.
Figure 5—figure supplement 1.. Chemical denaturation of hA9 and hA9 M63F.
Chemical denaturation experiments using urea (left) and guanidinium hydrochloride (right). Graphs represent >3 replicates. Human A9 is shown in purple, A9 M63F in red. An apparent two-state unfolding model was fit to the data to estimate thermodynamic parameters, shown as a solid line.
Figure 5—figure supplement 2.
Figure 5—figure supplement 2.. Unfolding kinetics of hA9 and hA9 M63F.
Time course measurement of hA9 (top) and hA9 M63F (bottom) unfolding upon addition of 6M gdn-HCl. Each curve is a single replicate at one concentration, monitoring CD signal at 222 nm (y-axis).
Figure 6.
Figure 6.. Proteolysis is not required for A9 activation of TLR4.
(a) Proteolytic decay rates for human point mutants at position 63. Error bars and axes are the same as in Figure 3. (b) NF-κB production of human TLR4 in response to treatment with hA9, hA9 M63F, and hA9 M63A. Error bars the same as in Figure 2. (c) Western blot of hA9 and position 63 point mutants before and after proinflammatory activity assay. Left bands represent 10 and 15 kDa ladder. (d) NF-κB production of human TLR4 in response to hA9 and hA9 M63F pre-proteolyzed with proteinase K for increasing amounts of time. Points are biological replicates and are the average of three technical replicates. Western blots below depict the amount of full-length A9 remaining over time. Left blot shows antibody sensitivity to A9, right shows digestion time course samples. Ladder and antibody same as in (c).

Similar articles

Cited by

References

    1. Anderson JA, Loes AN, Waddell GL, Harms MJ. Tracing the evolution of novel features of human toll‐like receptor 4. Protein Science : A Publication of the Protein Society. 2019;28:1350–1358. doi: 10.1002/pro.3644. - DOI - PMC - PubMed
    1. Auvynet C, Rosenstein Y. Multifunctional host defense peptides: antimicrobial peptides, the small yet big players in innate and adaptive immunity: amps, the small yet big players of immunity. The FEBS Journal. 2009;276:6497–6508. doi: 10.1111/j.1742-4658.2009.07360.x. - DOI - PubMed
    1. Averill MM, Kerkhoff C, Bornfeldt KE. S100A8 and S100A9 in cardiovascular biology and disease. Arteriosclerosis, Thrombosis, and Vascular Biology. 2012;32:223–229. doi: 10.1161/ATVBAHA.111.236927. - DOI - PMC - PubMed
    1. Baker TM, Nakashige TG, Nolan EM, Neidig ML. Magnetic circular dichroism studies of iron(ii) binding to human calprotectin. Chemical Science. 2017;8:1369–1377. doi: 10.1039/c6sc03487j. - DOI - PMC - PubMed
    1. Bals R, Wilson JM. Cathelicidins--a family of multifunctional antimicrobial peptides. Cellular and Molecular Life Sciences. 2003;60:711–720. doi: 10.1007/s00018-003-2186-9. - DOI - PMC - PubMed

Publication types