

A Quantile-Based g-Computation Approach to Addressing the Effects of Exposure Mixtures
- PMID: 32255670
- PMCID: PMC7228100
- DOI: 10.1289/EHP5838
A Quantile-Based g-Computation Approach to Addressing the Effects of Exposure Mixtures
Abstract
Background: Exposure mixtures frequently occur in data across many domains, particularly in the fields of environmental and nutritional epidemiology. Various strategies have arisen to answer questions about exposure mixtures, including methods such as weighted quantile sum (WQS) regression that estimate a joint effect of the mixture components.
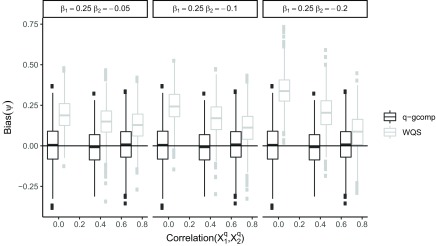
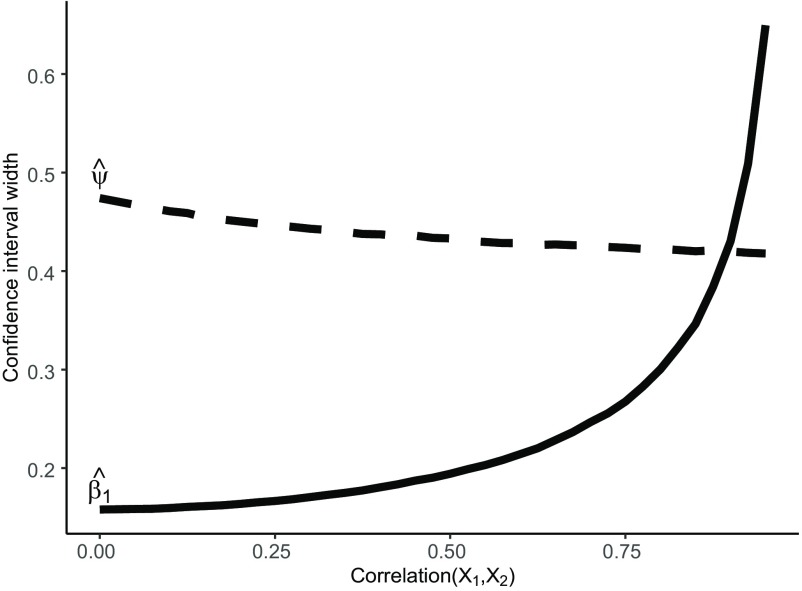
Objectives: We demonstrate a new approach to estimating the joint effects of a mixture: quantile g-computation. This approach combines the inferential simplicity of WQS regression with the flexibility of g-computation, a method of causal effect estimation. We use simulations to examine whether quantile g-computation and WQS regression can accurately and precisely estimate the effects of mixtures in a variety of common scenarios.
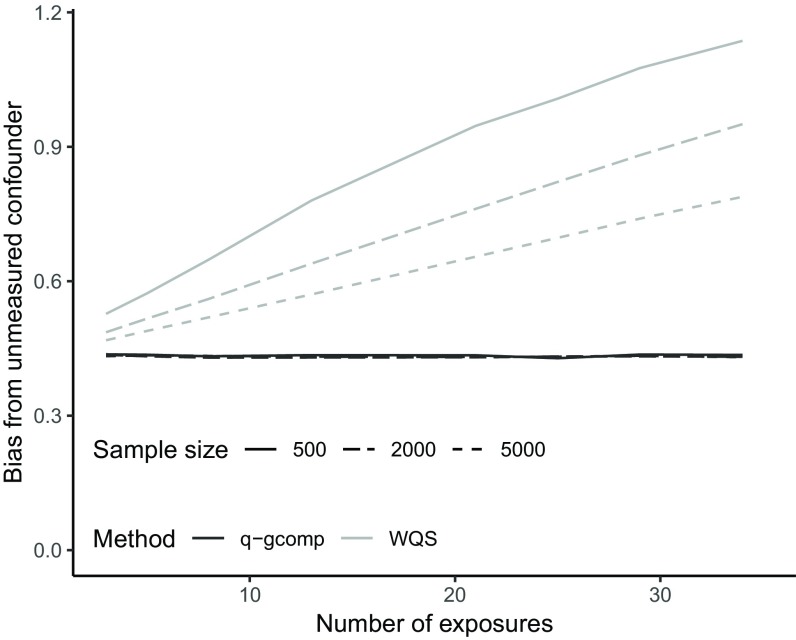
Methods: We examine the bias, confidence interval (CI) coverage, and bias-variance tradeoff of quantile g-computation and WQS regression and how these quantities are impacted by the presence of noncausal exposures, exposure correlation, unmeasured confounding, and nonlinearity of exposure effects.
Results: Quantile g-computation, unlike WQS regression, allows inference on mixture effects that is unbiased with appropriate CI coverage at sample sizes typically encountered in epidemiologic studies and when the assumptions of WQS regression are not met. Further, WQS regression can magnify bias from unmeasured confounding that might occur if important components of the mixture are omitted from the analysis.
Discussion: Unlike inferential approaches that examine the effects of individual exposures while holding other exposures constant, methods like quantile g-computation that can estimate the effect of a mixture are essential for understanding the effects of potential public health actions that act on exposure sources. Our approach may serve to help bridge gaps between epidemiologic analysis and interventions such as regulations on industrial emissions or mining processes, dietary changes, or consumer behavioral changes that act on multiple exposures simultaneously. https://doi.org/10.1289/EHP5838.
Figures
Comment in
-
Quantile g-Computation: A New Method for Analyzing Mixtures of Environmental Exposures.Environ Health Perspect. 2020 Oct;128(10):104004. doi: 10.1289/EHP7342. Epub 2020 Oct 19. Environ Health Perspect. 2020. PMID: 33074735 Free PMC article.
-
Response to "Comment on 'A Quantile-Based g-Computation Approach to Addressing the Effects of Exposure Mixtures'".Environ Health Perspect. 2021 Mar;129(3):38002. doi: 10.1289/EHP8820. Epub 2021 Mar 10. Environ Health Perspect. 2021. PMID: 33688745 Free PMC article. No abstract available.
-
Comment on "A Quantile-Based g-Computation Approach to Addressing the Effects of Exposure Mixtures".Environ Health Perspect. 2021 Mar;129(3):38001. doi: 10.1289/EHP8739. Epub 2021 Mar 10. Environ Health Perspect. 2021. PMID: 33688746 Free PMC article. No abstract available.
References
Publication types
MeSH terms
Substances
Grants and funding
LinkOut - more resources
Full Text Sources
Miscellaneous