Comparative Study
. 2020 Jul 15;202(2):259-274.
doi: 10.1164/rccm.201906-1199OC.

Functional Genomics of the Pediatric Obese Asthma Phenotype Reveal Enrichment of Rho-GTPase Pathways

Affiliations
Comparative Study

Functional Genomics of the Pediatric Obese Asthma Phenotype Reveal Enrichment of Rho-GTPase Pathways

Deepa Rastogi et al. Am J Respir Crit Care Med. .

Abstract

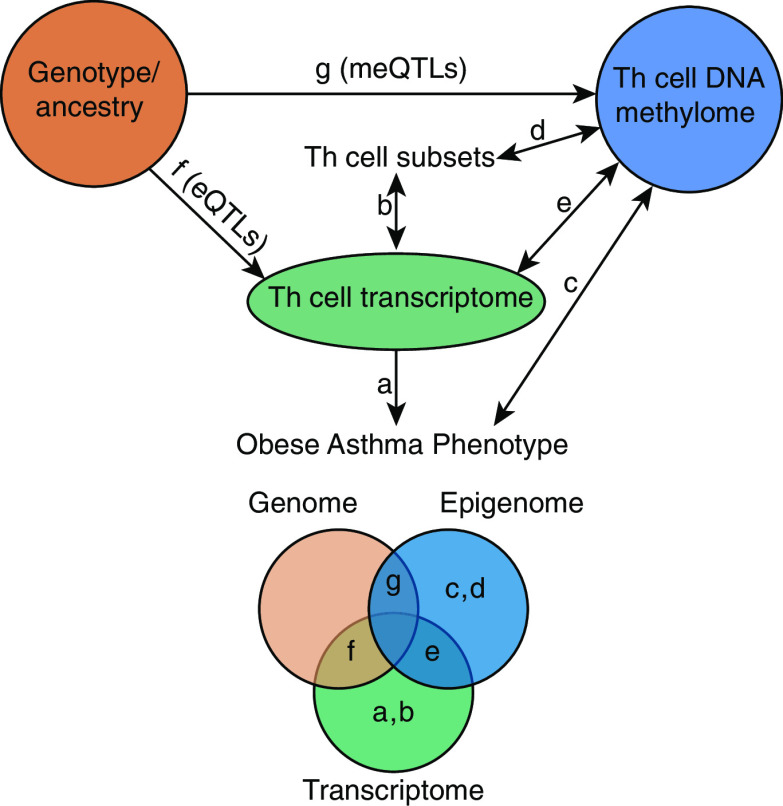
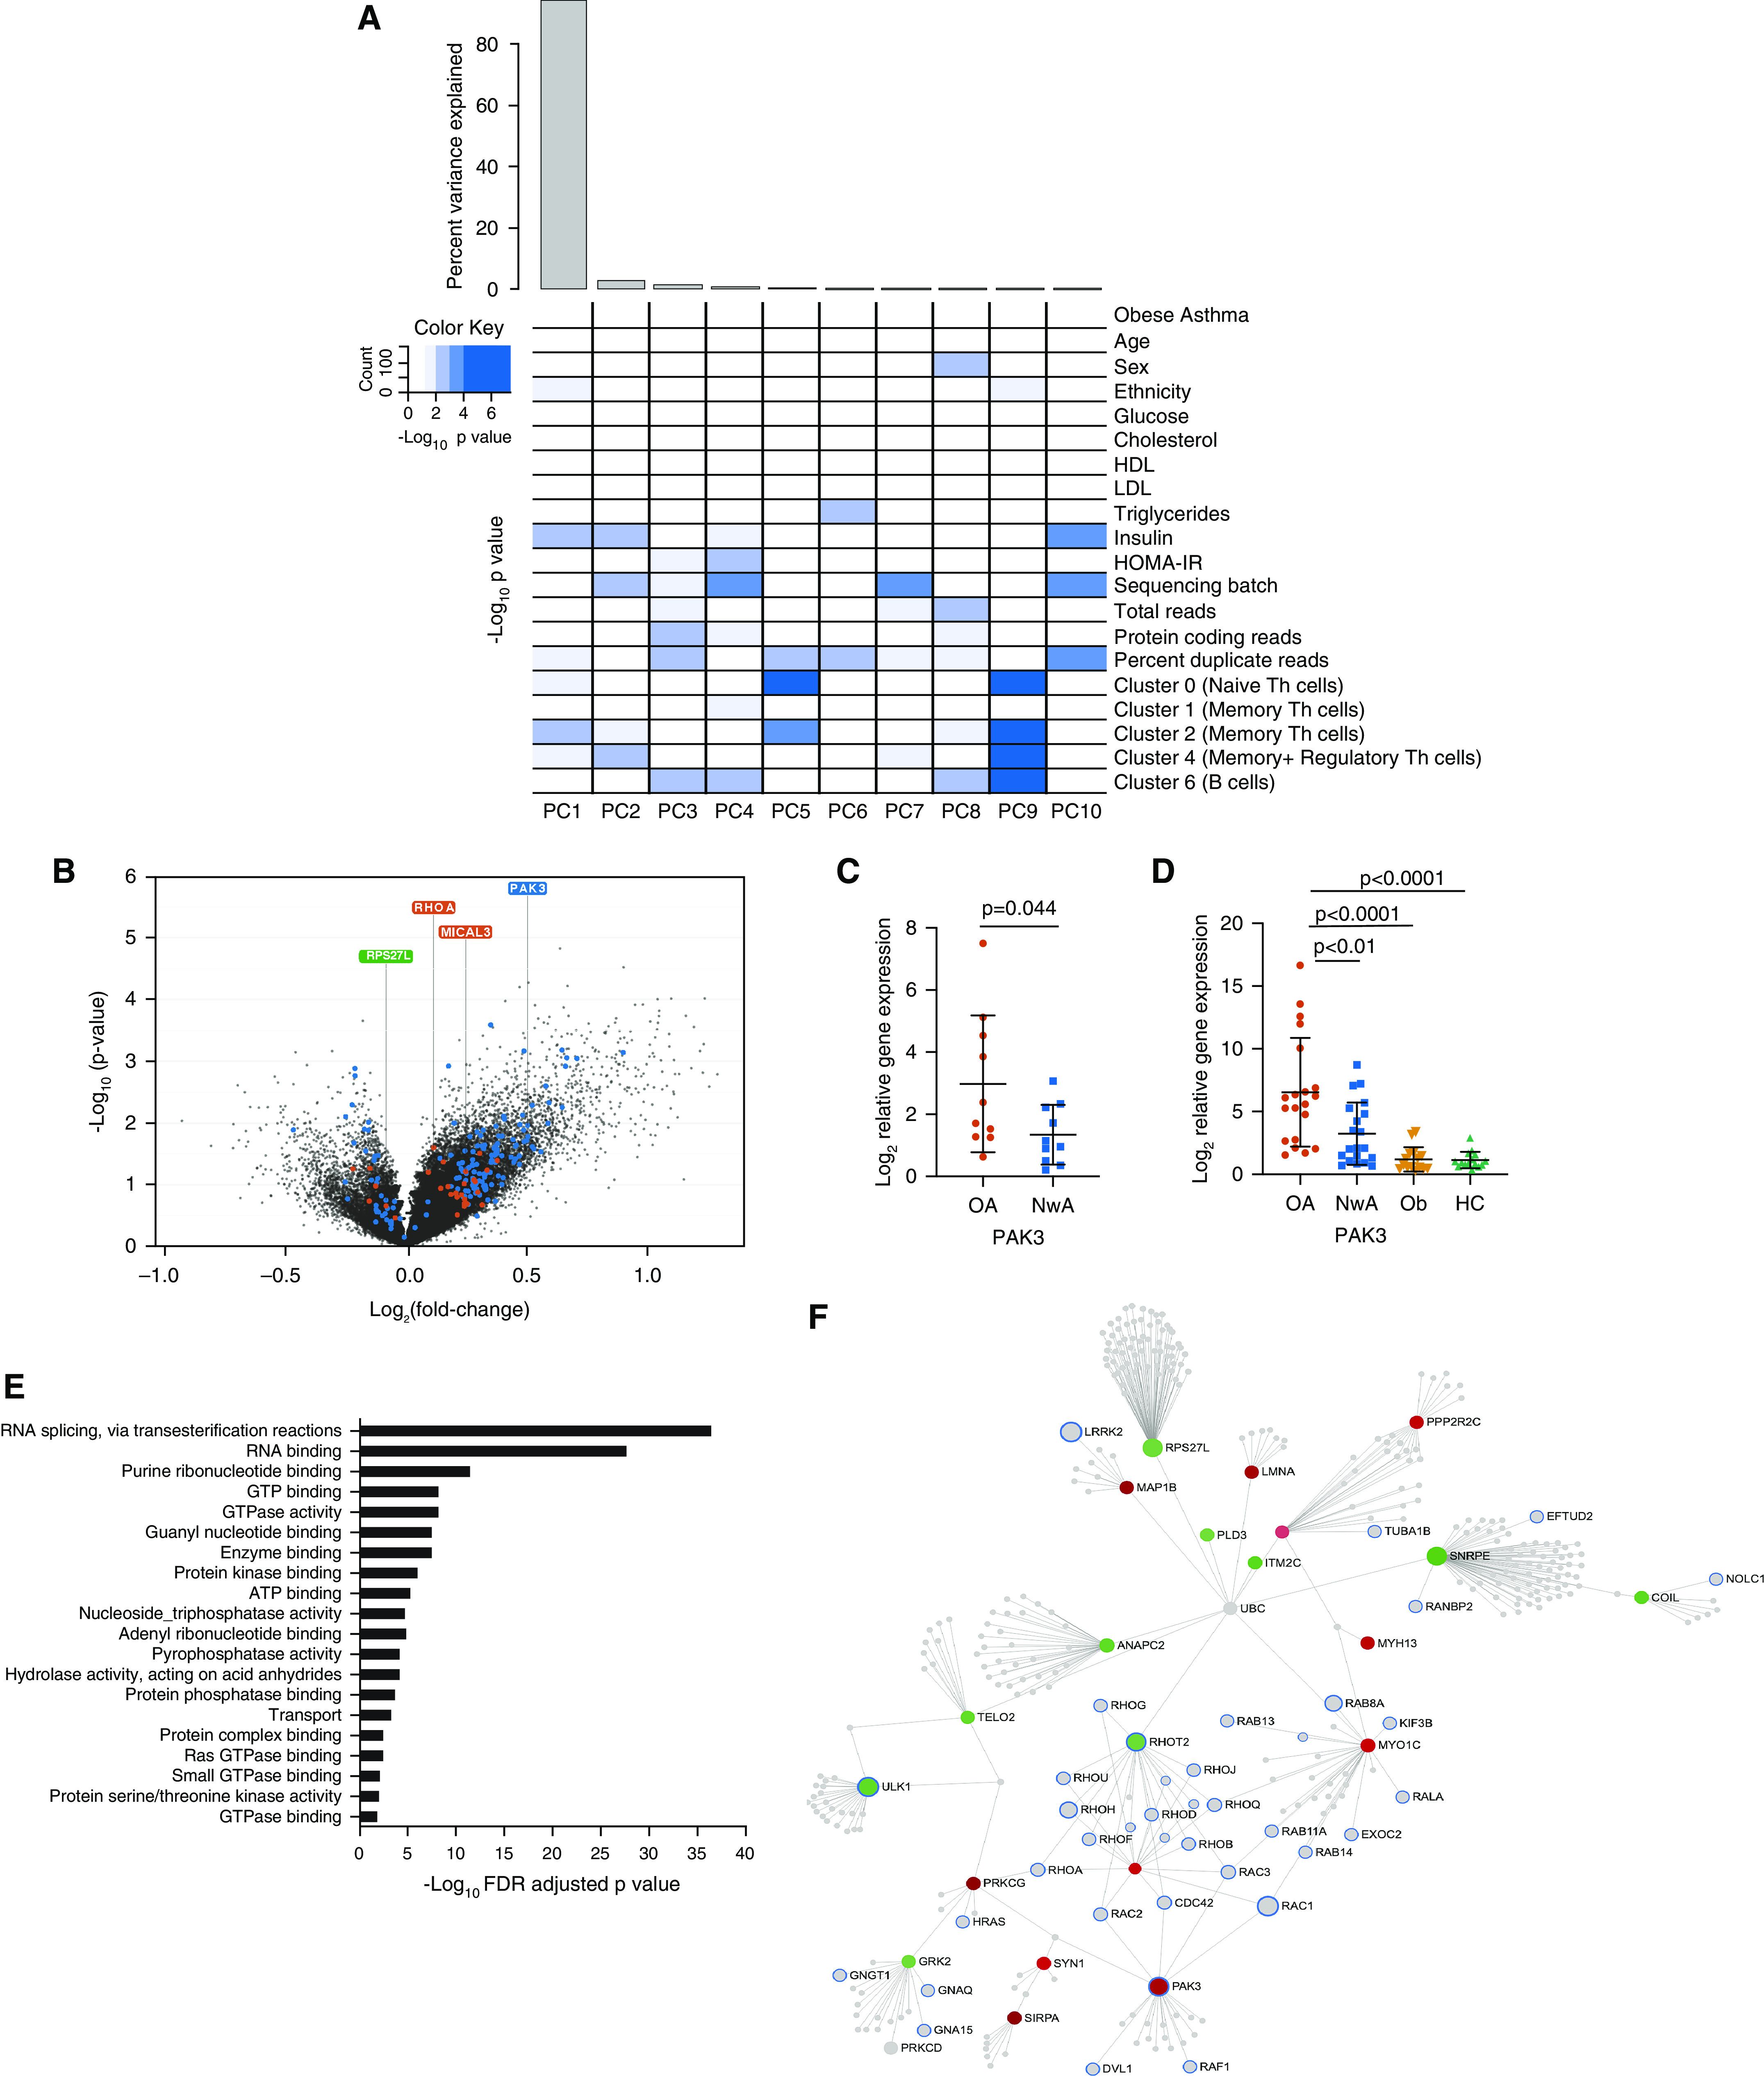
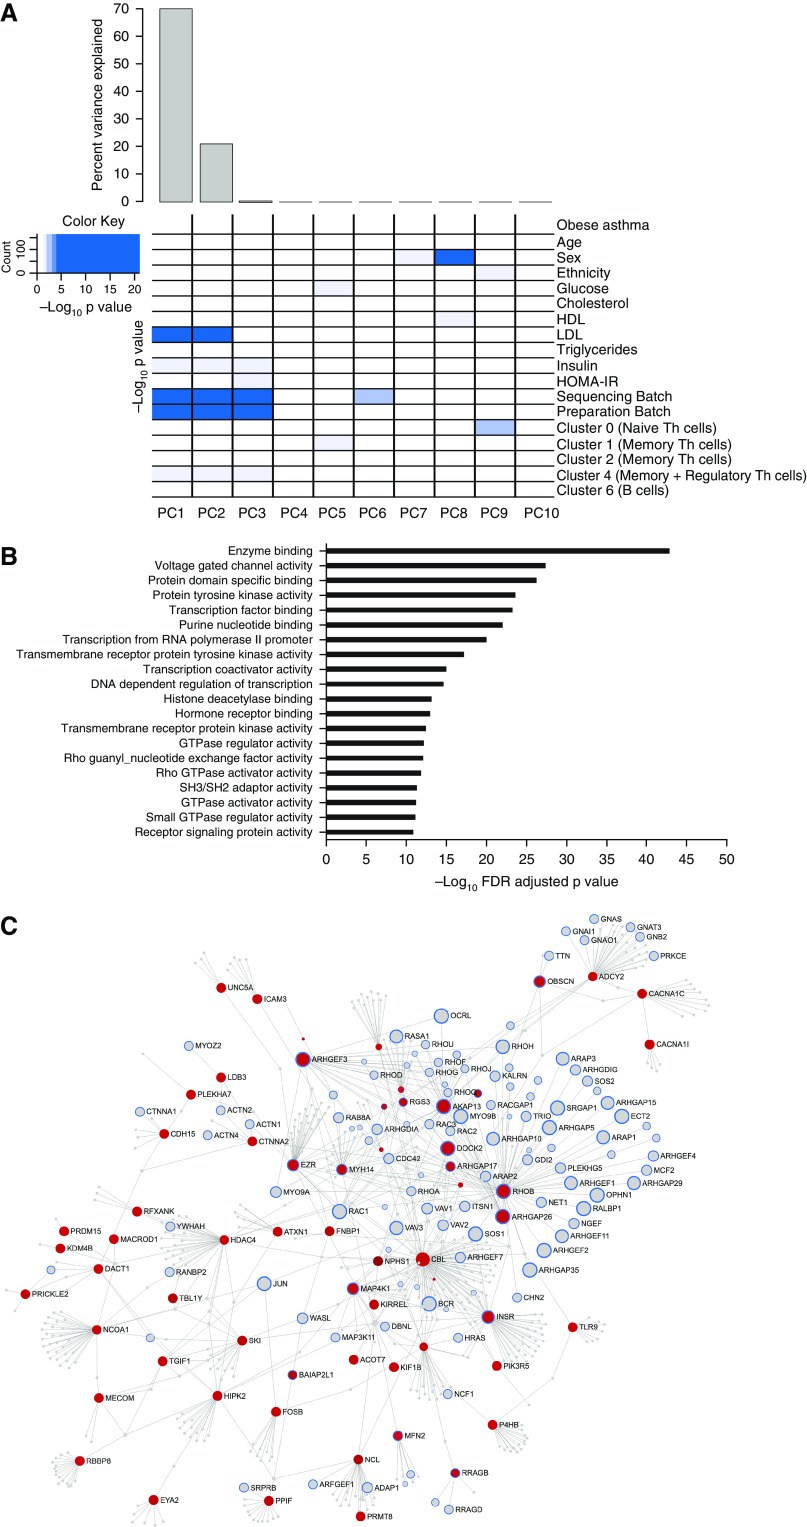
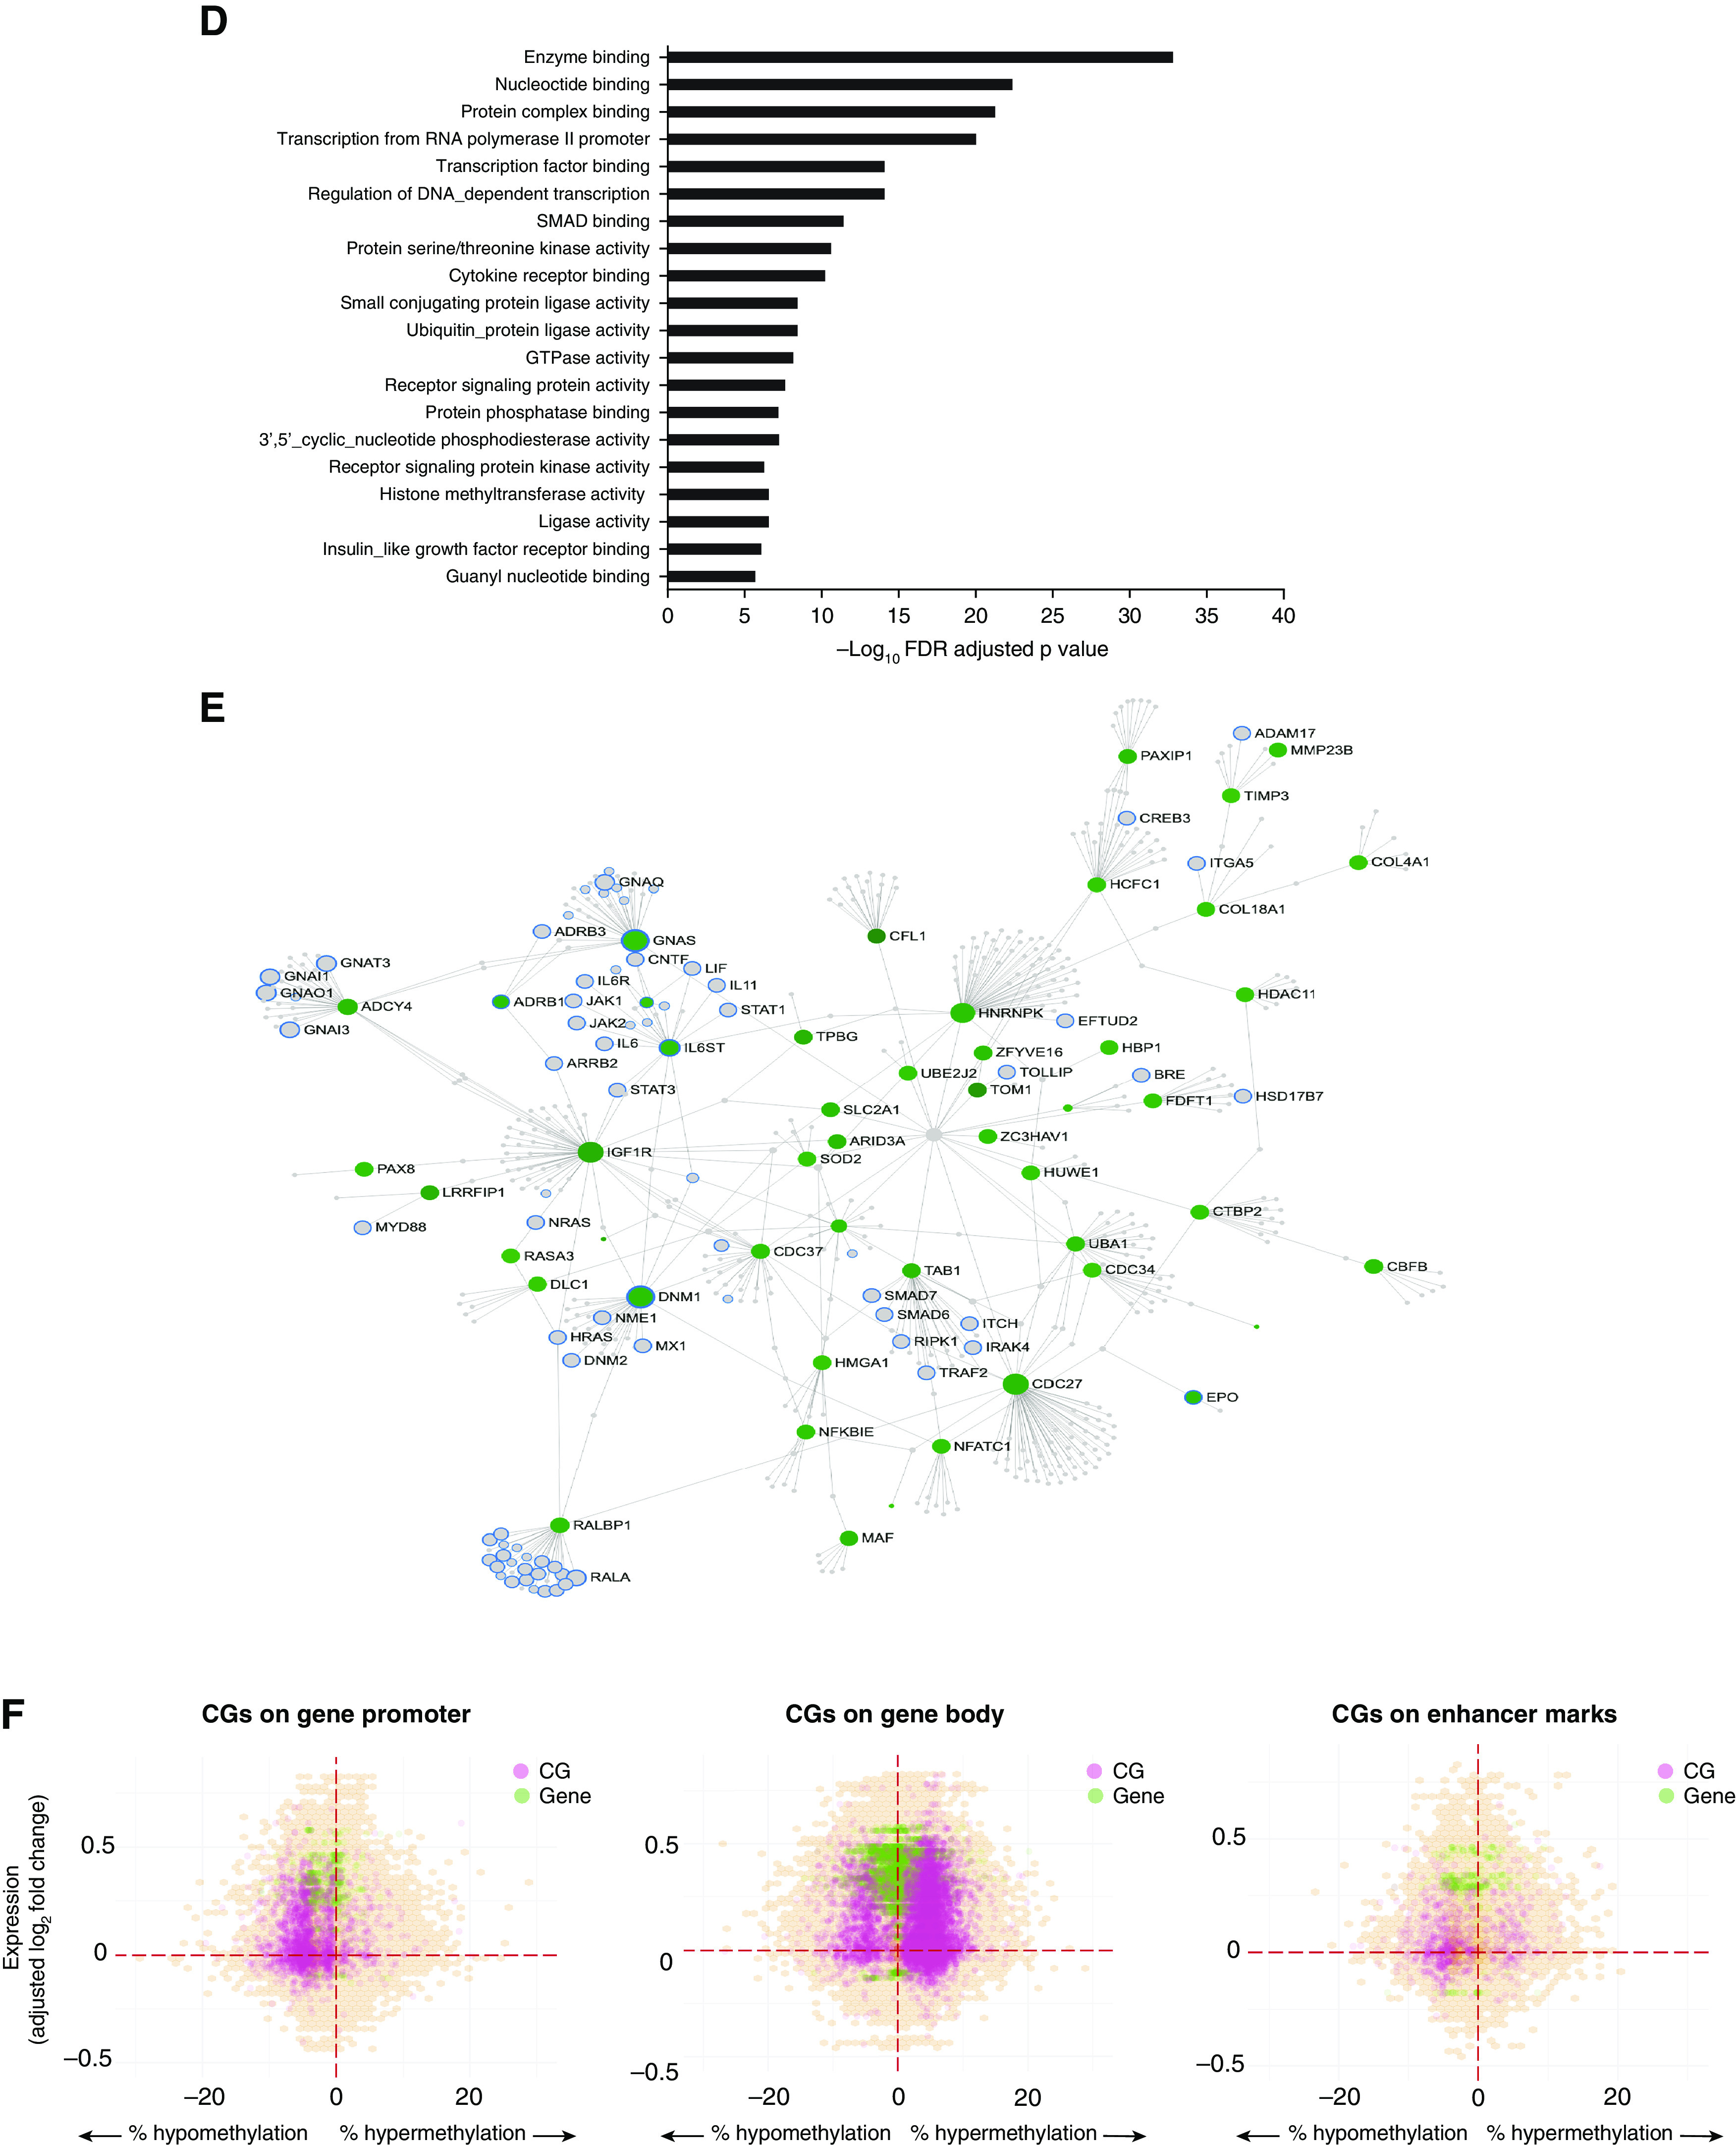
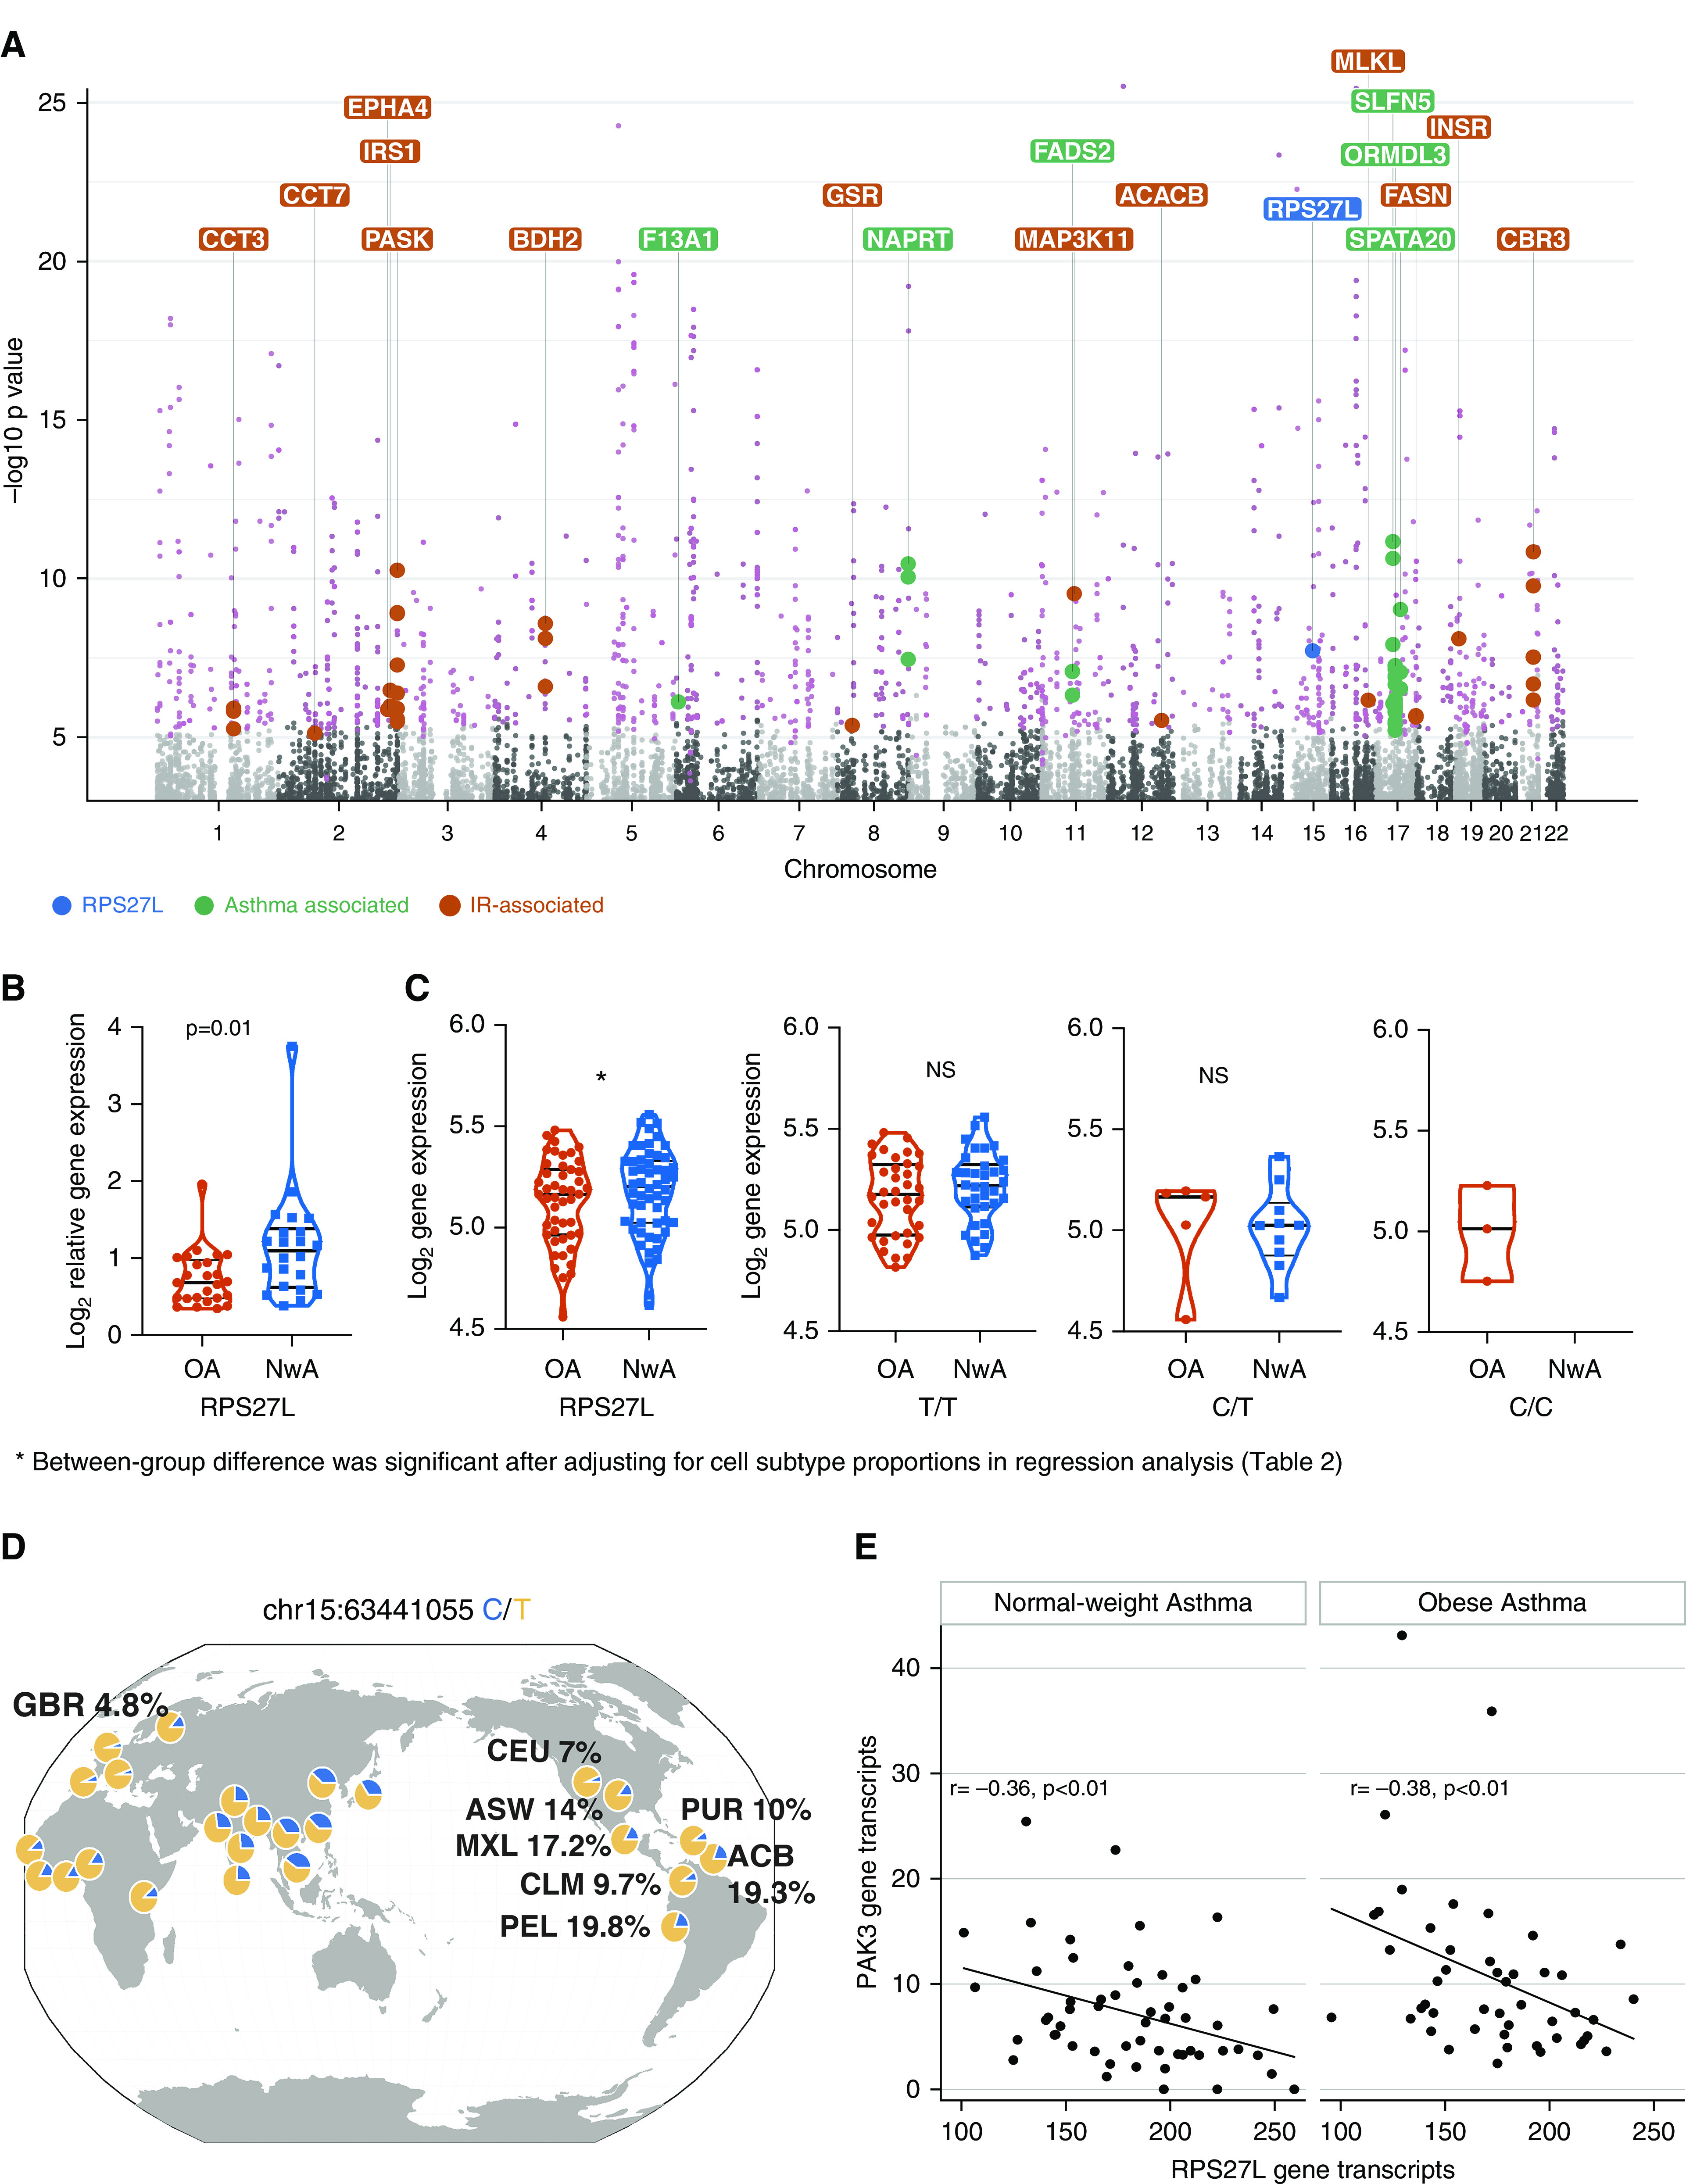
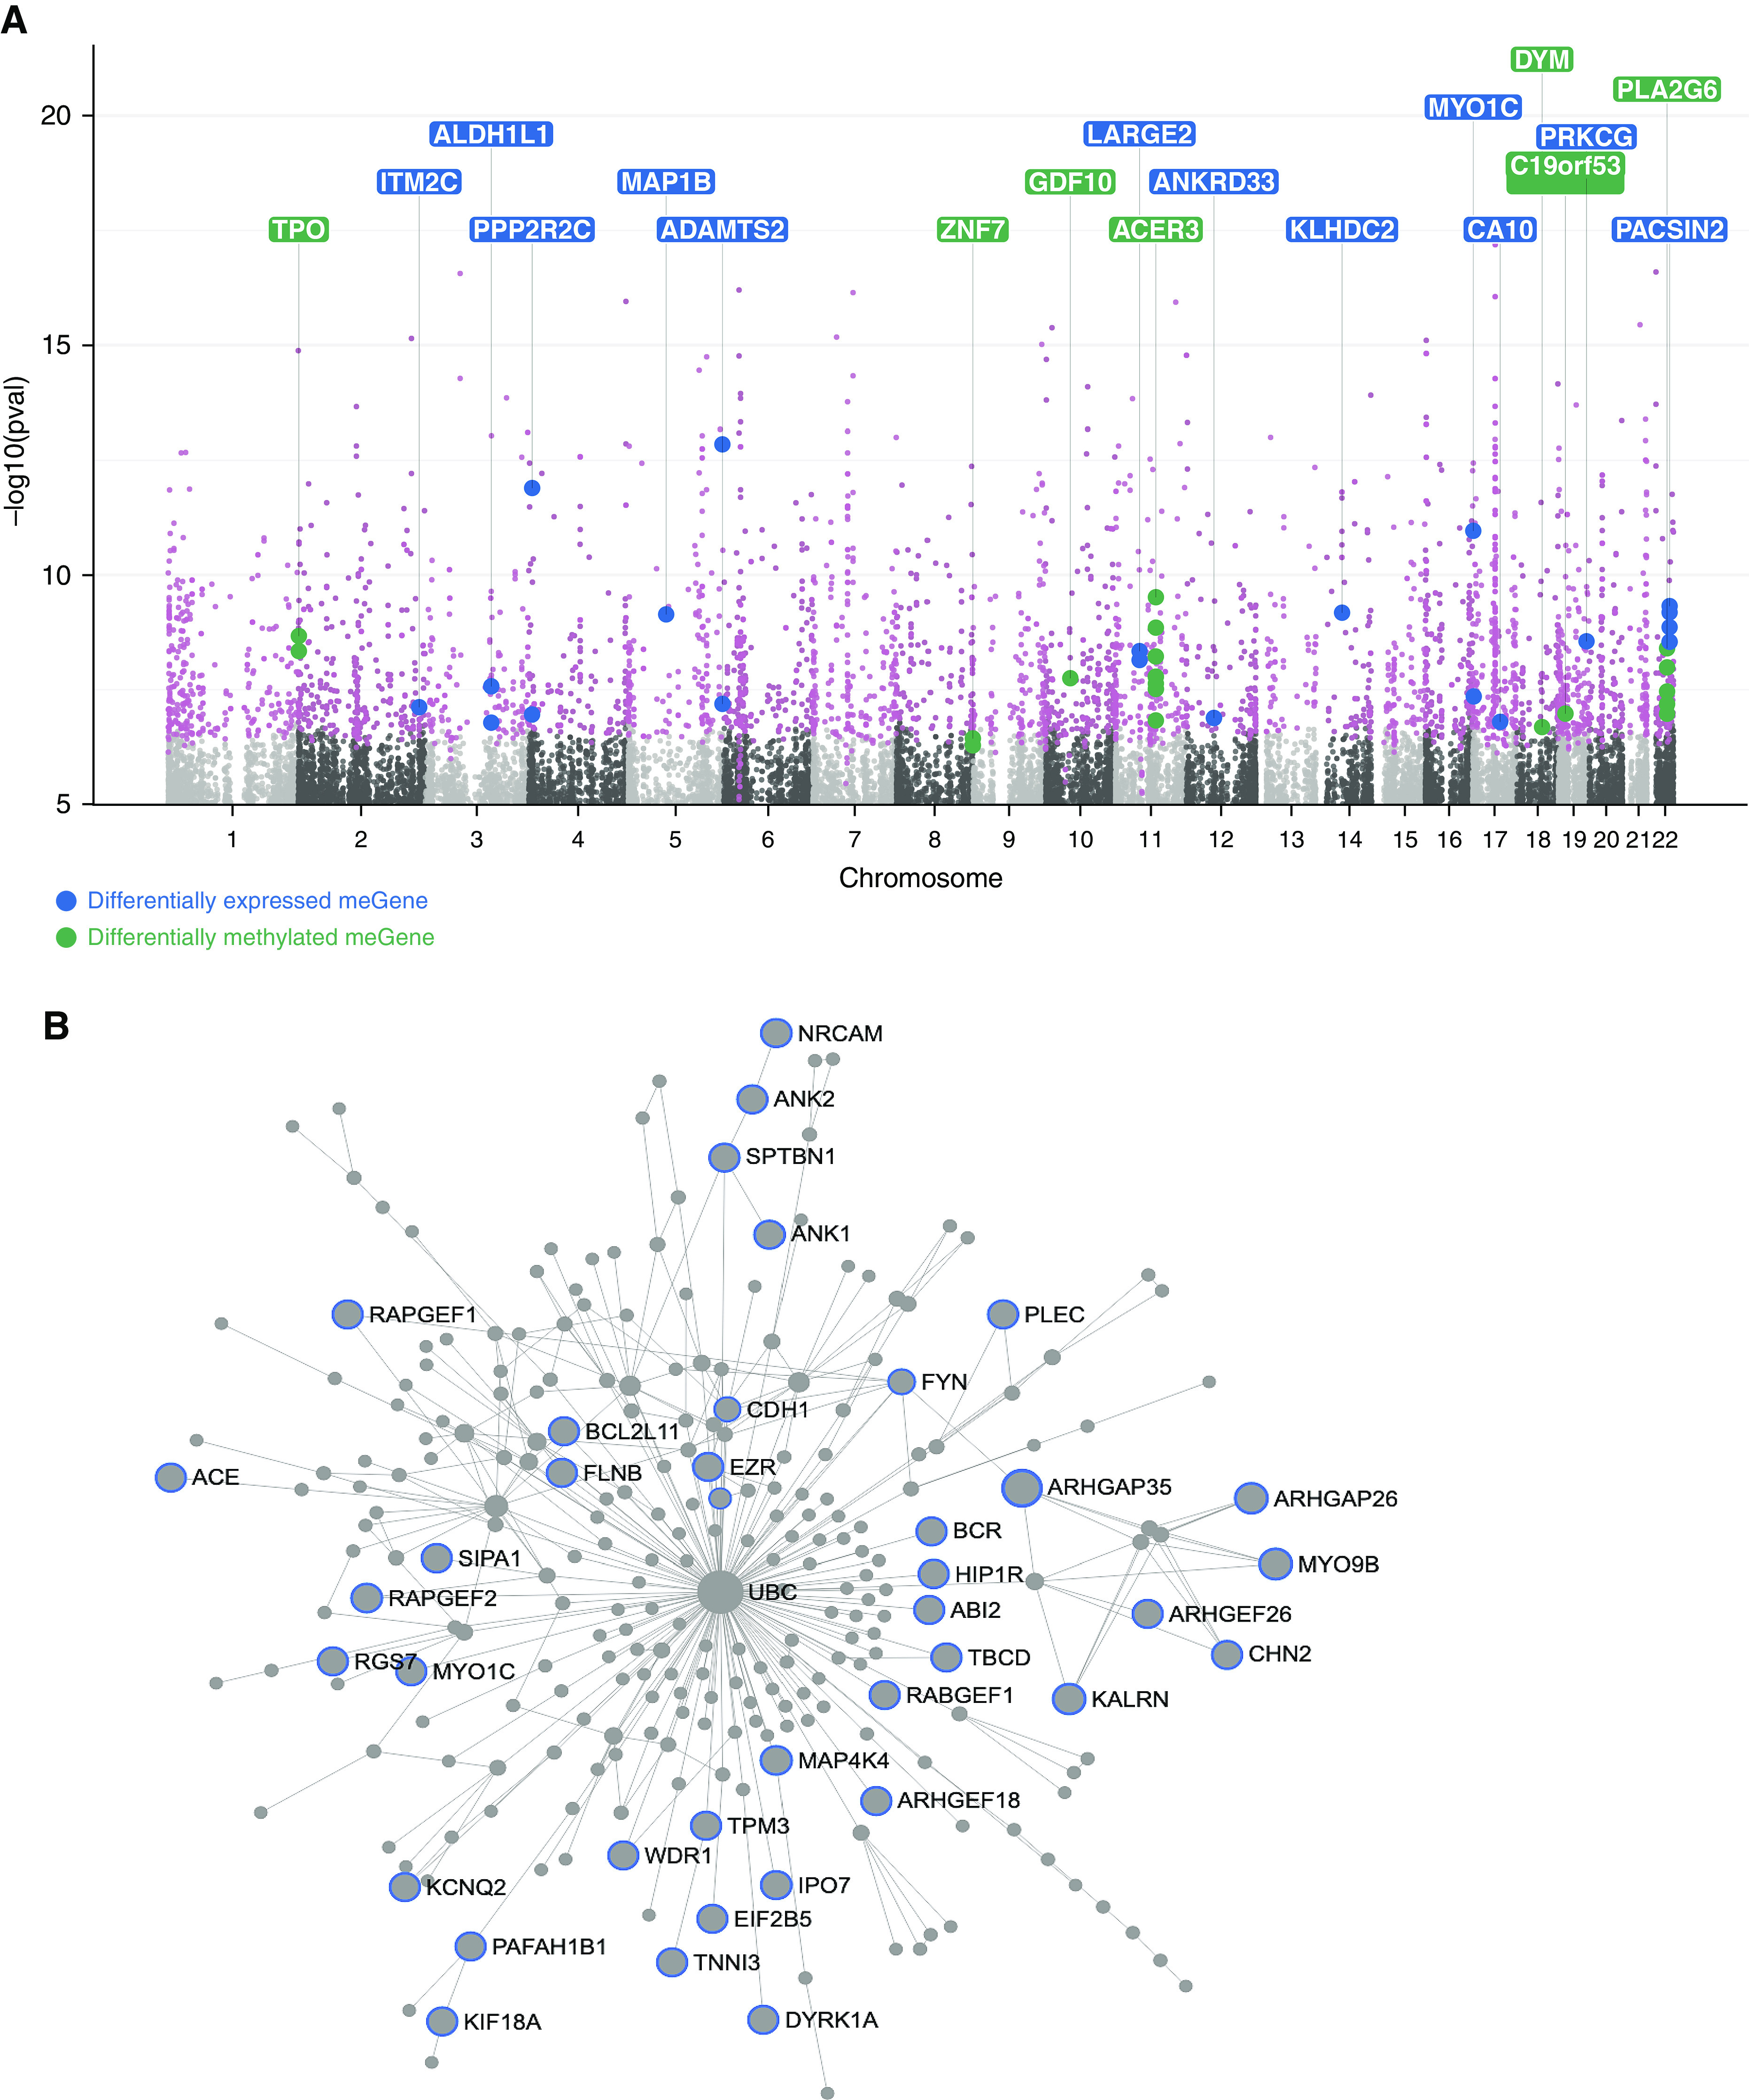
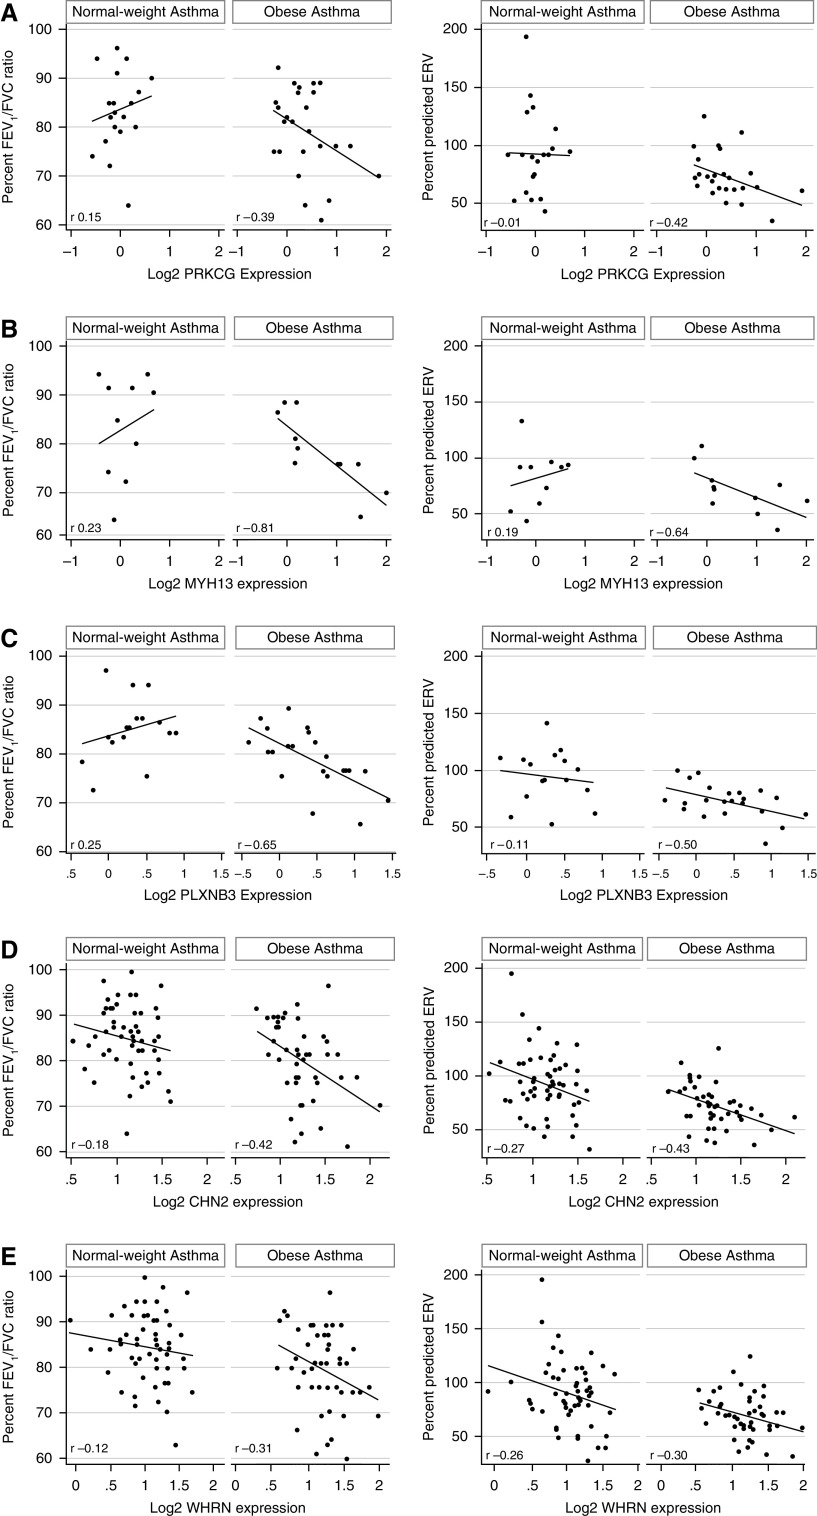
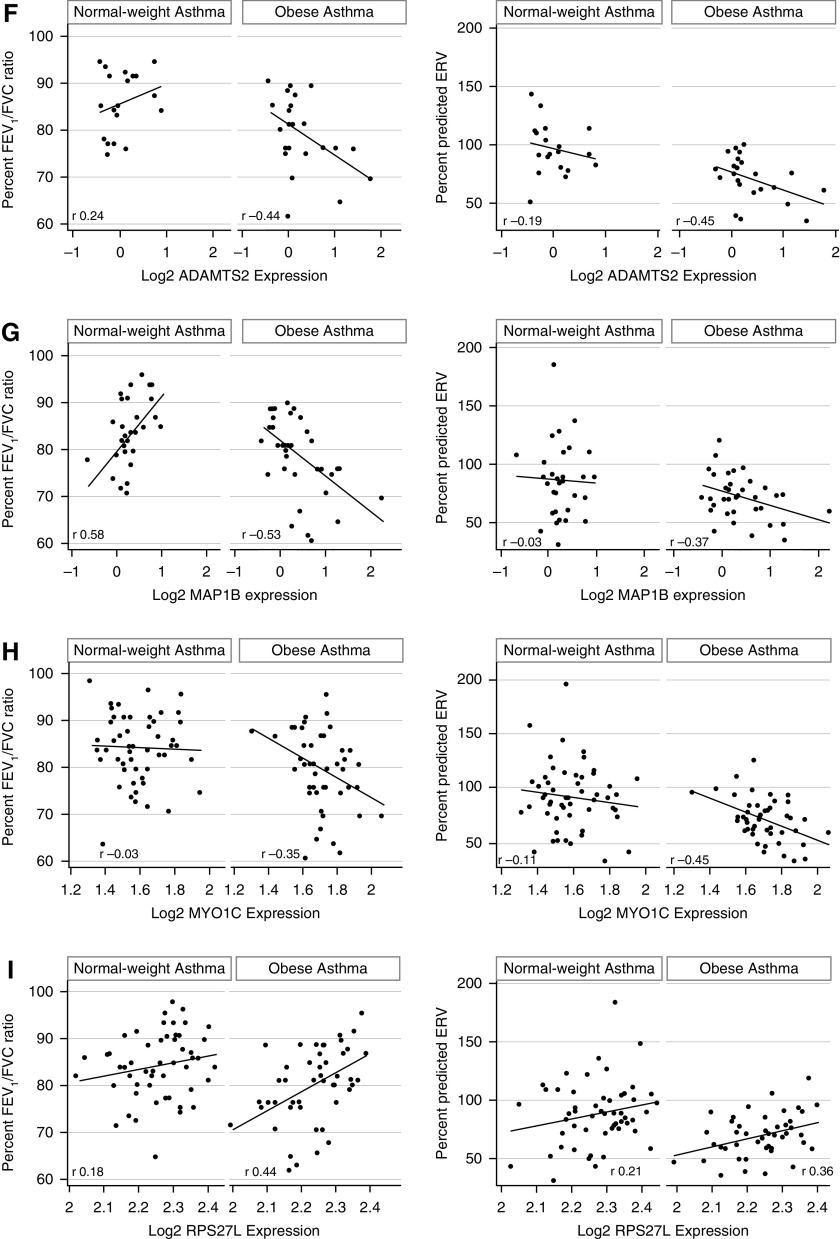
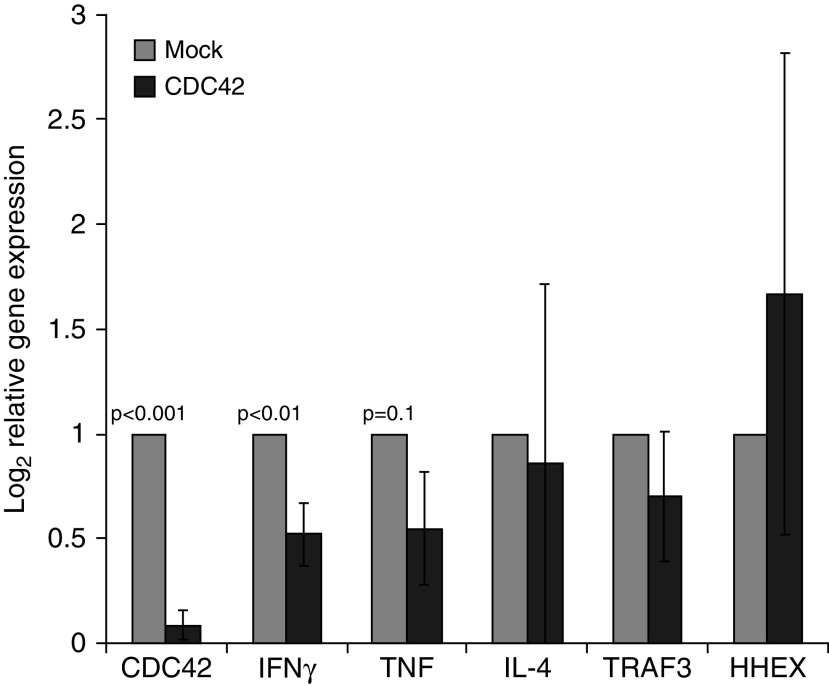
Rationale: Obesity-related asthma disproportionately affects minority children and is associated with nonatopic T-helper type 1 (Th1) cell polarized inflammation that correlates with pulmonary function deficits. Its underlying mechanisms are poorly understood.Objectives: To use functional genomics to identify cellular mechanisms associated with nonatopic inflammation in obese minority children with asthma.Methods: CD4+ (cluster of differentiation 4-positive) Th cells from 59 obese Hispanic and African American children with asthma and 61 normal-weight Hispanic and African American children with asthma underwent quantification of the transcriptome and DNA methylome and genotyping. Expression and methylation quantitative trait loci revealed the contribution of genetic variation to transcription and DNA methylation. Adjusting for Th-cell subtype proportions discriminated loci where transcription or methylation differences were driven by differences in subtype proportions from loci that were independently associated with obesity-related asthma.Measurements and Main Results: Obese children with asthma had more memory and fewer naive Th cells than normal-weight children with asthma. Differentially expressed and methylated genes and methylation quantitative trait loci in obese children with asthma, independent of Th-cell subtype proportions, were enriched in Rho-GTPase pathways. Inhibition of CDC42 (cell division cycle 42), one of the Rho-GTPases associated with Th-cell differentiation, was associated with downregulation of the IFNγ, but not the IL-4, gene. Differential expression of the RPS27L (40S ribosomal protein S27-like) gene, part of the p53/mammalian target of rapamycin pathway, was due to nonrandom distribution of expression quantitative trait loci variants between groups. Differentially expressed and/or methylated genes, including RPS27L, were associated with pulmonary function deficits in obese children with asthma.Conclusions: We found enrichment of Rho-GTPase pathways in obese asthmatic Th cells, identifying them as a novel therapeutic target for obesity-related asthma, a disease that is suboptimally responsive to current therapies.

Keywords: DNA methylation; children; expression and methylation quantitative trait loci; gene expression; obesity-related asthma.


Figures

Figure 1.
Figure 1.
Summary of the analytic approach. In this multiomics analysis, we compared the T-helper (Th)-cell transcriptome and DNA methylome between obese asthma and normal-weight asthma and quantified the contribution of the genome (genotype) to the transcriptome and DNA methylome. We quantified (a) differences between obese and normal-weight asthma Th-cell transcriptome and (b) the contribution of the Th-cell subtype proportions to differential gene expression. We similarly quantified (c) differences between obese and normal-weight asthma Th-cell DNA methylome and (d) the contribution of Th-cell subtype proportions to differential methylation. (e) We then investigated the overlap between differentially methylated and expressed genes in obese asthma Th cells. To quantify the contribution of genetic variants to the transcriptome and DNA methylome, we identified (f) expression quantitative trait loci (eQTLs) and (g) methylation quantitative trait loci (meQTLs), their target genes (e-genes and me-genes, respectively), and their overlap with differentially expressed and methylated genes. The Venn diagram illustrates these relationships as areas of overlap.
Figure 2.
Figure 2.
Differential gene expression in obese asthma T-helper (Th) cells. (A) Gene expression variance was influenced by both technical and biological factors. The heat map summarizes the principal components (PCs) for gene expression variance, with >85% variance explained by PC1. Shades of blue denote the significance of the contribution of each covariate to the PC. Apart from technical factors, proportions of naive (cluster 0), memory (clusters 1, 2, and 4), and regulatory Th cells (cluster 4) and serum insulin concentrations were significant contributors to the variance of the Th-cell transcriptome. (B) The volcano plot summarizes the differential obese asthma transcriptome. More genes were upregulated than downregulated in obese asthma Th cells relative to normal-weight asthma Th cells. Genes marked in blue are those that were retained or gained after Th-cell subtype adjustment, whereas those marked in orange were those that were rendered nonsignificant when adjusted for Th-cell subtype proportions. Although RHOA (Ras homolog family member A) and MICAL3 (microtubule-associated monooxygenase, calponin, and LIM domain containing 3) are two representative genes that were rendered nonsignificant after adjusting for cell subtype proportions, PAK3 (p21 protein-activated kinase 3) was not influenced by cell subtype proportions, and RPS27L (40S ribosomal protein S27-like) was identified after adjustment for cell subtype proportions. (C) Higher PAK3 expression identified on RNA-sequencing analysis was confirmed by quantitative PCR in a subset of 10 samples in each group (obese asthma [OA] and normal-weight asthma [NwA]). (D) Differential PAK3 expression was further validated in a separate cohort of 20 obese and 20 normal-weight asthma samples; the potential role of obesity alone (Ob) contributing to PAK3 upregulation was addressed by quantifying it in 15 obese and 15 normal-weight nonasthma or healthy control (HC) samples. (E) The 157 genes differentially expressed in obese asthma, independent of Th-cell subtype proportions, were enriched for Rho-GTPase/small GTPase pathways in Gene Ontology pathway analysis; the top 20 Gene Ontology pathways are shown (false discovery rate [FDR]-adjusted P < 0.05). (F) Network analysis of the differentially expressed genes is shown with genes in the GTPase pathways marked with a blue outline. Those marked in red were upregulated, and those in green were downregulated, in obese asthma Th cells relative to normal-weight asthma Th cells. Genes marked in gray were not significantly differentially expressed in obese relative to normal-weight asthma Th cells. GTP = guanosine triphosphate; HDL = high-density lipoprotein; HOMA-IR = homeostatic model assessment of insulin resistance; LDL = low-density lipoprotein.
Figure 3.
Figure 3.
Differential DNA methylation in obese asthma T-helper (Th) cells. (A) DNA methylation variance was also influenced by both technical and biological factors. The heat map summarizes the principal components (PCs) for gene expression variance, with greater than 80% of the variance explained by the first PC. Shades of blue denote the significance of the contribution of each covariate to the PC. Apart from technical factors, proportions of memory and regulatory Th cells (cluster 4) and serum insulin and low-density lipoprotein (LDL) concentrations were significant contributors to variance of the Th-cell methylome. Gene Ontology (GO) pathway analysis revealed that both (B) hypermethylated CGs, marked in red in C, and (D) hypomethylated CGs, marked in green in E, in obese asthma Th cells relative to normal-weight asthma Th cells were enriched for Rho-GTPase/small GTPase pathways; the top 20 GO pathways are included (false discovery rate [FDR]-adjusted P < 0.05). In the networks (C and E), genes in GTPase pathways are marked with blue outline; genes marked in gray were not significantly differentially methylated in obese asthma relative to normal-weight asthma Th cells. (F) The hexagonal plots summarize the association between gene expression and DNA methylation. Statistically significant differentially expressed genes are marked in green, and differentially methylated CGs are marked in pink. Overlapping genes and CGs that did not reach statistical significance are shown in orange, with higher density denoted with darker shades. Both hypo-and hypermethylated CGs were associated with gene upregulation; few CGs were associated with gene downregulation. In keeping with existing literature, more CGs in promoters and enhancers were hypomethylated, and in gene body were hypermethylated, in association with gene upregulation in obese asthma Th cells relative to normal-weight asthma Th cells. GTP = guanosine triphosphate; HDL = high-density lipoprotein; HOMA-IR = homeostatic model assessment of insulin resistance.
Figure 3.
Figure 3.
Differential DNA methylation in obese asthma T-helper (Th) cells. (A) DNA methylation variance was also influenced by both technical and biological factors. The heat map summarizes the principal components (PCs) for gene expression variance, with greater than 80% of the variance explained by the first PC. Shades of blue denote the significance of the contribution of each covariate to the PC. Apart from technical factors, proportions of memory and regulatory Th cells (cluster 4) and serum insulin and low-density lipoprotein (LDL) concentrations were significant contributors to variance of the Th-cell methylome. Gene Ontology (GO) pathway analysis revealed that both (B) hypermethylated CGs, marked in red in C, and (D) hypomethylated CGs, marked in green in E, in obese asthma Th cells relative to normal-weight asthma Th cells were enriched for Rho-GTPase/small GTPase pathways; the top 20 GO pathways are included (false discovery rate [FDR]-adjusted P < 0.05). In the networks (C and E), genes in GTPase pathways are marked with blue outline; genes marked in gray were not significantly differentially methylated in obese asthma relative to normal-weight asthma Th cells. (F) The hexagonal plots summarize the association between gene expression and DNA methylation. Statistically significant differentially expressed genes are marked in green, and differentially methylated CGs are marked in pink. Overlapping genes and CGs that did not reach statistical significance are shown in orange, with higher density denoted with darker shades. Both hypo-and hypermethylated CGs were associated with gene upregulation; few CGs were associated with gene downregulation. In keeping with existing literature, more CGs in promoters and enhancers were hypomethylated, and in gene body were hypermethylated, in association with gene upregulation in obese asthma Th cells relative to normal-weight asthma Th cells. GTP = guanosine triphosphate; HDL = high-density lipoprotein; HOMA-IR = homeostatic model assessment of insulin resistance.
Figure 4.
Figure 4.
Contribution of genotype to differential gene expression. (A) Manhattan plot of expression quantitative trait loci analysis, inclusive of obese and normal-weight samples, summarizes the 441 expression quantitative trait loci target genes (e-genes; labeled in pink). Of these, several e-genes (labeled in green) overlapped with genes whose variants have previously been associated with childhood asthma, supporting a role of genetic variance in differential expression in childhood asthma. We also found several e-genes in the insulin metabolism pathway (labeled in orange) that suggest a genetic propensity for altered insulin-mediated T-helper cell metabolism. RPS27L (40S ribosomal protein S27-like; labeled in blue) was the one e-gene that was differentially expressed (downregulated) in obese children with asthma and (B) was verified by quantitative PCR. (C) Gene expression differences in RPS27L were driven by nonuniform distribution of genetic variants between obese asthma (OA) and normal-weight asthma (NwA) samples, with only obese children with asthma and no normal-weight children with asthma being homozygous for the minor allele. (D) The minor allele is enriched in Americans of African ancestry in the southwestern United States (ASW), Afro-Caribbeans in Barbados (ACB), and Latino populations (Mexican ancestry from Los Angeles [MXL], Colombians [CLM], Puerto Ricans [PUR], and Peruvians [PEL]) as compared with Utah residents of northern and western European ancestry (CEU) and British (GBR) (mapped on the Genomics of Genetic Variants Browser; popgen.uchicago.edu/ggv). (E) The number of RPS27L gene transcripts inversely correlated with number of PAK3 (p21 protein-activated kinase 3) gene transcripts. IR = insulin resistance; NS = nonsignificant.
Figure 5.
Figure 5.
Contribution of genotype to differential methylation. (A) Manhattan plot of methylation quantitative trait loci analysis, inclusive of obese and normal-weight samples, summarizes the 1,263 methylation quantitative trait loci target genes (me-genes; labeled in pink). Of these, 12 me-genes (labeled in blue) were among the 157 differentially expressed genes in obese asthma T-helper (Th) cells, of which PPP2R2C (serine/threonine-protein phosphatase 2A 55 kDa regulatory subunit Bγ) and PRKCG (protein kinase Cγ) are in the Rho-GTPase pathway. These findings suggest that genetic polymorphisms influence gene expression through DNA methylation. We also found that several me-genes (labeled in green) were differentially methylated in the obese asthma relative to normal-weight asthma Th cells, supporting a role of genetic variance in differential methylation in childhood obesity-related asthma. (B) Overall, me-genes were enriched for Rho-GTPase/small GTPase pathways. Genes in GTPase pathways are marked with blue outline.
Figure 6.
Figure 6.
Correlation between gene expression and pulmonary function indices associated with obesity-related asthma. Expression of several genes correlated with percentage FEV1/FVC ratio and percent predicted expiratory reserve volume (ERV) in obese children with asthma but not in normal-weight children with asthma. Representative correlations of FEV1/FVC and ERV with differentially expressed genes enriched in Rho-GTPase pathways (A) PRKCG (protein kinase Cγ), (B) MYH13 (myosin heavy chain 13), and (C) PLXNB3 (plexin B3), genes that influence Rho-GTPases (D) CHN2 (chimerin 2) and (E) WHRN (whirlin) and genes associated with cellular mechanisms related to Rho-GTPases, including actin polymerization, (F) MYO1C (myosin IC), (G) MAP1B (microtubule-associated protein 1B), and (H) ADAMTS2 (a disintegrin and metalloproteinase with thrombospondin type 1, motif 2) are shown. (I) RPS27L (40S ribosomal protein S27-like) was the one expression quantitative trait loci target gene that was differentially expressed in obese asthma T-helper cells and was also associated with FEV1/FVC ratio and ERV.
Figure 6.
Figure 6.
Correlation between gene expression and pulmonary function indices associated with obesity-related asthma. Expression of several genes correlated with percentage FEV1/FVC ratio and percent predicted expiratory reserve volume (ERV) in obese children with asthma but not in normal-weight children with asthma. Representative correlations of FEV1/FVC and ERV with differentially expressed genes enriched in Rho-GTPase pathways (A) PRKCG (protein kinase Cγ), (B) MYH13 (myosin heavy chain 13), and (C) PLXNB3 (plexin B3), genes that influence Rho-GTPases (D) CHN2 (chimerin 2) and (E) WHRN (whirlin) and genes associated with cellular mechanisms related to Rho-GTPases, including actin polymerization, (F) MYO1C (myosin IC), (G) MAP1B (microtubule-associated protein 1B), and (H) ADAMTS2 (a disintegrin and metalloproteinase with thrombospondin type 1, motif 2) are shown. (I) RPS27L (40S ribosomal protein S27-like) was the one expression quantitative trait loci target gene that was differentially expressed in obese asthma T-helper cells and was also associated with FEV1/FVC ratio and ERV.
Figure 7.
Figure 7.
Validation of the role of Rho-GTPases in nonatopic T-helper–cell responses. siRNA-based silencing of CDC42 (cell division cycle 42; black bars), as compared with mock control (gray bars), was associated with downregulation of IFNγ, but not of IL-4, expression. Although it did not reach statistical significance, a 50% downregulation of TNF (tumor necrosis factor) expression was observed in cells with CDC42 silencing. TRAF3 (TNF receptor–associated factor 3) and HHEX (hematopoietically expressed homeobox protein), included as additional controls, supported that the findings were not due to off-target effects of gene silencing.

Comment in

References

    1. Gross E, Lee DS, Hotz A, Ngo KC, Rastogi D. Impact of obesity on asthma morbidity during a hospitalization. Hosp Pediatr. 2018;8:538–546. - PMC - PubMed
    1. Rastogi D, Canfield SM, Andrade A, Isasi CR, Hall CB, Rubinstein A, et al. Obesity-associated asthma in children: a distinct entity. Chest. 2012;141:895–905. - PubMed
    1. Rastogi D, Fraser S, Oh J, Huber AM, Schulman Y, Bhagtani RH, et al. Inflammation, metabolic dysregulation, and pulmonary function among obese urban adolescents with asthma. Am J Respir Crit Care Med. 2015;191:149–160. - PMC - PubMed
    1. McGarry ME, Castellanos E, Thakur N, Oh SS, Eng C, Davis A, et al. Obesity and bronchodilator response in black and Hispanic children and adolescents with asthma. Chest. 2015;147:1591–1598. - PMC - PubMed
    1. Weinmayr G, Forastiere F, Büchele G, Jaensch A, Strachan DP, Nagel G ISAAC Phase Two Study Group. Overweight/obesity and respiratory and allergic disease in children: International Study of Asthma and Allergies in Childhood (ISAAC) Phase Two. PLoS One. 2014;9:e113996. - PMC - PubMed

Publication types

Substances