. 2020 Apr 7;5(8):e130553.
doi: 10.1172/jci.insight.130553.

Intercalated cell BKα subunit is required for flow-induced K+ secretion

Affiliations

Intercalated cell BKα subunit is required for flow-induced K+ secretion

Rolando Carrisoza-Gaytan et al. JCI Insight. .

Abstract

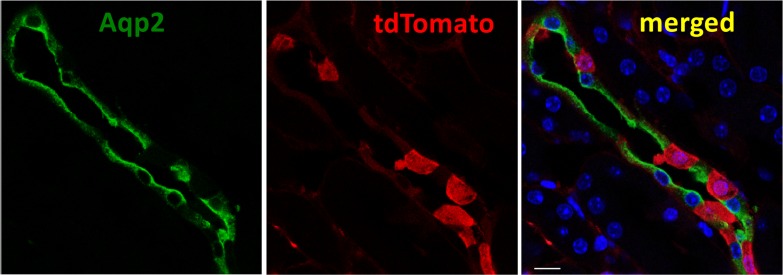
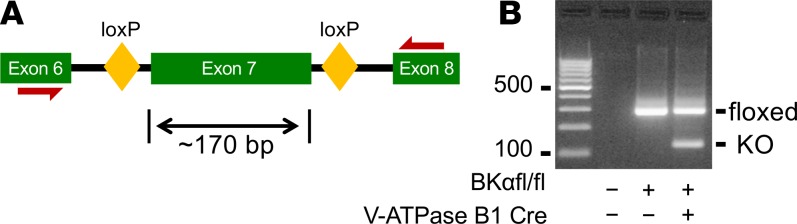
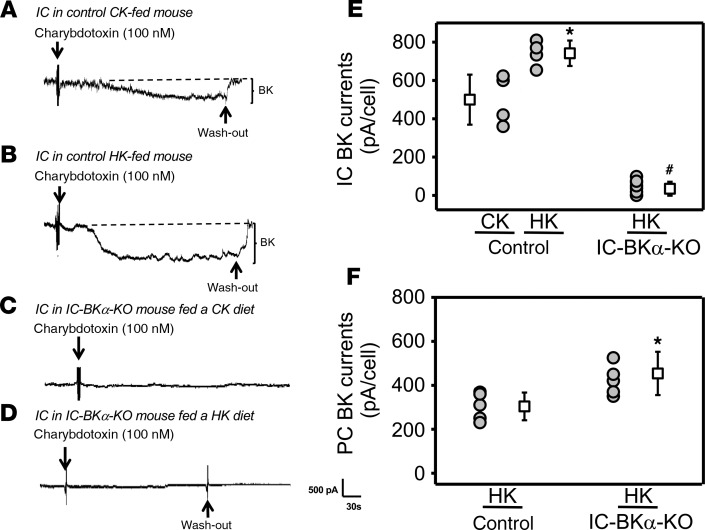
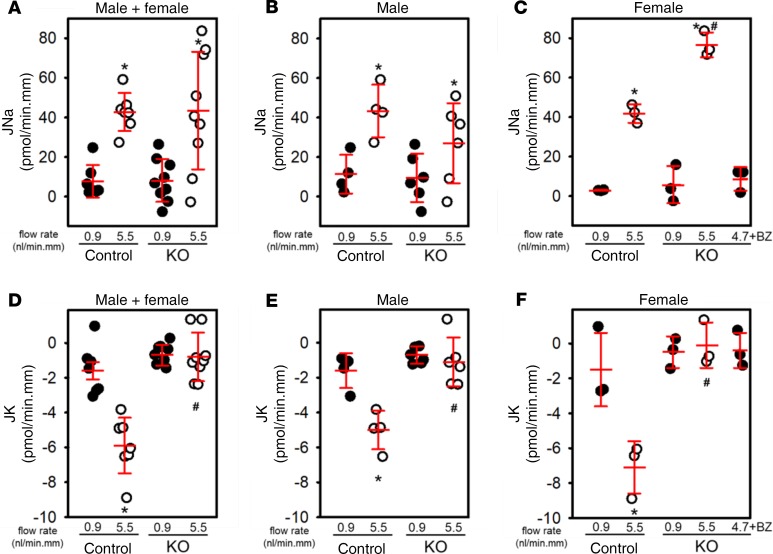
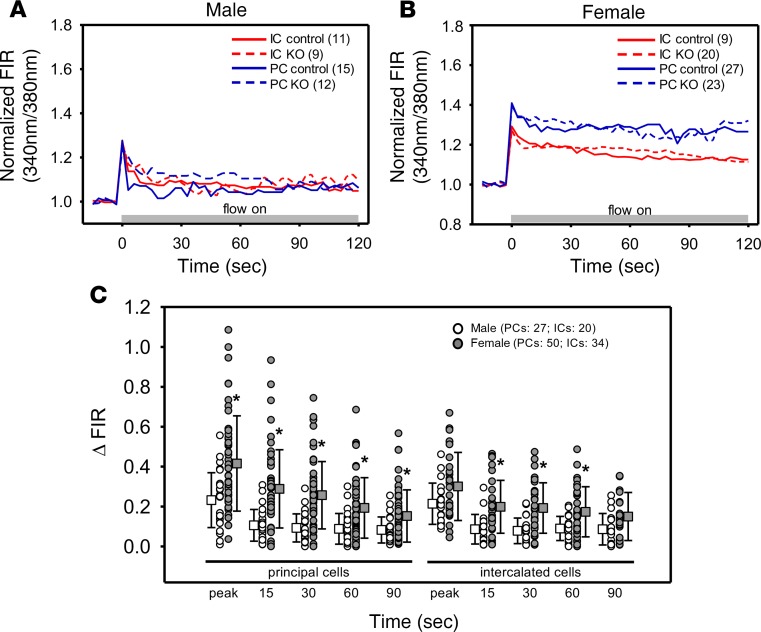
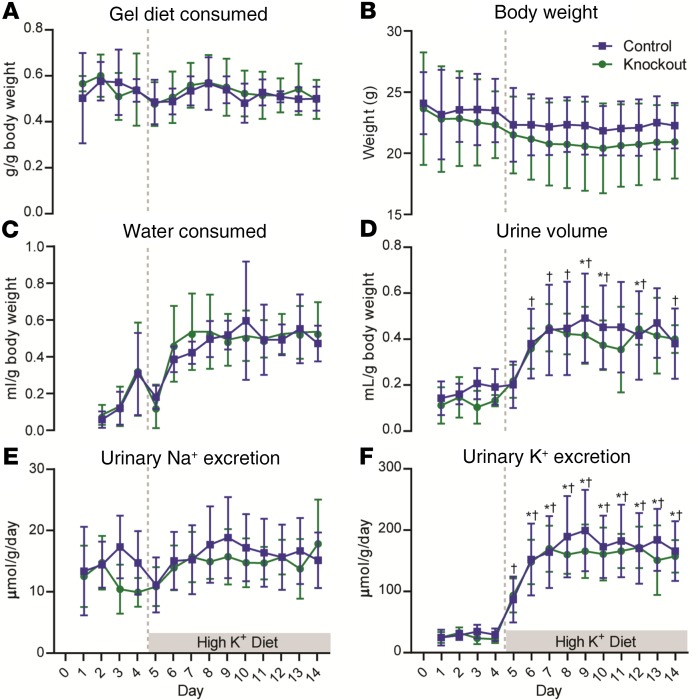
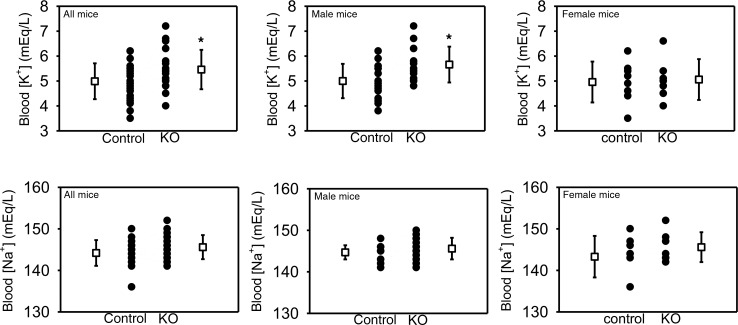
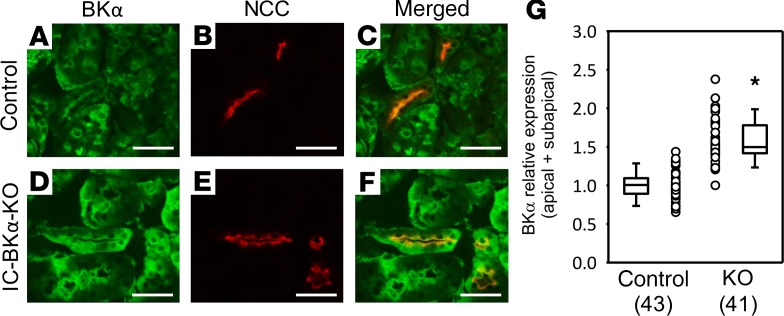
BK channels are expressed in intercalated cells (ICs) and principal cells (PCs) in the cortical collecting duct (CCD) of the mammalian kidney and have been proposed to be responsible for flow-induced K+ secretion (FIKS) and K+ adaptation. To examine the IC-specific role of BK channels, we generated a mouse with targeted disruption of the pore-forming BK α subunit (BKα) in ICs (IC-BKα-KO). Whole cell charybdotoxin-sensitive (ChTX-sensitive) K+ currents were readily detected in control ICs but largely absent in ICs of IC-BKα-KO mice. When placed on a high K+ (HK) diet for 13 days, blood [K+] was significantly greater in IC-BKα-KO mice versus controls in males only, although urinary K+ excretion rates following isotonic volume expansion were similar in males and females. FIKS was present in microperfused CCDs isolated from controls but was absent in IC-BKα-KO CCDs of both sexes. Also, flow-stimulated epithelial Na+ channel-mediated (ENaC-mediated) Na+ absorption was greater in CCDs from female IC-BKα-KO mice than in CCDs from males. Our results confirm a critical role of IC BK channels in FIKS. Sex contributes to the capacity for adaptation to a HK diet in IC-BKα-KO mice.

Keywords: Cell Biology; Epithelial transport of ions and water; Ion channels; Mouse models; Nephrology.


Conflict of interest statement

Conflict of interest: TRK receives an honorarium from Wiley Inc. for serving as Editor of Physiological Reports.

Figures

Figure 1
Figure 1. Specificity of Cre expression in B1-Cre mice crossed with ROSA26tdTomato.
Confocal microscopic examination of cryosections from offspring of these mice revealed that cells expressing the B1-Cre transgene did not colabel with an antibody directed against principal cell–specific AQP2, consistent with cell-specific Cre activity in intercalated but not principal cells in the CCD. Scale bar: 10 μM.
Figure 2
Figure 2. Body weights of 12- to 14-week-old floxed control and IC-BKα–KO mice fed a HK diet for 10 days.
Male control (n = 12) and IC-BKα–KO (n = 8) mice reached a greater weight than did females (n = 5 controls and 4 KOs), although there was no significant difference between control and KO mice of a given sex. Individual data points, as well as mean ± SD (box with SD bars) are shown for each group. *P < 0.01 compared with males of the same genotype, 2-tailed unpaired Student’s t test.
Figure 3
Figure 3. Generation of floxed BKα allele and targeted deletion of BKα in intercalated cells.
(A) Schematic representation of floxed allele showing LoxP sites flanking exon 7 of Kcnma1. (B) Representative blot of PCR products from renal cortex of BKαfl/fl mice and BKαfl/fl mice bred with B1-Cre mice using nested BKα-specific primers. Genotyping revealed a band at 132 bp in the IC-BKα–KO mouse, reflecting Cre-mediated excision of the BKα pore domain in BKαfl/fl mice. The upper 306-bp band is the uncombined allele.
Figure 4
Figure 4. Perforated whole cell patch recordings of charybdotoxin-sensitive (ChTx-sensitive) currents in intercalated cells (ICs) and principal cells (PCs) in CCDs from IC-BKα–KO and floxed control mice.
Recordings were performed in cells clamped at +60 mV. The composition of the bath and pipette solutions, which both contained 130 mM K-gluconate, is given in Methods. Currents were normalized to a membrane capacitance of 13 pF per cell. (A–D) Representative current tracings are shown on the left for ICs in CCDs isolated from floxed control K+–fed (CK-fed) (A), floxed high K+–fed (HK-fed) (B), KO CK-fed (C), and KO HK–fed mice (D). (E) Summary graph showing individual data points and mean ± SD (box with SD bars) for ChTx-sensitive current density in ICs in floxed mice fed a CK diet (n = 4 ICs), averaging 500 ± 65 pA/cell, enhanced to 742 ± 33 pA/cell (n = 4 ICs, P < 0.03) in mice fed a HK diet for 10 days to maximize BK channel expression. BK channel activity in ICs in IC-BKα–KO CCDs isolated from mice fed a HK diet (n = 10 ICs) was minimal. *P < 0.05 compared with CK-fed controls and #P < 0.05 compared with HK-fed controls, 2-tailed unpaired Student’s t test. (F) Summary graph as described for E showing ChTx-sensitive currents in PCs in CCDs from HK-fed IC-BKα–KO mice (n = 6 PCs); these currents were greater than those in HK-fed floxed littermates (n = 5 PCs). *P < 0.05 compared to HK-fed controls, 2-tailed unpaired Student’s t test. Data were obtained from both male and female mice.
Figure 5
Figure 5. Basal and flow-induced net Na absorption (JNa) and K secretion (JK) in microperfused CCDs isolated from HK-fed IC-BKα–KO and control floxed mice.
(A and D) In 7 CCDs from control mice (4 male and 3 female), an increase in tubular fluid flow rate from 0.9 (slow, closed circle) to 5.5 (fast, open circle) nL/min per mm was associated with a significant increase in JNa (A) and JK (D). Basal and flow-stimulated JNa were similar in CCDs from these control and 9 IC-BKα–KO mice (6 male and 3 female). (E and F) However, flow-induced K+ secretion (FIKS) was absent in CCDs from IC-BKα–KO male (E) and female (F) mice. (B and C) Flow-stimulated but not basal rates of transepithelial Na+ transport in female IC-BKα–KO mice (C) exceeded that measured in males (B) and was inhibited by 3 μM benzamil (BZ, n = 3). Mean ± SD. *P < 0.05 compared with JNa or JK at 0.9 nL/min per mm in same tubules, by 2-tailed paired Student’s t test; #P < 0.05 compared with JNa or JK in control tubules studied at same flow rate, by 2-tailed unpaired Student’s t test.
Figure 6
Figure 6. Effect of targeted deletion of BKα in intercalated cells on flow-induced increases in fura 2 fluorescence intensity ratio (FIR), a measure of intracellular Ca2+ concentration ([Ca2+]i), in microperfused CCDs.
(A and B) Summary tracings, representing the average fura 2 FIRs recorded in individual cells (number of cells in parentheses in 3 CCDs per genotype) prior to and following an acute increase in flow rate. The FIR in intercalated (IC, red) and principal (PC, blue) cells in fura 2–loaded CCDs isolated from male (A) and female (B) floxed control (solid lines) and IC-BKα–KO (dashed lines) mice were normalized to the FIR measured immediately prior to the increase in flow rate. An acute increase in luminal flow rate led to a typical biphasic response including an immediate rapid increase in FIR to a peak value within ~10 seconds, presumably secondary to basolateral Ca2+ entry and release of Ca2+ from internal stores, followed by a gradual decay to a plateau value that exceeds baseline for at least 120 seconds of sustained high flow. The latter plateau elevation in FIR is believed to represent mechano-induced Ca2+ influx into cells. No significant differences in the immediate peak response or the plateau elevation in FIR were detected in each individual cell type between control and IC-BKα–KO mice. (C) Data were thus pooled; graph presents the change in FIR from baseline of all cells studied in male (open circle) and female (closed circle) mice at intervals following an acute increase in flow rate. The elevation of FIR at 15, 30, 60 and 90 seconds after high flow was initiated was greater in females (n = 6 mice) compared males (n = 6 mice, P ≤ 0.05). Number of cells studied in 3 CCDs per genotype is given in parentheses. Mean ± SD. *P < 0.05 female versus male at specific times (sec), 2-tailed unpaired Student’s t test.
Figure 7
Figure 7. Urine electrolyte and other parameters measured in response to the HK diet.
IC-BKα–KO (n = 6; 3 female and 3 male) and floxed control (n = 6; 3 female and 3 male) mice were placed in metabolic cages for 4 days on a control diet. Their diet was then transitioned to HK (5% K as KCl) for 10 days of monitoring. (A–F) Diet consumed (A), mouse body weight (B), water consumed (C), urine volume (D), daily urine Na+ excretion (E), and urine K+ excretion (F) (all normalized to mouse weight) are shown. In mixed effects analysis, there was a statistically significant change over time (P < 0.001) in all parameters except diet consumed. There were no significant differences between genotypes. Urine Na+ excretion exhibited statistically significant interaction between day and genotype (P = 0.004). Values significantly different from baseline before HK diet (day 4) are marked for IC-BKα–KO mice (P < 0.05) or control mice (*P < 0.05).
Figure 8
Figure 8. Whole blood electrolytes in HK-fed IC-BKα–KO and floxed control mice.
IC-BKα–KO and floxed control mice were maintained on a HK diet for 13 days, and whole blood [K+] and [Na+] were subsequently determined. Individual data points, as well as mean ± SD (box with SD bars), are shown. Results for all animals, as well as results segregated by sex, are shown. *P < 0.05 versus floxed controls, by 2-tailed unpaired Student’s t test. n = 24 floxed control mice including 16 males and 8 females; n = 21 IC-BKα–KO mice including 14 males and 7 females.
Figure 9
Figure 9. Immunodetectable apical BKα is more abundant in the DCT of IC-BKα–KO versus floxed control mice fed a HK diet for 10 days.
Colabeling for BKα (A and D) and NCC (B and E) was performed in fixed kidney slices from HK-fed floxed control (A–C) and IC-BKα–KO (D–F) mice using antibodies directed against BKα (green; A and D) and NCC (red; B and E) to identify the DCT. The merged images (C and F) reveal BKα colocalization with NCC in the apical and subapical domains of DCT cells in control (C) and IC-BKα–KO (F) mice. Scale bars: 40 μm. (G) The mean fluorescence intensity (MFI) of BKα was measured in the apical + subapical region (defined by NCC labeling) of individually identified cells, captured in profile, in sections from 3 mice of each genotype. MFIs in the IC-BKα–KO (41 cells in 9 tubules) were normalized to the average of that measured in the floxed control (43 cells in 11 tubules). Analysis revealed that apical + subapical BKα abundance was 57% greater in IC-BKα–KO than control DCT. Individual data points, as well as median ± quartiles, are shown. *P < 0.001, by Mann-Whitney U test.

Similar articles

Cited by

References

    1. Frindt G, Palmer LG. Low-conductance K channels in apical membrane of rat cortical collecting tubule. Am J Physiol. 1989;256(1 Pt 2):F143–F151. - PubMed
    1. Frindt G, Palmer LG. Apical potassium channels in the rat connecting tubule. Am J Physiol Renal Physiol. 2004;287(5):F1030–F1037. doi: 10.1152/ajprenal.00169.2004. - DOI - PubMed
    1. Satlin LM, Palmer LG. Apical K+ conductance in maturing rabbit principal cell. Am J Physiol. 1997;272(3 Pt 2):F397–F404. - PubMed
    1. Wang WH, Schwab A, Giebisch G. Regulation of small-conductance K+ channel in apical membrane of rat cortical collecting tubule. Am J Physiol. 1990;259(3 Pt 2):F494–F502. - PubMed
    1. Xu JZ, Hall AE, Peterson LN, Bienkowski MJ, Eessalu TE, Hebert SC. Localization of the ROMK protein on apical membranes of rat kidney nephron segments. Am J Physiol. 1997;273(5):F739–F748. - PubMed

Publication types

MeSH terms

Substances